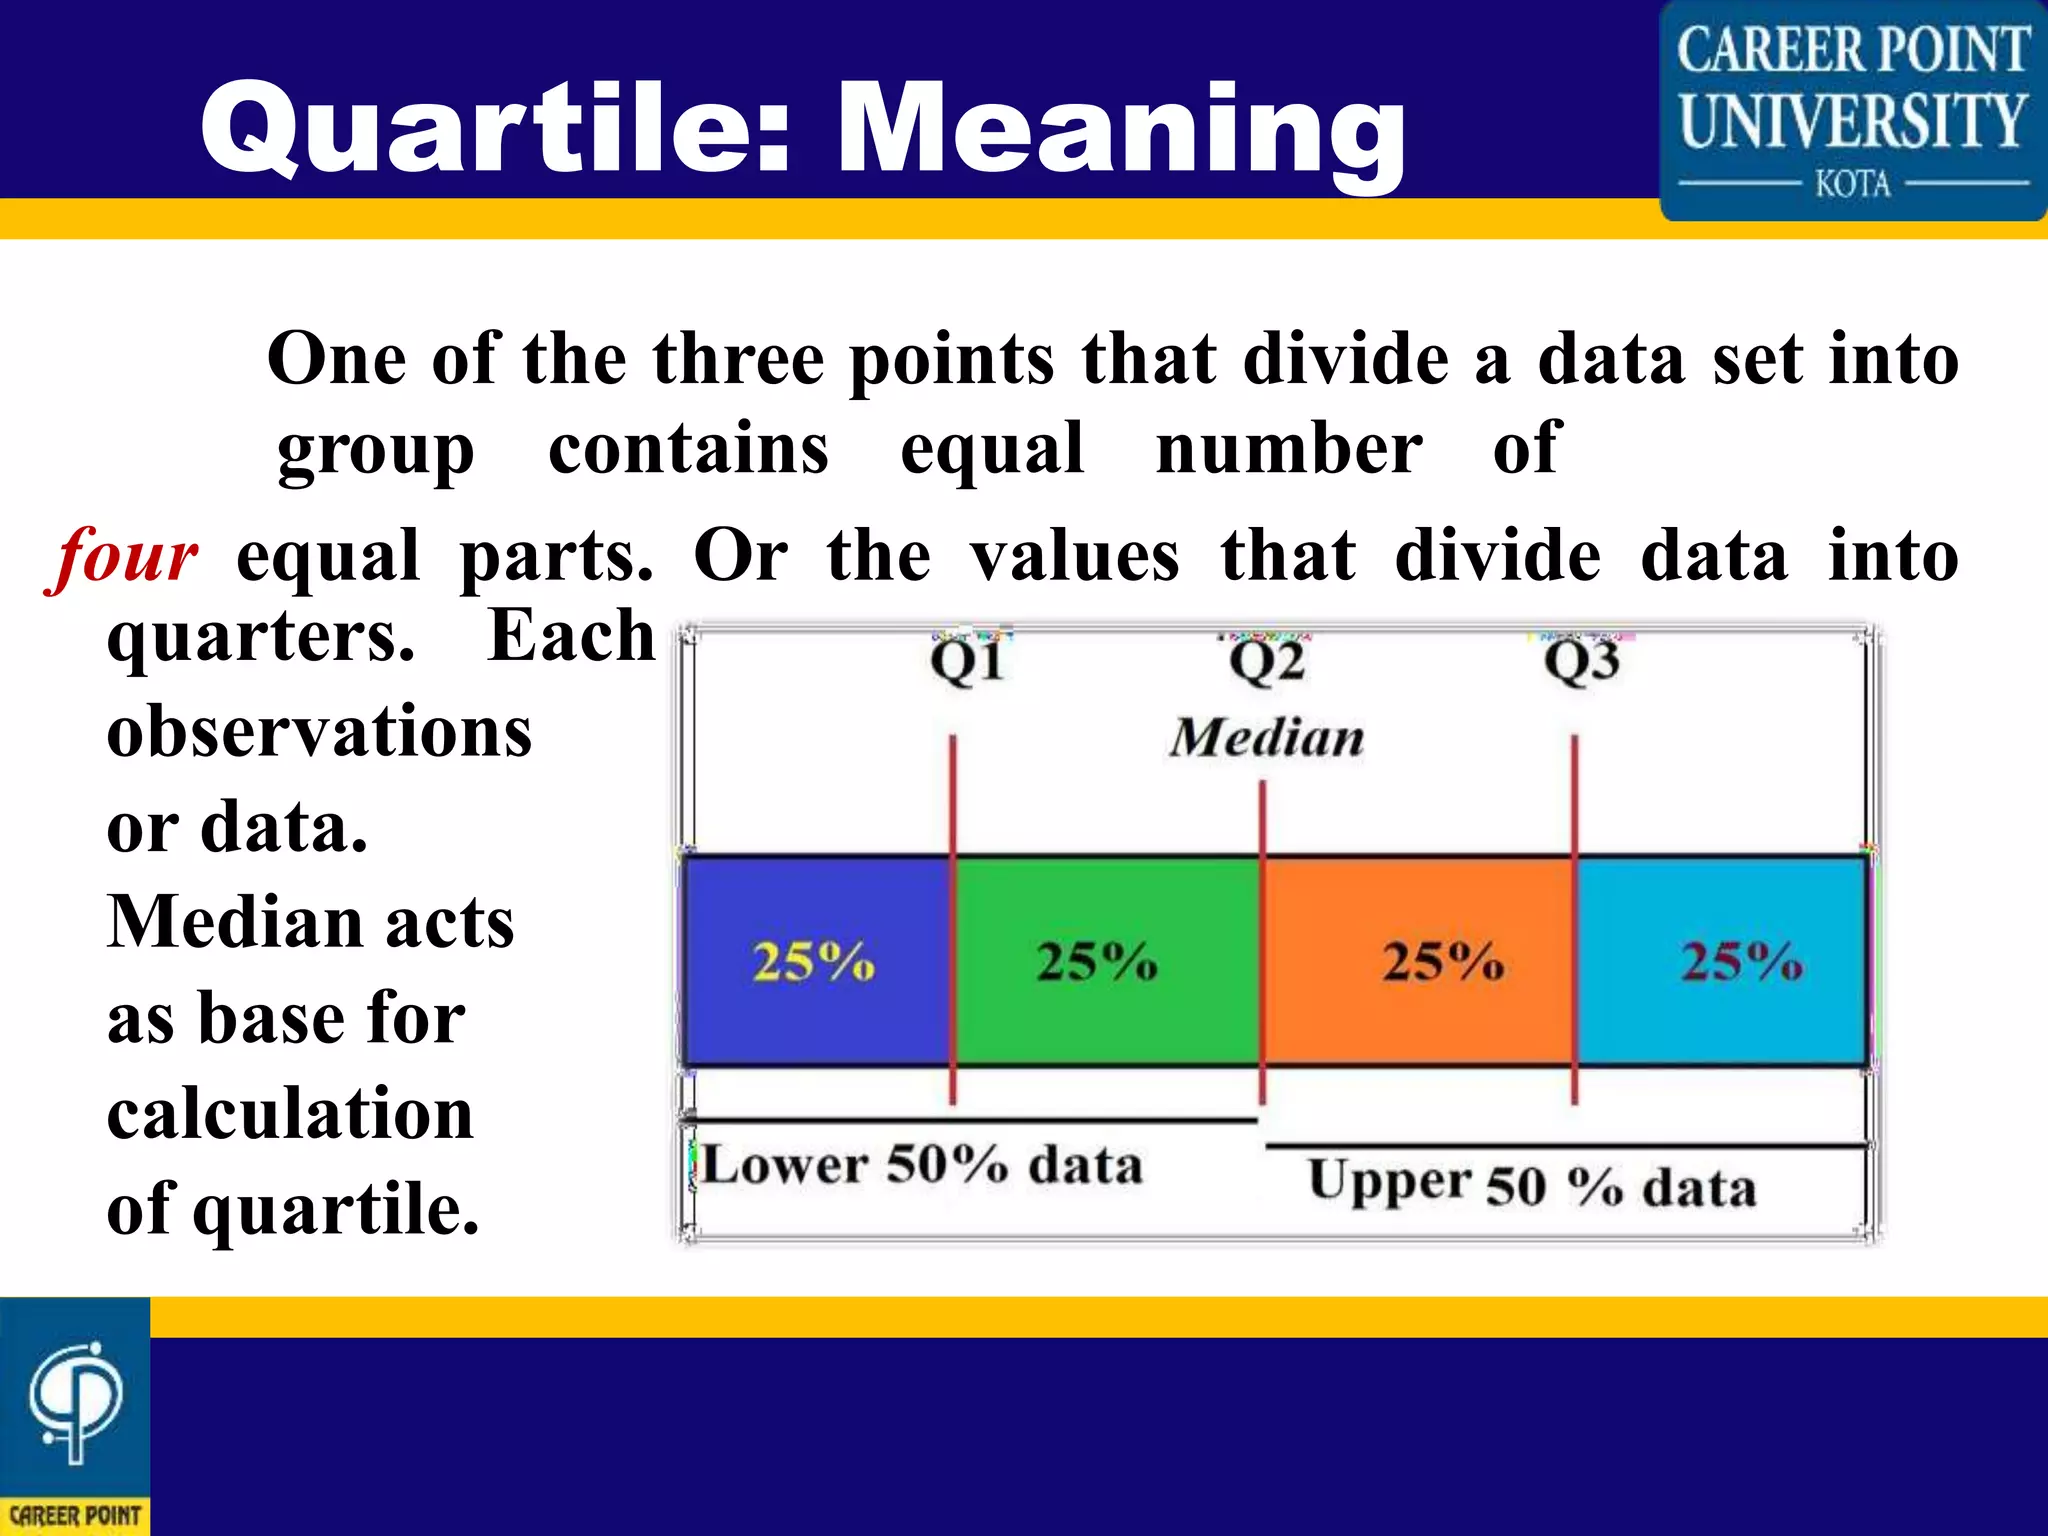
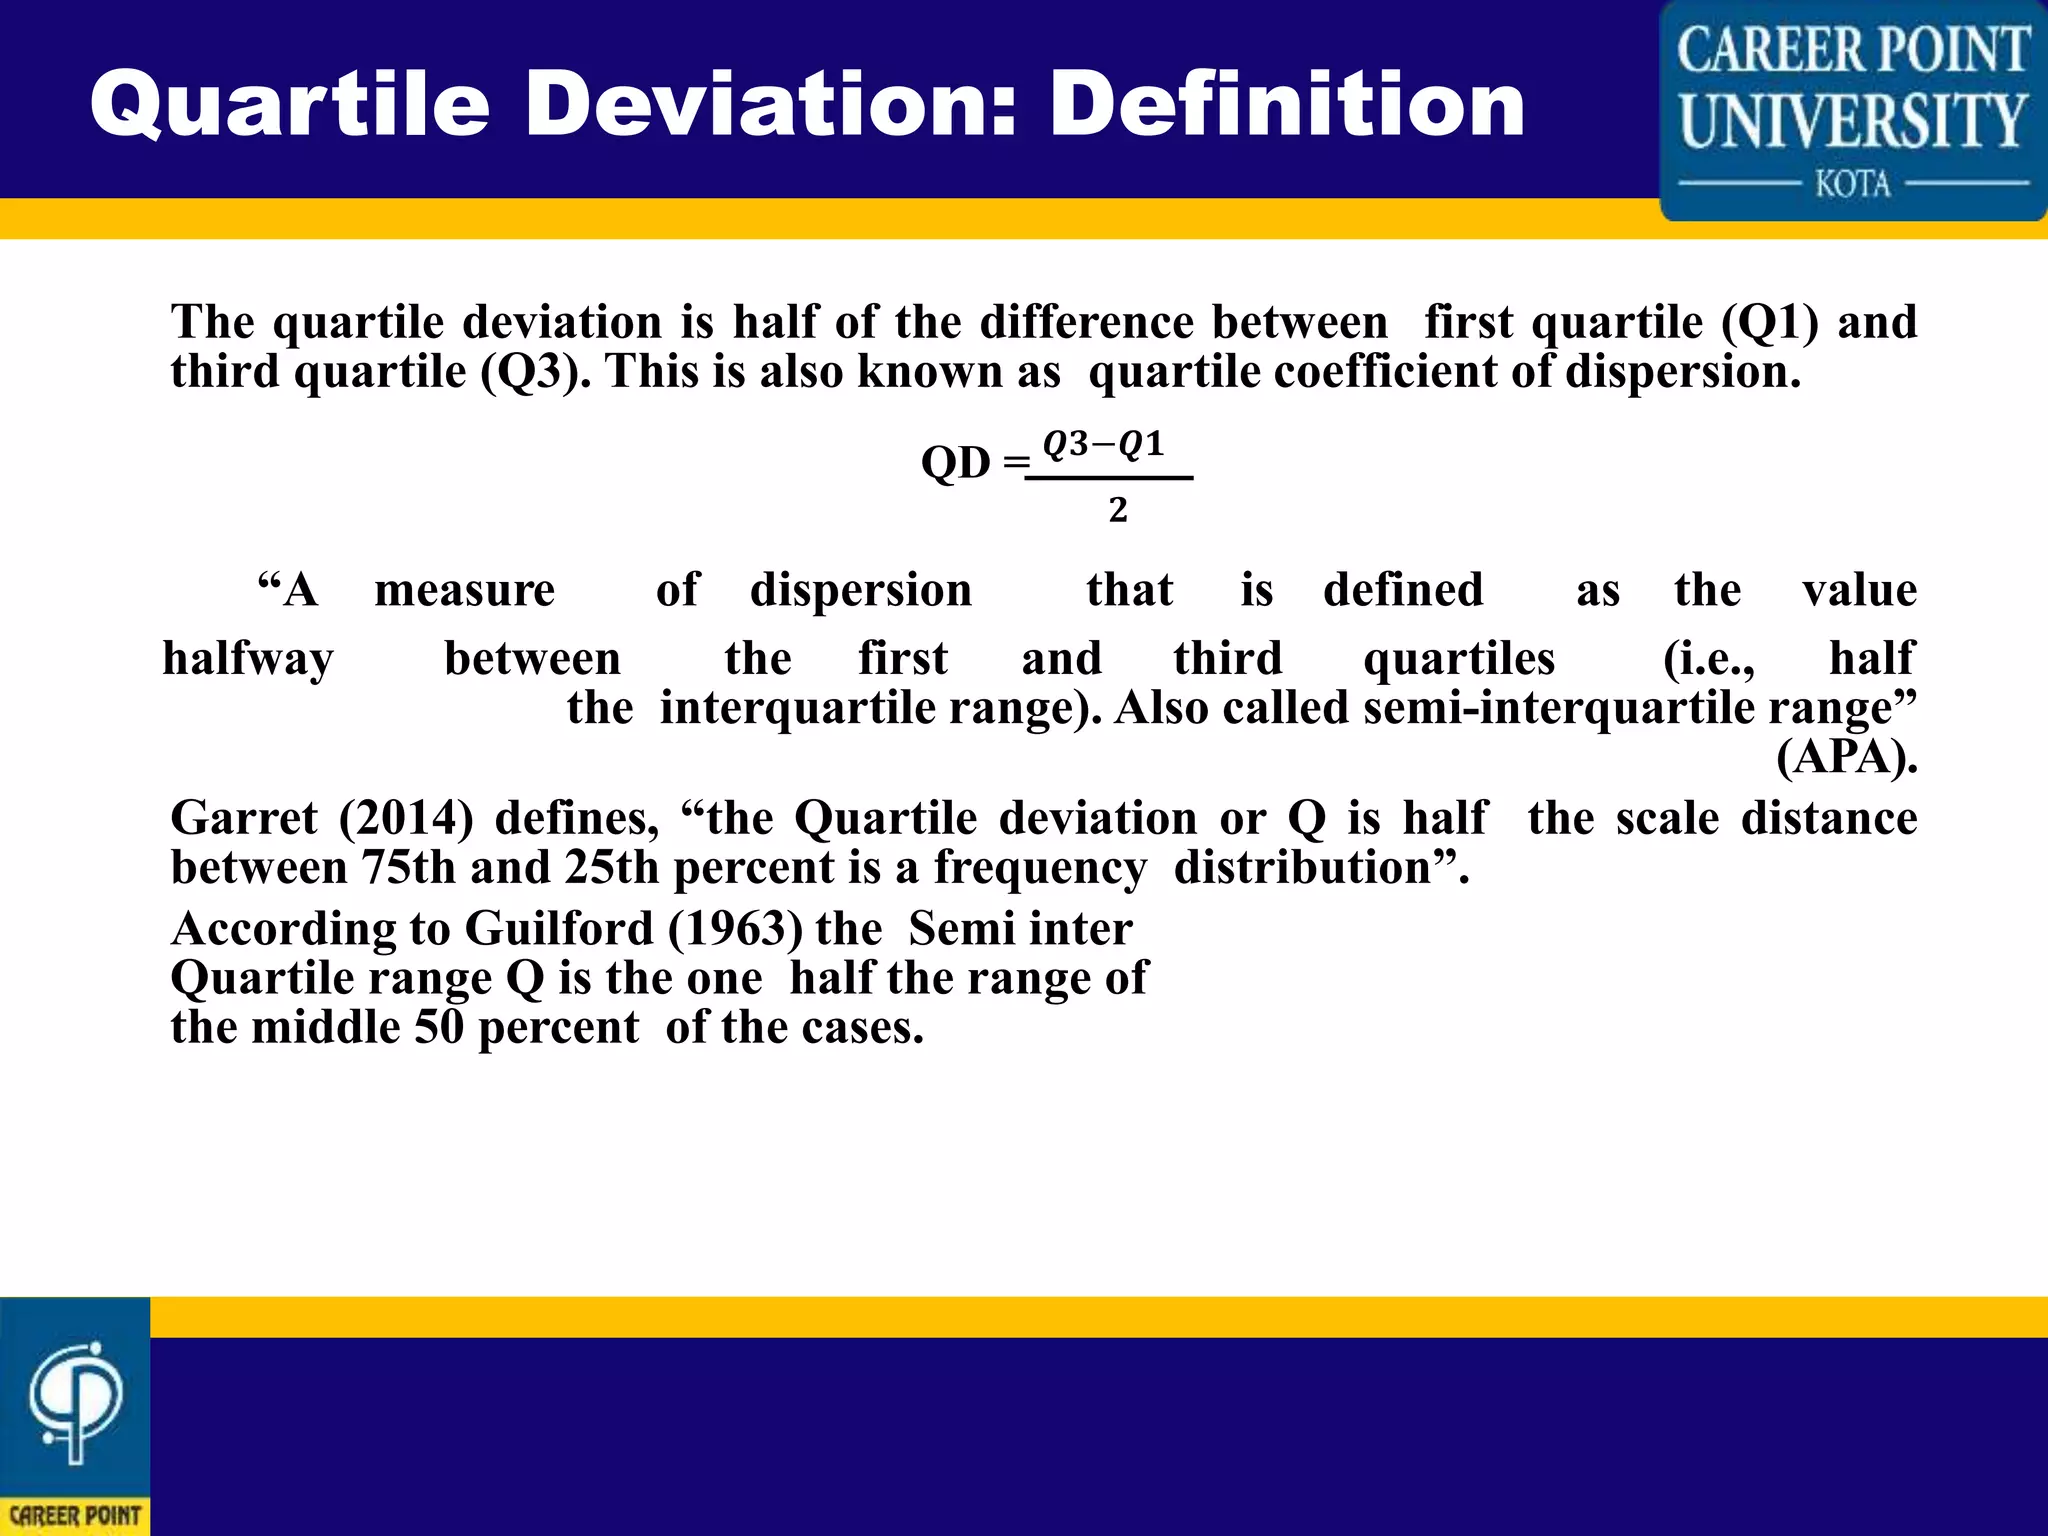
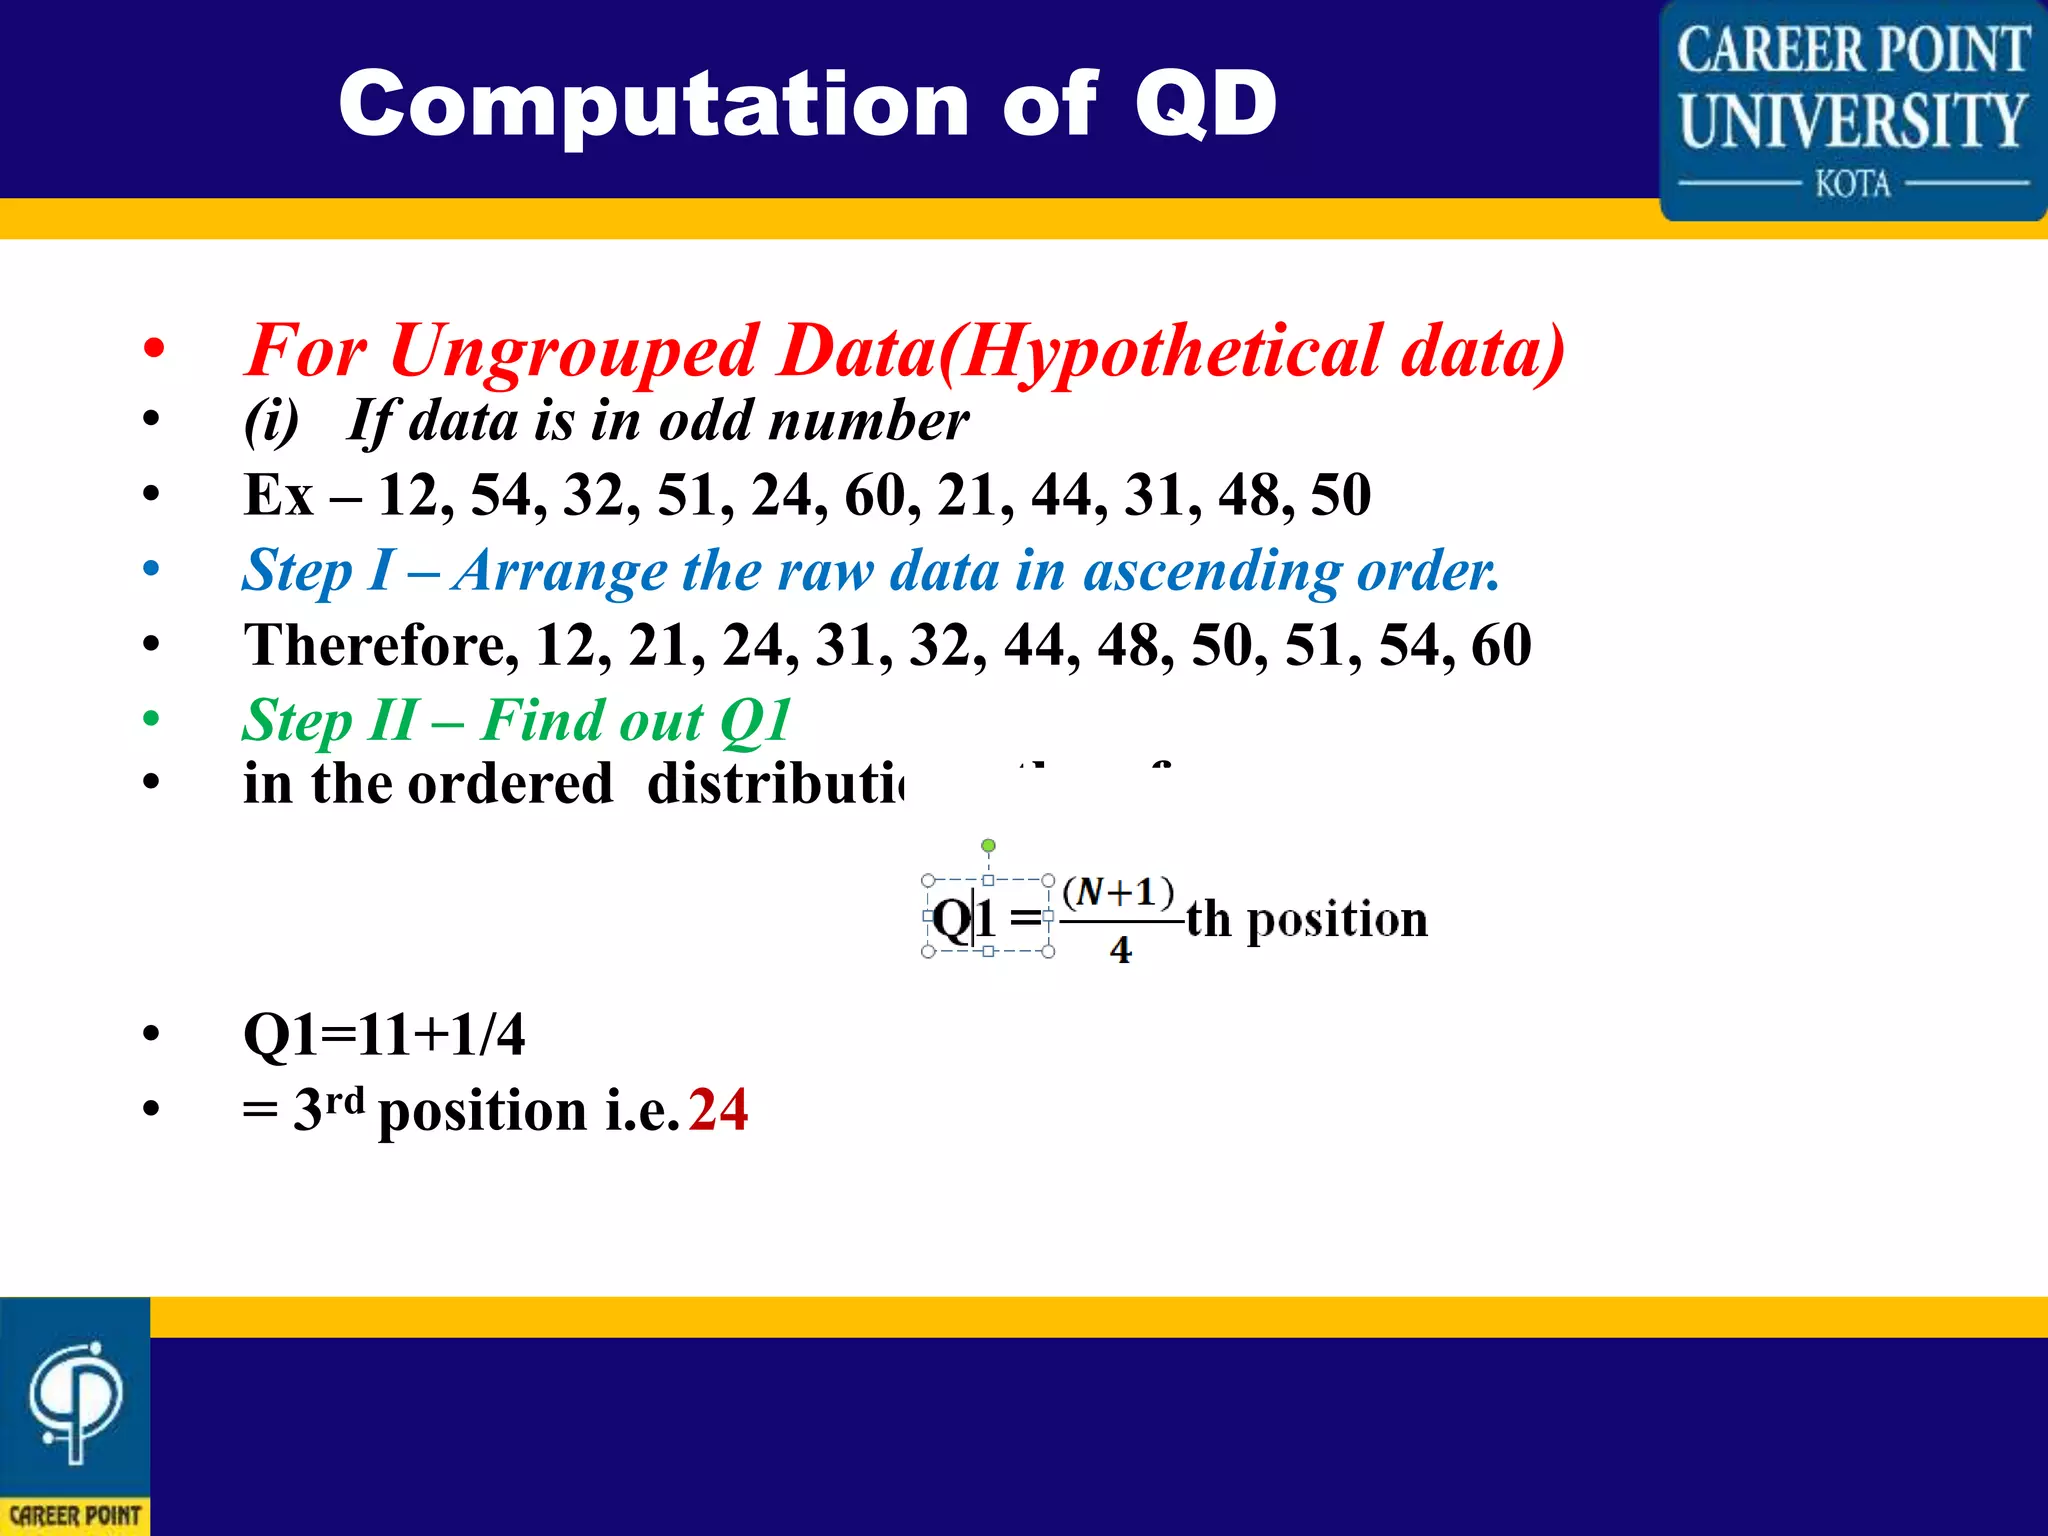
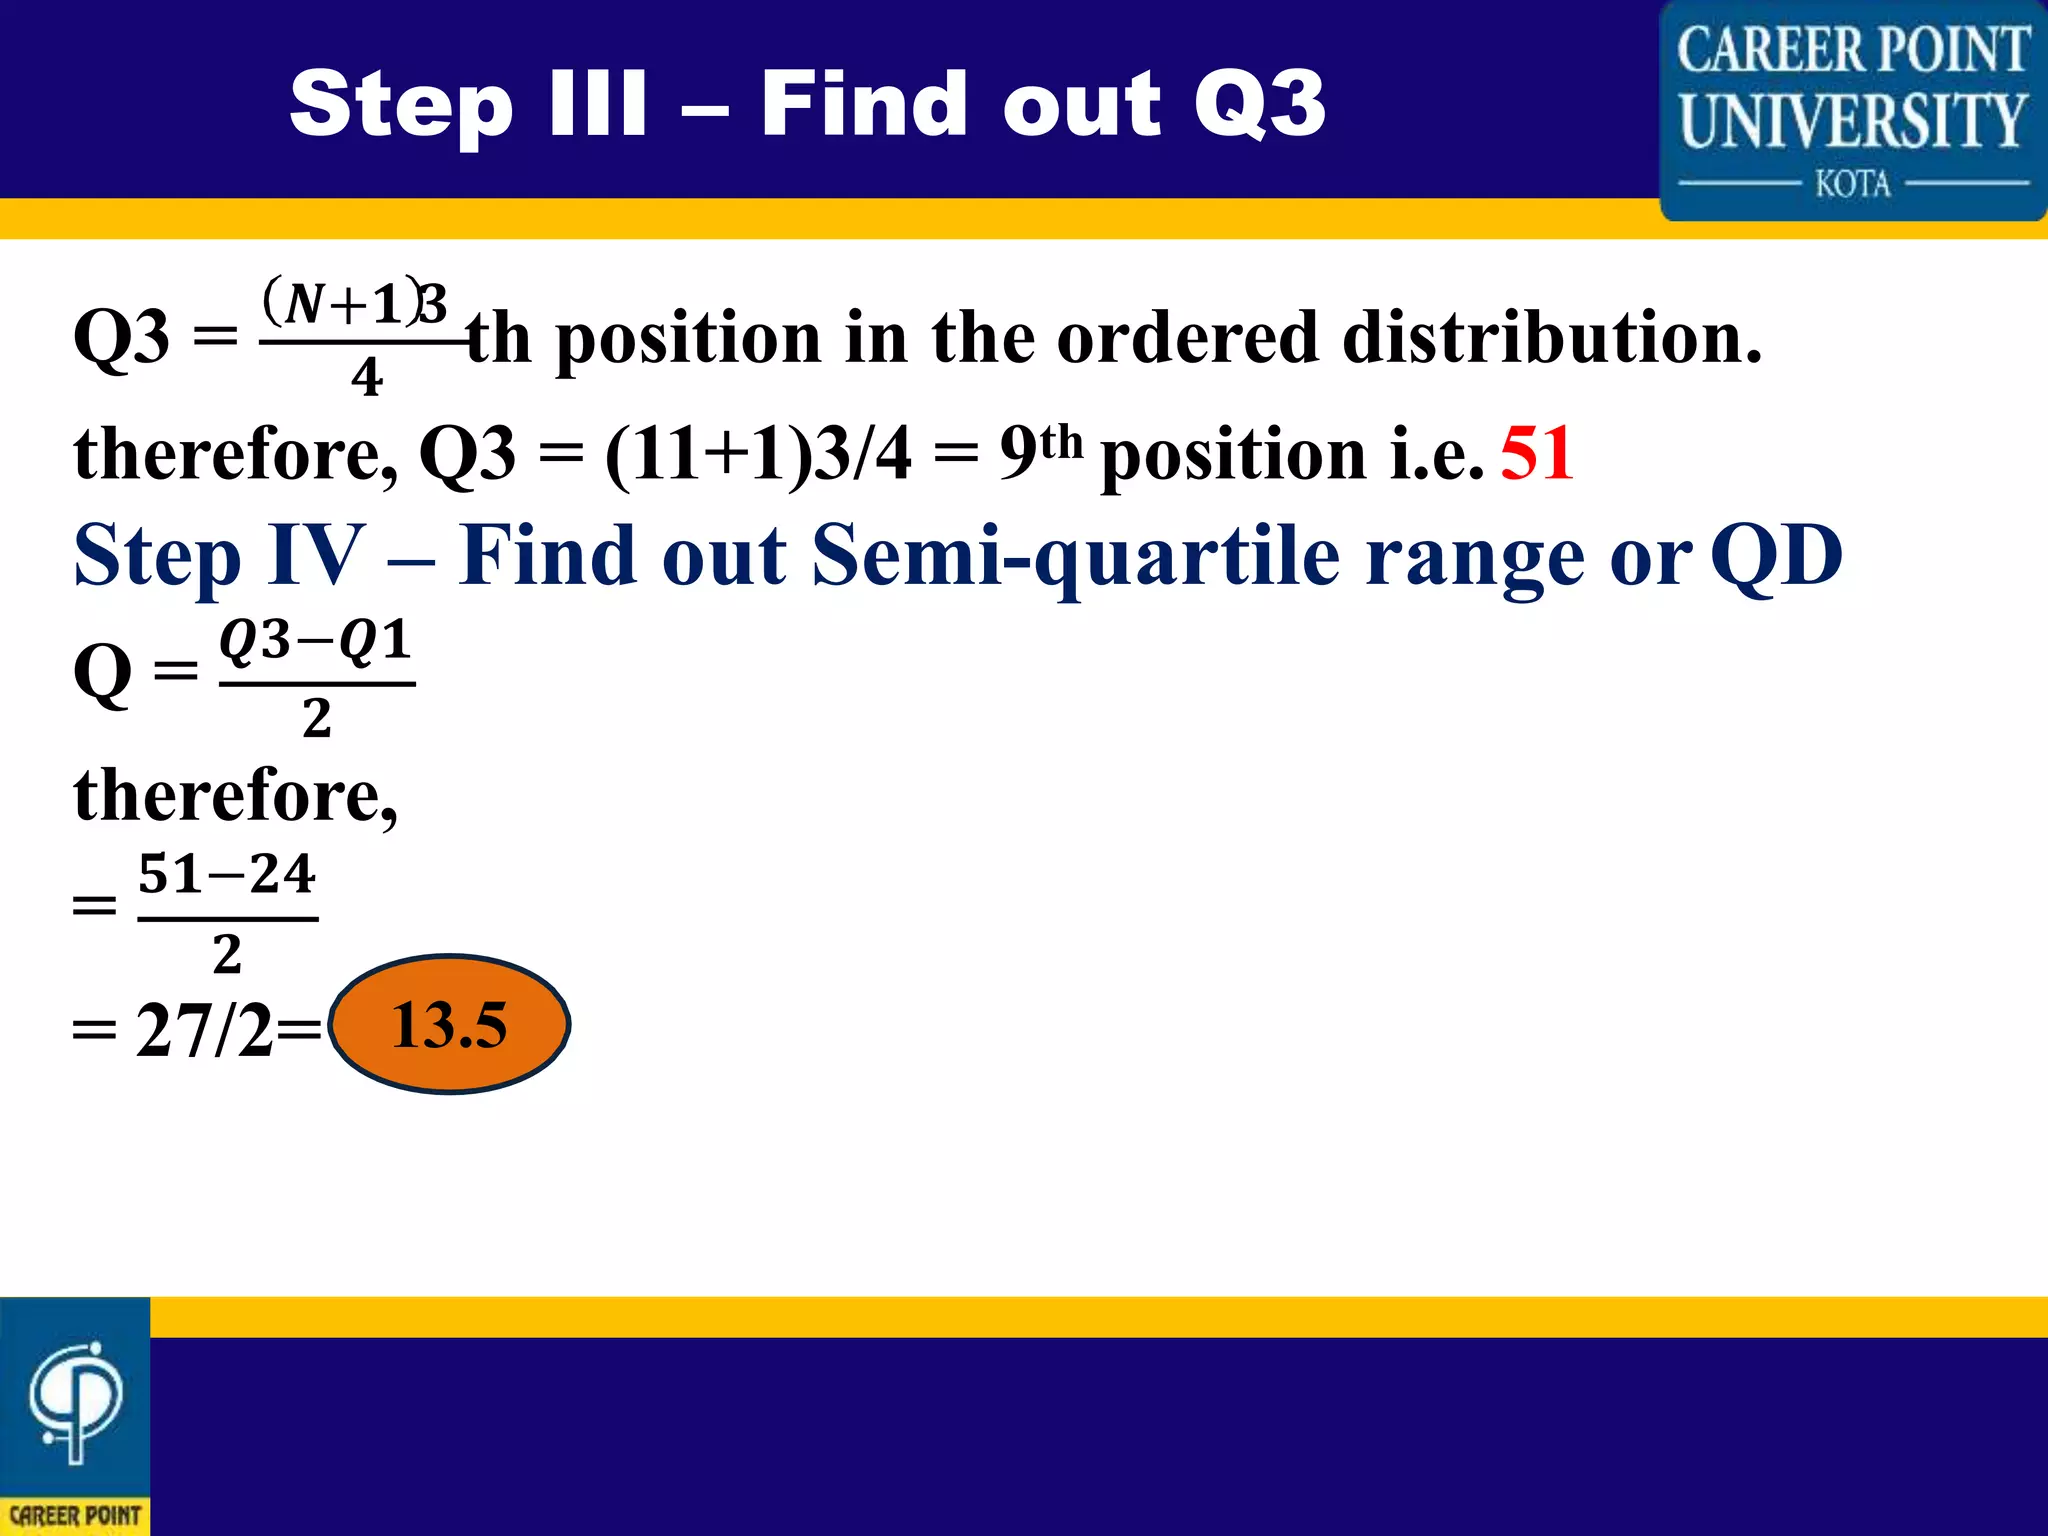
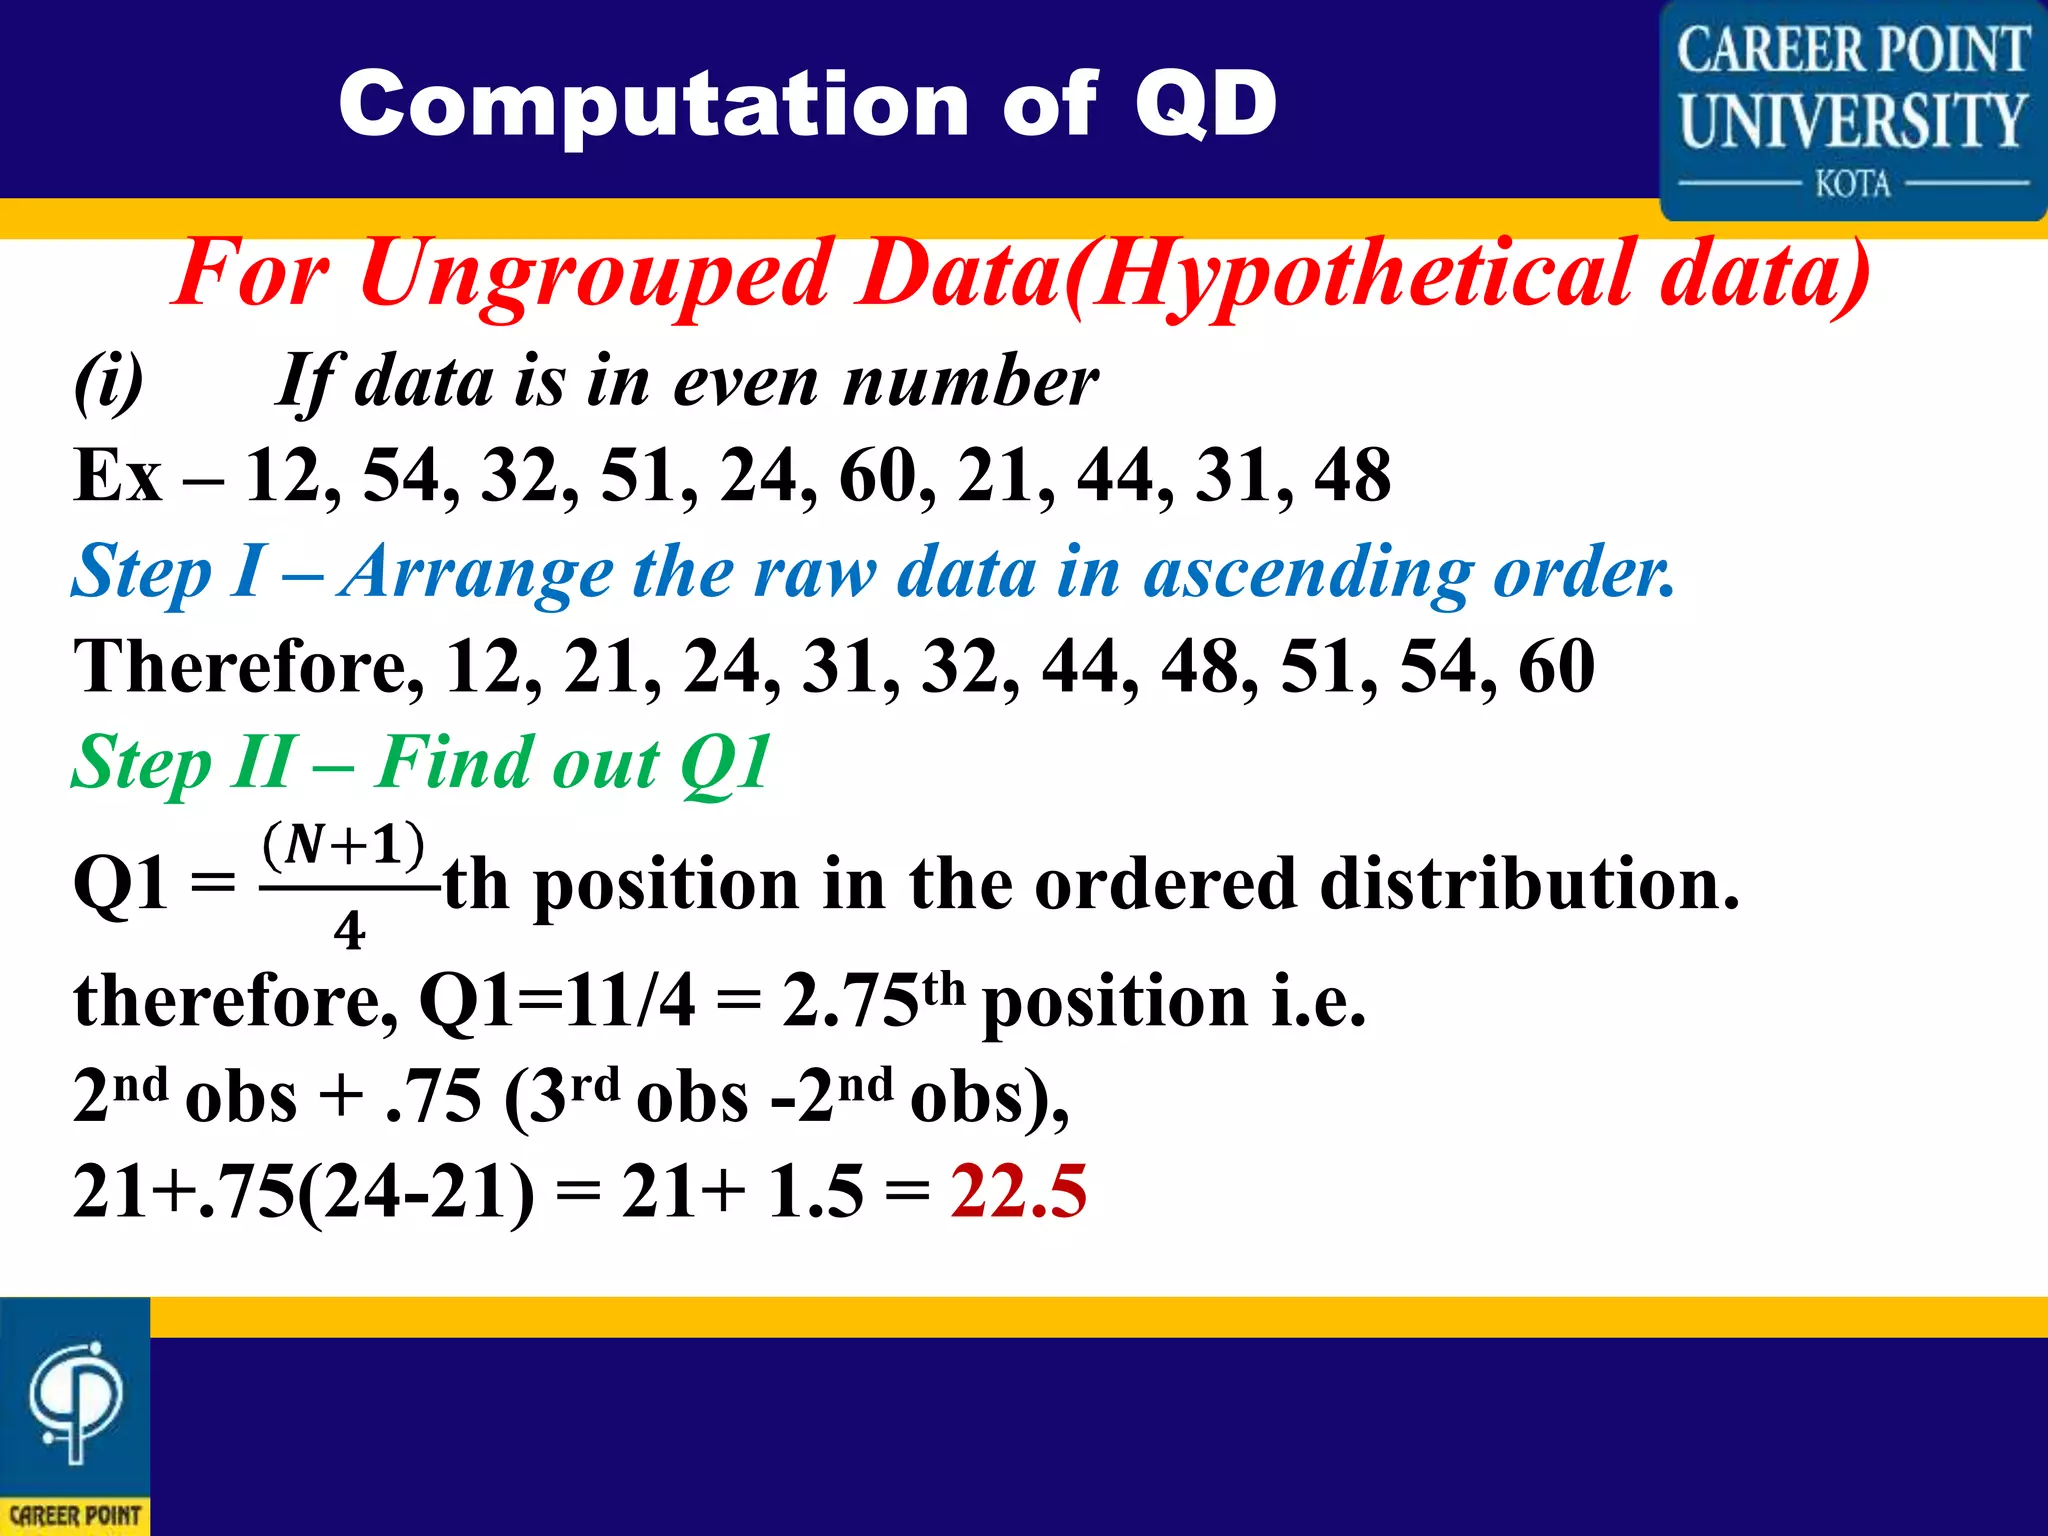
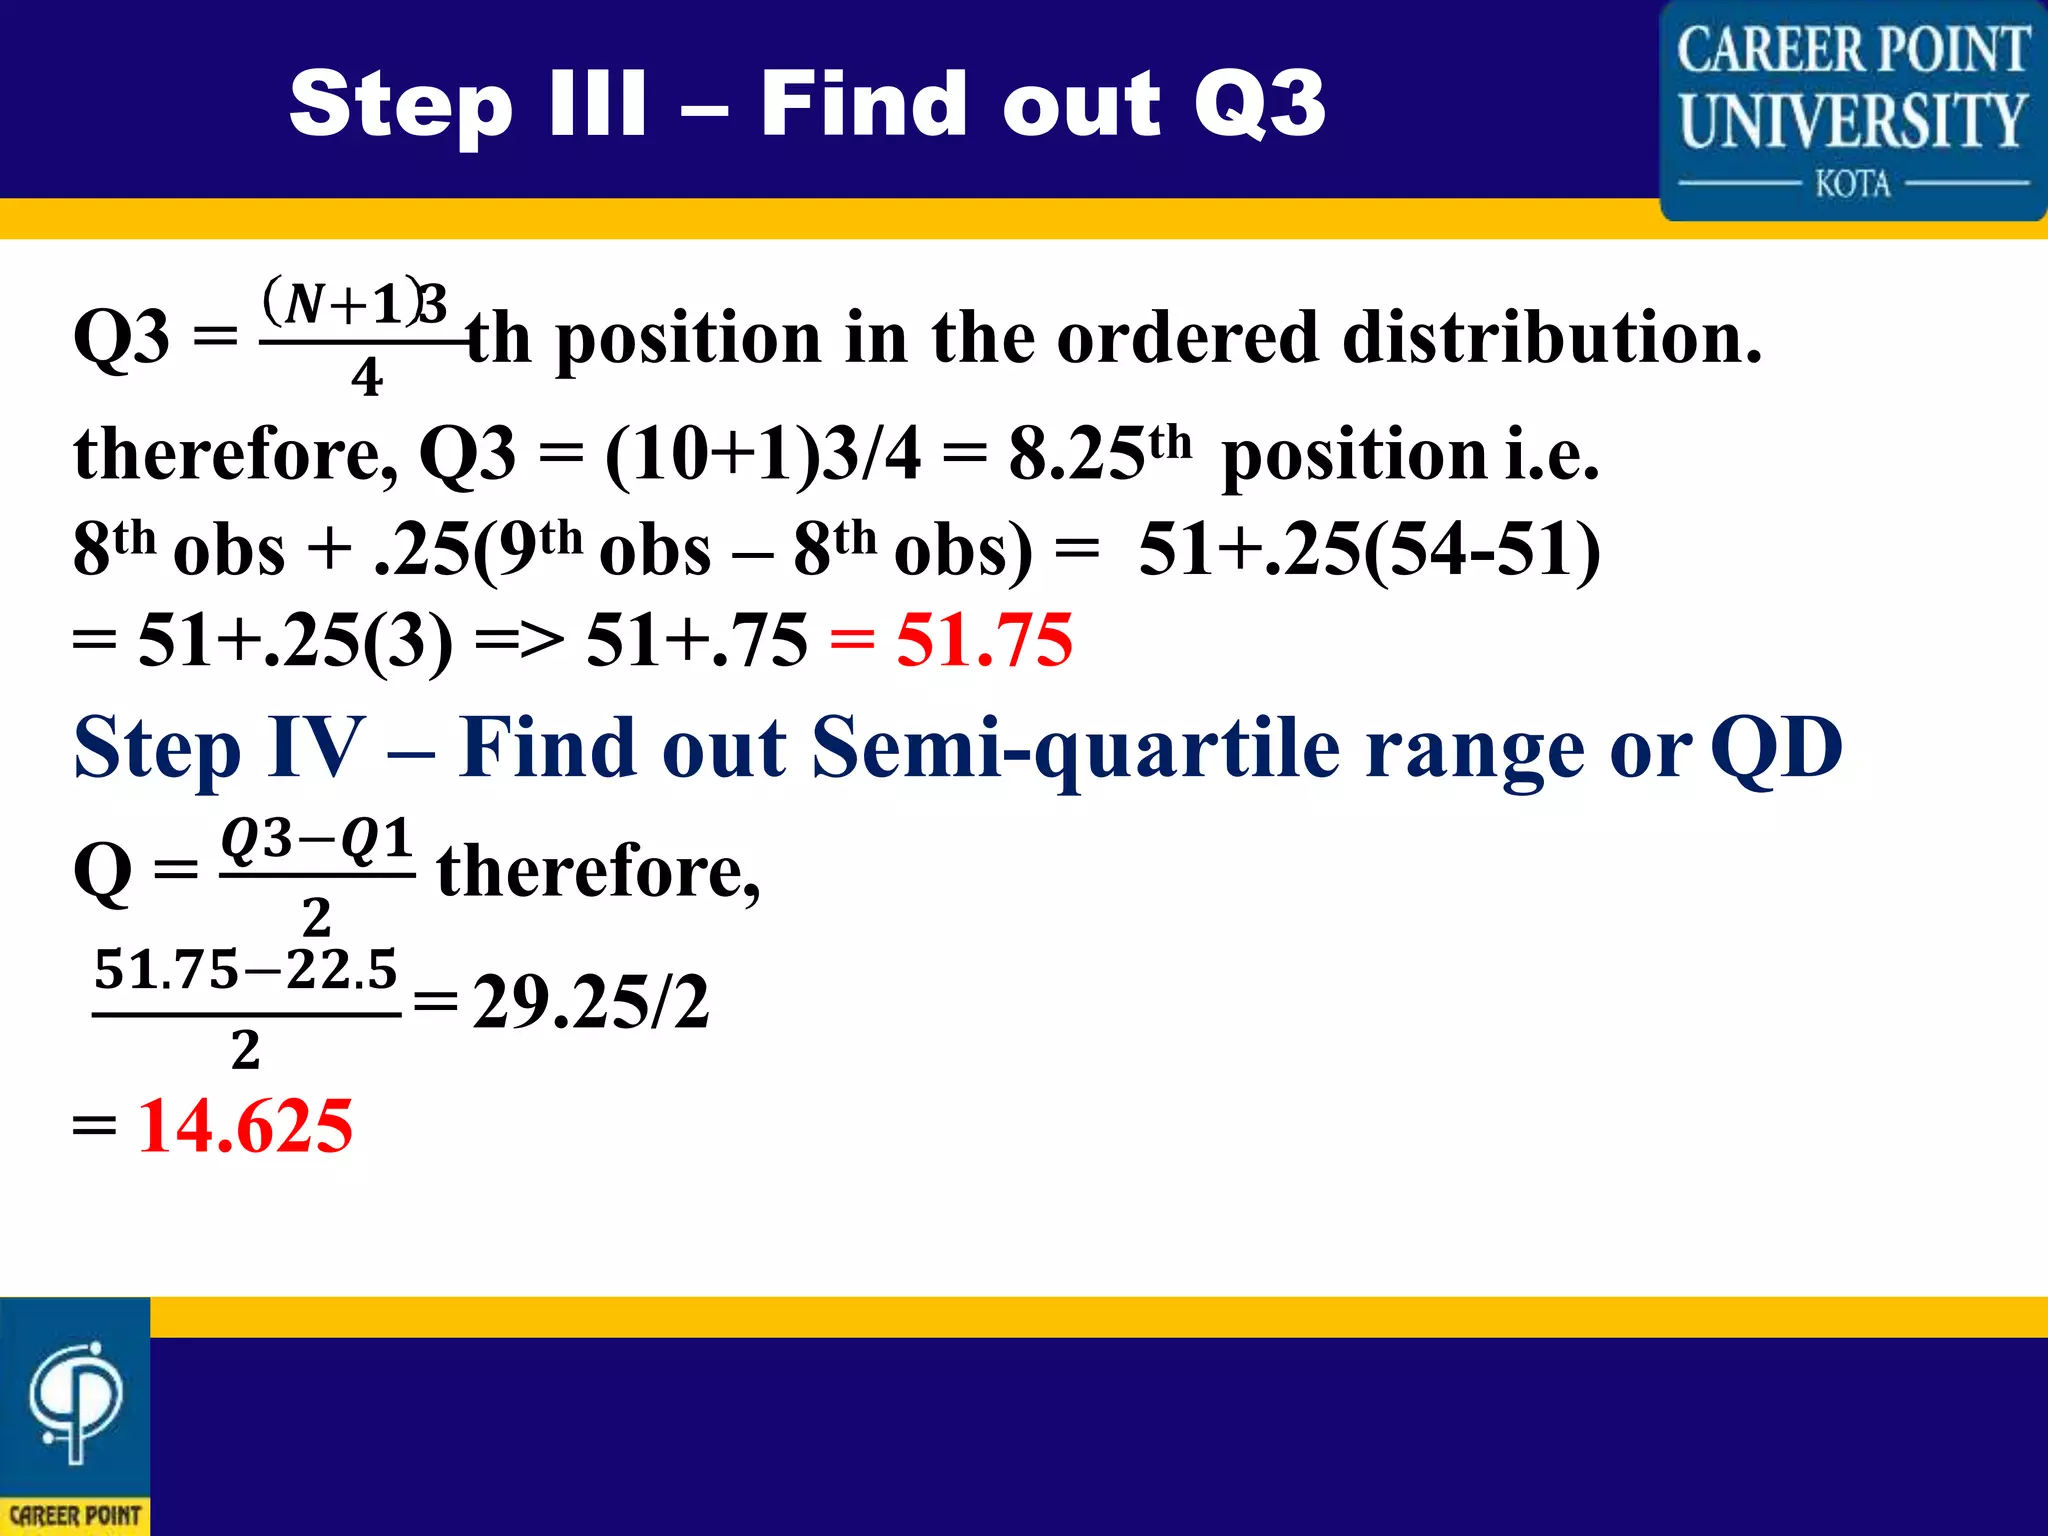
By
Dr. Abhishek Srivastava
Quartile
Deviation
Quartile: Meaning
One of the three points that divide a data set into
four equal parts. Or the values that divide data into
group contains equal number of
quarters. Each
observations
or data.
Median acts
as base for
calculation
of quartile.
The quartile deviation is half of the difference between first quartile (Q1) and
third quartile (Q3). This is also known as quartile coefficient of dispersion.
QD = 𝑸𝟑−𝑸𝟏
𝟐
“A measure of dispersion that is defined as the value
halfway between the first and third quartiles (i.e., half
the interquartile range). Also called semi-interquartile range”
(APA).
Garret (2014) defines, “the Quartile deviation or Q is half the scale distance
between 75th and 25th percent is a frequency distribution”.
According to Guilford (1963) the Semi inter
Quartile range Q is the one half the range of
the middle 50 percent of the cases.
Quartile Deviation: Definition
So, this way we have three quartiles i.e. Q1, Q2 and Q3.
Q1 – It is the midpoint of lowest 50% of data and
also known as Lowest quartile or first quartile.
Q2 – It is the median of the data or the middle point of a given data set
and also known as second quartile.
Q3 – It is the midpoint of highest 50% of data and also known as highest
quartile or third quartile.
Thus the quartile
measures the dispersion
of score above and below
the median by dividing
the entire data set into
four equal groups.
Explanation
• For Ungrouped Data(Hypothetical data)
• (i) If data is in odd number
• Ex – 12, 54, 32, 51, 24, 60, 21, 44, 31, 48, 50
• Step I – Arrange the raw data in ascending order.
• Therefore, 12, 21, 24, 31, 32, 44, 48, 50, 51, 54, 60
• Step II – Find out Q1
• in the ordered distribution. therefore,
• Q1=11+1/4
• = 3rd position i.e.24
Computation of QD
Step III – Find out Q3
Q3 = 𝑵+𝟏 𝟑
th position in the ordered distribution.𝟒
therefore, Q3 = (11+1)3/4 = 9th position i.e. 51
Step IV – Find out Semi-quartile range or QD
Q = 𝑸𝟑−𝑸𝟏
𝟐
therefore,
= 𝟓𝟏−𝟐𝟒
𝟐
= 27/2= 13.5
Computation of QD
For Ungrouped Data(Hypothetical data)
(i) If data is in even number
Ex – 12, 54, 32, 51, 24, 60, 21, 44, 31, 48
Step I – Arrange the raw data in ascending order.
Therefore, 12, 21, 24, 31, 32, 44, 48, 51, 54, 60
Step II – Find out Q1
Q1 =
𝑵+𝟏
𝟒
th position in the ordered distribution.
therefore, Q1=11/4 = 2.75th position i.e.
2nd obs + .75 (3rd obs -2nd obs),
21+.75(24-21) = 21+ 1.5 = 22.5
Step III – Find out Q3
Q3 = 𝑵+𝟏 𝟑
th position in the ordered distribution.𝟒
therefore, Q3 = (10+1)3/4 = 8.25th position i.e.
8th obs + .25(9th obs – 8th obs) = 51+.25(54-51)
= 51+.25(3) => 51+.75 = 51.75
Step IV – Find out Semi-quartile range or QD
𝟐
Q = 𝑸𝟑−𝑸𝟏
therefore,
𝟓𝟏.𝟕𝟓−𝟐𝟐.𝟓
= 29.25/2
𝟐
= 14.625
Thanks

Quartile deviation

  • 1.
  • 2.
    Quartile: Meaning One ofthe three points that divide a data set into four equal parts. Or the values that divide data into group contains equal number of quarters. Each observations or data. Median acts as base for calculation of quartile.
  • 3.
    The quartile deviationis half of the difference between first quartile (Q1) and third quartile (Q3). This is also known as quartile coefficient of dispersion. QD = 𝑸𝟑−𝑸𝟏 𝟐 “A measure of dispersion that is defined as the value halfway between the first and third quartiles (i.e., half the interquartile range). Also called semi-interquartile range” (APA). Garret (2014) defines, “the Quartile deviation or Q is half the scale distance between 75th and 25th percent is a frequency distribution”. According to Guilford (1963) the Semi inter Quartile range Q is the one half the range of the middle 50 percent of the cases. Quartile Deviation: Definition
  • 4.
    So, this waywe have three quartiles i.e. Q1, Q2 and Q3. Q1 – It is the midpoint of lowest 50% of data and also known as Lowest quartile or first quartile. Q2 – It is the median of the data or the middle point of a given data set and also known as second quartile. Q3 – It is the midpoint of highest 50% of data and also known as highest quartile or third quartile. Thus the quartile measures the dispersion of score above and below the median by dividing the entire data set into four equal groups. Explanation
  • 5.
    • For UngroupedData(Hypothetical data) • (i) If data is in odd number • Ex – 12, 54, 32, 51, 24, 60, 21, 44, 31, 48, 50 • Step I – Arrange the raw data in ascending order. • Therefore, 12, 21, 24, 31, 32, 44, 48, 50, 51, 54, 60 • Step II – Find out Q1 • in the ordered distribution. therefore, • Q1=11+1/4 • = 3rd position i.e.24 Computation of QD
  • 6.
    Step III –Find out Q3 Q3 = 𝑵+𝟏 𝟑 th position in the ordered distribution.𝟒 therefore, Q3 = (11+1)3/4 = 9th position i.e. 51 Step IV – Find out Semi-quartile range or QD Q = 𝑸𝟑−𝑸𝟏 𝟐 therefore, = 𝟓𝟏−𝟐𝟒 𝟐 = 27/2= 13.5
  • 7.
    Computation of QD ForUngrouped Data(Hypothetical data) (i) If data is in even number Ex – 12, 54, 32, 51, 24, 60, 21, 44, 31, 48 Step I – Arrange the raw data in ascending order. Therefore, 12, 21, 24, 31, 32, 44, 48, 51, 54, 60 Step II – Find out Q1 Q1 = 𝑵+𝟏 𝟒 th position in the ordered distribution. therefore, Q1=11/4 = 2.75th position i.e. 2nd obs + .75 (3rd obs -2nd obs), 21+.75(24-21) = 21+ 1.5 = 22.5
  • 8.
    Step III –Find out Q3 Q3 = 𝑵+𝟏 𝟑 th position in the ordered distribution.𝟒 therefore, Q3 = (10+1)3/4 = 8.25th position i.e. 8th obs + .25(9th obs – 8th obs) = 51+.25(54-51) = 51+.25(3) => 51+.75 = 51.75 Step IV – Find out Semi-quartile range or QD 𝟐 Q = 𝑸𝟑−𝑸𝟏 therefore, 𝟓𝟏.𝟕𝟓−𝟐𝟐.𝟓 = 29.25/2 𝟐 = 14.625
  • 9.