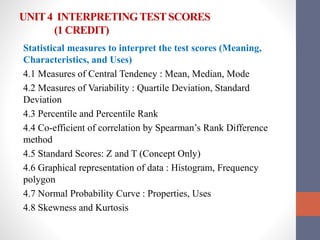
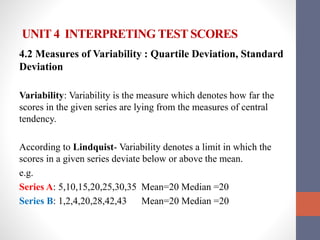
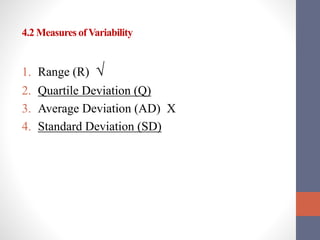
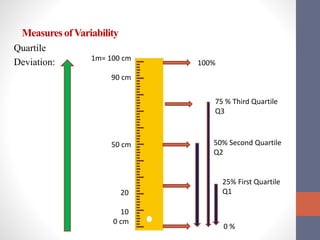
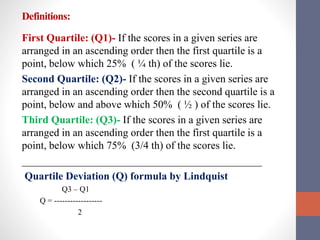
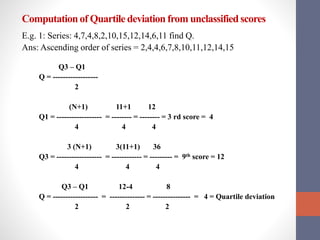
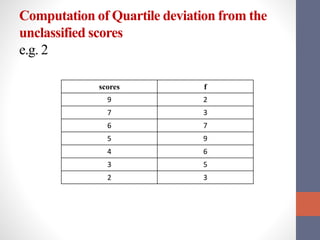
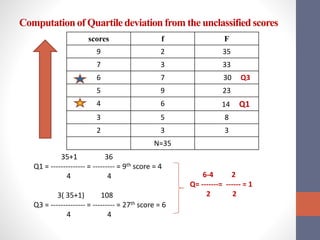
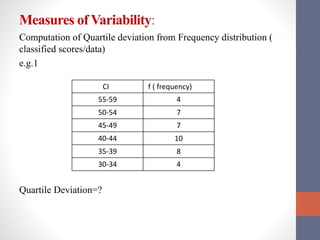
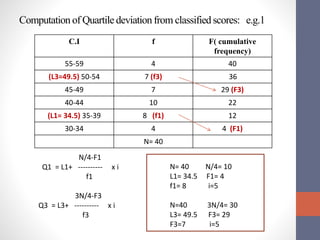
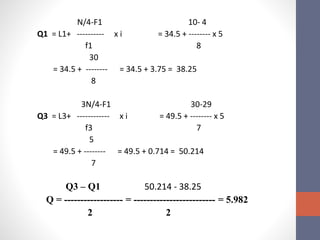
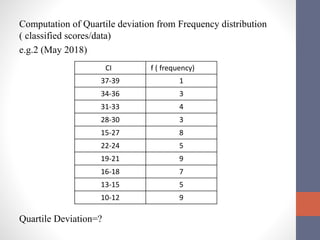
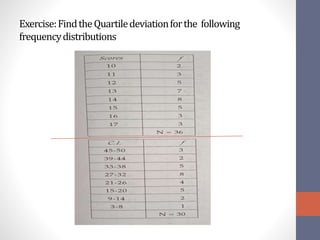
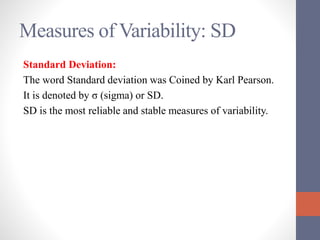
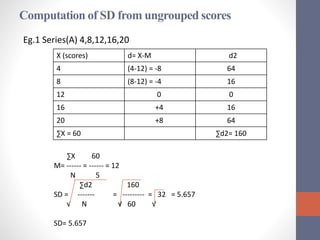
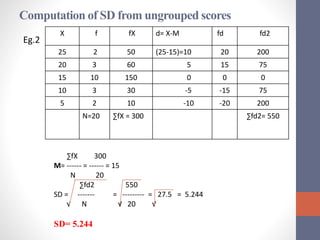
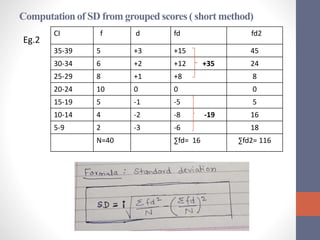
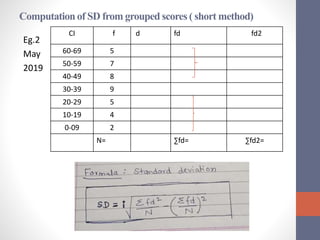
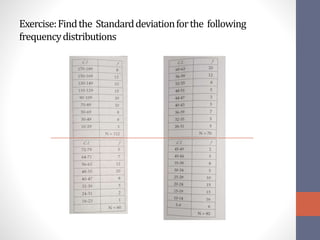
MAEER’s
MIT SaintDnyaneshwarB.Ed.College,
Alandi(Devachi),Pune.
B.Ed. 104
ASSESSMENT AND EVALUATION FOR
LEARNING
Unit 4- INTERPRETING TEST SCORES
(Statistics): (4.2)
By.
Asst.Prof. Gangotri V. Rokade
UNIT4 INTERPRETINGTESTSCORES
(1 CREDIT)
Statistical measures to interpret the test scores (Meaning,
Characteristics, and Uses)
4.1 Measures of Central Tendency : Mean, Median, Mode
4.2 Measures of Variability : Quartile Deviation, Standard
Deviation
4.3 Percentile and Percentile Rank
4.4 Co-efficient of correlation by Spearman’s Rank Difference
method
4.5 Standard Scores: Z and T (Concept Only)
4.6 Graphical representation of data : Histogram, Frequency
polygon
4.7 Normal Probability Curve : Properties, Uses
4.8 Skewness and Kurtosis
UNIT 4 INTERPRETING TEST SCORES
4.2 Measures of Variability : Quartile Deviation, Standard
Deviation
Variability: Variability is the measure which denotes how far the
scores in the given series are lying from the measures of central
tendency.
According to Lindquist- Variability denotes a limit in which the
scores in a given series deviate below or above the mean.
e.g.
Series A: 5,10,15,20,25,30,35 Mean=20 Median =20
Series B: 1,2,4,20,28,42,43 Mean=20 Median =20
4.2 Measures ofVariability
1. Range (R) √
2. Quartile Deviation (Q)
3. Average Deviation (AD) X
4. Standard Deviation (SD)
Measures ofVariability
Quartile
Deviation: 1m= 100 cm
90 cm
50 cm
20
10
0 cm
75 % Third Quartile
Q3
50% Second Quartile
Q2
25% First Quartile
Q1
100%
0 %
Definitions:
First Quartile: (Q1)- If the scores in a given series are
arranged in an ascending order then the first quartile is a
point, below which 25% ( ¼ th) of the scores lie.
Second Quartile: (Q2)- If the scores in a given series are
arranged in an ascending order then the second quartile is a
point, below and above which 50% ( ½ ) of the scores lie.
Third Quartile: (Q3)- If the scores in a given series are
arranged in an ascending order then the first quartile is a
point, below which 75% (3/4 th) of the scores lie.
_____________________________________________
Quartile Deviation (Q) formula by Lindquist
Q3 – Q1
Q = ------------------
2
Computationof Quartile deviation from unclassifiedscores
E.g. 1: Series: 4,7,4,8,2,10,15,12,14,6,11 find Q.
Ans: Ascending order of series = 2,4,4,6,7,8,10,11,12,14,15
Q3 – Q1
Q = ------------------
2
(N+1) 11+1 12
Q1 = ------------------ = -------- = -------- = 3 rd score = 4
4 4 4
3 (N+1) 3(11+1) 36
Q3 = ------------------ = ------------ = --------- = 9th score = 12
4 4 4
Q3 – Q1 12-4 8
Q = ------------------ = -------------- = --------------- = 4 = Quartile deviation
2 2 2
Computation of Quartile deviation from the
unclassified scores
e.g. 2
scores f
9 2
7 3
6 7
5 9
4 6
3 5
2 3
Computationof Quartile deviation from the unclassified scores
scores f F
9 2 35
7 3 33
6 7 30 Q3
5 9 23
4 6 14 Q1
3 5 8
2 3 3
N=35
35+1 36
Q1 = -------------- = --------- = 9th score = 4
4 4
3( 35+1) 108
Q3 = -------------- = --------- = 27th score = 6
4 4
6-4 2
Q= -------= ------ = 1
2 2
Measures of Variability:
Computation of Quartile deviation from Frequency distribution (
classified scores/data)
e.g.1
Quartile Deviation=?
CI f ( frequency)
55-59 4
50-54 7
45-49 7
40-44 10
35-39 8
30-34 4
Computation of Quartile deviationfrom classifiedscores: e.g.1
C.I f F( cumulative
frequency)
55-59 4 40
(L3=49.5) 50-54 7 (f3) 36
45-49 7 29 (F3)
40-44 10 22
(L1= 34.5) 35-39 8 (f1) 12
30-34 4 4 (F1)
N= 40
N/4-F1
Q1 = L1+ ---------- x i
f1
3N/4-F3
Q3 = L3+ ---------- x i
f3
N= 40 N/4= 10
L1= 34.5 F1= 4
f1= 8 i=5
N=40 3N/4= 30
L3= 49.5 F3= 29
F3=7 i=5
N/4-F1 10- 4
Q1 = L1+ ---------- x i = 34.5 + -------- x 5
f1 8
30
= 34.5 + -------- = 34.5 + 3.75 = 38.25
8
3N/4-F1 30-29
Q3 = L3+ ------------ x i = 49.5 + -------- x 5
f3 7
5
= 49.5 + -------- = 49.5 + 0.714 = 50.214
7
Q3 – Q1 50.214 - 38.25
Q = ------------------ = ------------------------- = 5.982
2 2
Computation of Quartile deviation from Frequency distribution
( classified scores/data)
e.g.2 (May 2018)
Quartile Deviation=?
CI f ( frequency)
37-39 1
34-36 3
31-33 4
28-30 3
15-27 8
22-24 5
19-21 9
16-18 7
13-15 5
10-12 9
Exercise:FindtheQuartiledeviationforthe following
frequencydistributions
Measures of Variability: SD
Standard Deviation:
The word Standard deviation was Coined by Karl Pearson.
It is denoted by σ (sigma) or SD.
SD is the most reliable and stable measures of variability.
Computation of SD from ungrouped scores
Eg.1 Series(A) 4,8,12,16,20
X (scores) d= X-M d2
4 (4-12) = -8 64
8 (8-12) = -4 16
12 0 0
16 +4 16
20 +8 64
∑X = 60 ∑d2= 160
∑X 60
M= ------ = ------ = 12
N 5
∑d2 160
SD = ------- = --------- = 32 = 5.657
√ N √ 60 √
SD= 5.657
Computation of SD from ungrouped scores
Eg.2
X f fX d= X-M fd fd2
25 2 50 (25-15)=10 20 200
20 3 60 5 15 75
15 10 150 0 0 0
10 3 30 -5 -15 75
5 2 10 -10 -20 200
N=20 ∑fX = 300 ∑fd2= 550
∑fX 300
M= ------ = ------ = 15
N 20
∑fd2 550
SD = ------- = --------- = 27.5 = 5.244
√ N √ 20 √
SD= 5.244
Computationof SD from grouped scores ( short method)
Eg.2
CI f d fd fd2
35-39 5 +3 +15 45
30-34 6 +2 +12 +35 24
25-29 8 +1 +8 8
20-24 10 0 0 0
15-19 5 -1 -5 5
10-14 4 -2 -8 -19 16
5-9 2 -3 -6 18
N=40 ∑fd= 16 ∑fd2= 116
Computationof SD from grouped scores ( short method)
Eg.2
May
2019
CI f d fd fd2
60-69 5
50-59 7
40-49 8
30-39 9
20-29 5
10-19 4
0-09 2
N= ∑fd= ∑fd2=
Exercise:Findthe Standarddeviationforthe following
frequencydistributions

B.Ed.104 unit4.2-statistics

  • 1.
    MAEER’s MIT SaintDnyaneshwarB.Ed.College, Alandi(Devachi),Pune. B.Ed. 104 ASSESSMENTAND EVALUATION FOR LEARNING Unit 4- INTERPRETING TEST SCORES (Statistics): (4.2) By. Asst.Prof. Gangotri V. Rokade
  • 2.
    UNIT4 INTERPRETINGTESTSCORES (1 CREDIT) Statisticalmeasures to interpret the test scores (Meaning, Characteristics, and Uses) 4.1 Measures of Central Tendency : Mean, Median, Mode 4.2 Measures of Variability : Quartile Deviation, Standard Deviation 4.3 Percentile and Percentile Rank 4.4 Co-efficient of correlation by Spearman’s Rank Difference method 4.5 Standard Scores: Z and T (Concept Only) 4.6 Graphical representation of data : Histogram, Frequency polygon 4.7 Normal Probability Curve : Properties, Uses 4.8 Skewness and Kurtosis
  • 3.
    UNIT 4 INTERPRETINGTEST SCORES 4.2 Measures of Variability : Quartile Deviation, Standard Deviation Variability: Variability is the measure which denotes how far the scores in the given series are lying from the measures of central tendency. According to Lindquist- Variability denotes a limit in which the scores in a given series deviate below or above the mean. e.g. Series A: 5,10,15,20,25,30,35 Mean=20 Median =20 Series B: 1,2,4,20,28,42,43 Mean=20 Median =20
  • 4.
    4.2 Measures ofVariability 1.Range (R) √ 2. Quartile Deviation (Q) 3. Average Deviation (AD) X 4. Standard Deviation (SD)
  • 5.
    Measures ofVariability Quartile Deviation: 1m=100 cm 90 cm 50 cm 20 10 0 cm 75 % Third Quartile Q3 50% Second Quartile Q2 25% First Quartile Q1 100% 0 %
  • 6.
    Definitions: First Quartile: (Q1)-If the scores in a given series are arranged in an ascending order then the first quartile is a point, below which 25% ( ¼ th) of the scores lie. Second Quartile: (Q2)- If the scores in a given series are arranged in an ascending order then the second quartile is a point, below and above which 50% ( ½ ) of the scores lie. Third Quartile: (Q3)- If the scores in a given series are arranged in an ascending order then the first quartile is a point, below which 75% (3/4 th) of the scores lie. _____________________________________________ Quartile Deviation (Q) formula by Lindquist Q3 – Q1 Q = ------------------ 2
  • 7.
    Computationof Quartile deviationfrom unclassifiedscores E.g. 1: Series: 4,7,4,8,2,10,15,12,14,6,11 find Q. Ans: Ascending order of series = 2,4,4,6,7,8,10,11,12,14,15 Q3 – Q1 Q = ------------------ 2 (N+1) 11+1 12 Q1 = ------------------ = -------- = -------- = 3 rd score = 4 4 4 4 3 (N+1) 3(11+1) 36 Q3 = ------------------ = ------------ = --------- = 9th score = 12 4 4 4 Q3 – Q1 12-4 8 Q = ------------------ = -------------- = --------------- = 4 = Quartile deviation 2 2 2
  • 8.
    Computation of Quartiledeviation from the unclassified scores e.g. 2 scores f 9 2 7 3 6 7 5 9 4 6 3 5 2 3
  • 9.
    Computationof Quartile deviationfrom the unclassified scores scores f F 9 2 35 7 3 33 6 7 30 Q3 5 9 23 4 6 14 Q1 3 5 8 2 3 3 N=35 35+1 36 Q1 = -------------- = --------- = 9th score = 4 4 4 3( 35+1) 108 Q3 = -------------- = --------- = 27th score = 6 4 4 6-4 2 Q= -------= ------ = 1 2 2
  • 10.
    Measures of Variability: Computationof Quartile deviation from Frequency distribution ( classified scores/data) e.g.1 Quartile Deviation=? CI f ( frequency) 55-59 4 50-54 7 45-49 7 40-44 10 35-39 8 30-34 4
  • 11.
    Computation of Quartiledeviationfrom classifiedscores: e.g.1 C.I f F( cumulative frequency) 55-59 4 40 (L3=49.5) 50-54 7 (f3) 36 45-49 7 29 (F3) 40-44 10 22 (L1= 34.5) 35-39 8 (f1) 12 30-34 4 4 (F1) N= 40 N/4-F1 Q1 = L1+ ---------- x i f1 3N/4-F3 Q3 = L3+ ---------- x i f3 N= 40 N/4= 10 L1= 34.5 F1= 4 f1= 8 i=5 N=40 3N/4= 30 L3= 49.5 F3= 29 F3=7 i=5
  • 12.
    N/4-F1 10- 4 Q1= L1+ ---------- x i = 34.5 + -------- x 5 f1 8 30 = 34.5 + -------- = 34.5 + 3.75 = 38.25 8 3N/4-F1 30-29 Q3 = L3+ ------------ x i = 49.5 + -------- x 5 f3 7 5 = 49.5 + -------- = 49.5 + 0.714 = 50.214 7 Q3 – Q1 50.214 - 38.25 Q = ------------------ = ------------------------- = 5.982 2 2
  • 13.
    Computation of Quartiledeviation from Frequency distribution ( classified scores/data) e.g.2 (May 2018) Quartile Deviation=? CI f ( frequency) 37-39 1 34-36 3 31-33 4 28-30 3 15-27 8 22-24 5 19-21 9 16-18 7 13-15 5 10-12 9
  • 14.
  • 15.
    Measures of Variability:SD Standard Deviation: The word Standard deviation was Coined by Karl Pearson. It is denoted by σ (sigma) or SD. SD is the most reliable and stable measures of variability.
  • 16.
    Computation of SDfrom ungrouped scores Eg.1 Series(A) 4,8,12,16,20 X (scores) d= X-M d2 4 (4-12) = -8 64 8 (8-12) = -4 16 12 0 0 16 +4 16 20 +8 64 ∑X = 60 ∑d2= 160 ∑X 60 M= ------ = ------ = 12 N 5 ∑d2 160 SD = ------- = --------- = 32 = 5.657 √ N √ 60 √ SD= 5.657
  • 17.
    Computation of SDfrom ungrouped scores Eg.2 X f fX d= X-M fd fd2 25 2 50 (25-15)=10 20 200 20 3 60 5 15 75 15 10 150 0 0 0 10 3 30 -5 -15 75 5 2 10 -10 -20 200 N=20 ∑fX = 300 ∑fd2= 550 ∑fX 300 M= ------ = ------ = 15 N 20 ∑fd2 550 SD = ------- = --------- = 27.5 = 5.244 √ N √ 20 √ SD= 5.244
  • 18.
    Computationof SD fromgrouped scores ( short method) Eg.2 CI f d fd fd2 35-39 5 +3 +15 45 30-34 6 +2 +12 +35 24 25-29 8 +1 +8 8 20-24 10 0 0 0 15-19 5 -1 -5 5 10-14 4 -2 -8 -19 16 5-9 2 -3 -6 18 N=40 ∑fd= 16 ∑fd2= 116
  • 20.
    Computationof SD fromgrouped scores ( short method) Eg.2 May 2019 CI f d fd fd2 60-69 5 50-59 7 40-49 8 30-39 9 20-29 5 10-19 4 0-09 2 N= ∑fd= ∑fd2=
  • 21.