The document outlines measures of variation and dispersion in statistics, focusing on calculating the range, quartile deviation, and their interpretations for both ungrouped and grouped data. It provides detailed examples and steps for analyzing the scores of students in a quiz, including finding quartiles and interpreting interquartile ranges. Additionally, it includes an assignment task related to calculating and interpreting these measures based on a frequency distribution of student scores.


![ASSIGNMENT:
• Consider the frequency distribution of scores of the
students in Mathematics. Find a) Q1 ; b) Q3 ; c) IQR with
interpretation ; d) QD with interpretation [20 points]
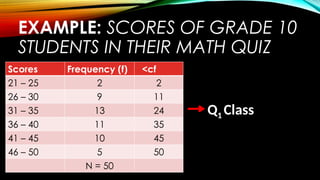
Class Interval Frequency (f) <cf
88 – 96 9 65
80 – 87 10 56
72 – 79 15 46
64 - 71 13 31
56 - 63 9 18
48 - 55 9 9
N = 65](https://image.slidesharecdn.com/tcts29m9snqpgdaw1udt-measures-of-variation-240829005540-1d287d85/85/Prof-Ed-course-MEASURES_OF_VARIATION-pptx-57-320.jpg)