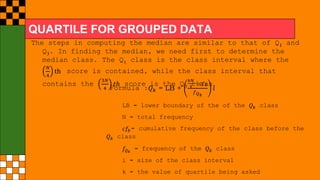
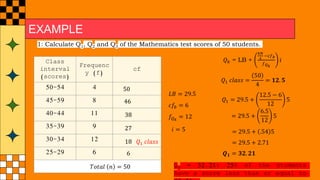
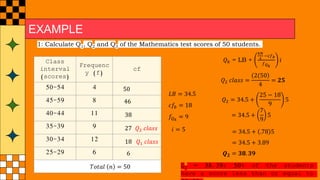
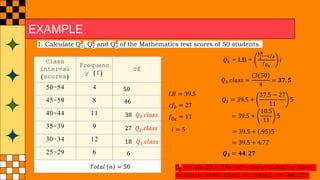
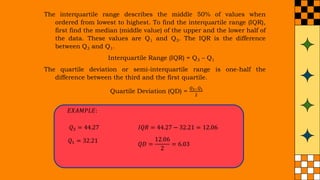
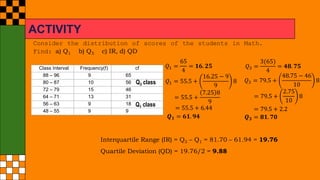
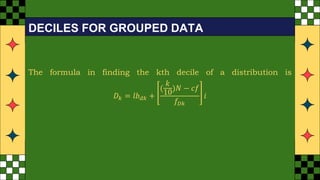
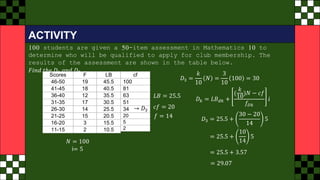
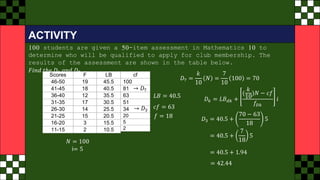
Q4-WEEK 5 & 6
WELCOME
MATHEMATICS
CLASS
FOR GRADE 10
10th grade
RECALL
It is a method that is used
to divide a distribution into
ten equal parts.
is a quantile that divides a
set of scores into 100 equal
parts.
the proportion of scores in a
distribution that a specific
score is greater than or
equal to.
DECILE
QUARTILE
PERCENTILE PERCENTILE RANK
Quartiles are the values
which divide the whole
distribution into four
equal parts.
QUARTILE FOR GROUPED DATA
The steps in computing the median are similar to that of Q1 and
Q3. In finding the median, we need first to determine the
median class. The Q1 class is the class interval where the
𝑁
4
th score is contained, while the class interval that
contains the
3𝑁
4
𝑡ℎ score is the Q3 class.
Formula :𝑄𝑘 = LB +
𝑘𝑁
4
−𝑐𝑓𝑏
𝑓𝑄𝑘
𝑖
LB = lower boundary of the of the 𝑄𝑘 class
N = total frequency
𝑐𝑓𝑏 = cumulative frequency of the class before the
𝑄𝑘 class
𝑓𝑄𝑘
= frequency of the 𝑄𝑘 class
i = size of the class interval
k = the value of quartile being asked
EXAMPLE
1: Calculate Q1, Q2 and Q3 of the Mathematics test scores of 50 students.
Class
interval
(scores)
Frequenc
y (f)
50-54 4
45-59 8
40-44 11
35-39 9
30-34 12
25-29 6
cf
6
18
27
38
46
50
𝑇𝑜𝑡𝑎𝑙 𝑛 = 50
𝑄𝑘 = LB +
𝑘𝑁
4
−𝑐𝑓𝑏
𝑓𝑄𝑘
𝑖
𝑄1 𝑐𝑙𝑎𝑠𝑠 =
50
4
= 𝟏𝟐. 𝟓
𝑄1 𝑐𝑙𝑎𝑠𝑠
𝐿𝐵 = 29.5
𝑐𝑓𝑏 = 6
𝑓𝑄𝑘
= 12
𝑖 = 5
𝑄1 = 29.5 +
12.5 − 6
12
5
= 29.5 +
6.5
12
5
= 29.5 + .54 5
= 29.5 + 2.71
𝑸𝟏 = 𝟑𝟐. 𝟐𝟏
Q1 = 32.21: 25% of the students
have a score less than or equal to
EXAMPLE
1: Calculate Q1, Q2 and Q3 of the Mathematics test scores of 50 students.
Class
interval
(scores)
Frequenc
y (f)
50-54 4
45-59 8
40-44 11
35-39 9
30-34 12
25-29 6
cf
6
18
27
38
46
50
𝑇𝑜𝑡𝑎𝑙 𝑛 = 50
𝑄𝑘 = LB +
𝑘𝑁
4
−𝑐𝑓𝑏
𝑓𝑄𝑘
𝑖
𝑄2 𝑐𝑙𝑎𝑠𝑠 =
2(50
4
= 𝟐𝟓
𝑄1 𝑐𝑙𝑎𝑠𝑠
𝐿𝐵 = 34.5
𝑐𝑓𝑏 = 18
𝑓𝑄𝑘
= 9
𝑖 = 5
𝑄2 = 34.5 +
25 − 18
9
5
= 34.5 +
7
9
5
= 34.5 + .78 5
= 34.5 + 3.89
𝑸𝟐 = 𝟑𝟖. 𝟑𝟗
𝑄2 𝑐𝑙𝑎𝑠𝑠
Q2 = 38.39: 50% of the students
have a score less than or equal to
EXAMPLE
1: Calculate Q1, Q2 and Q3 of the Mathematics test scores of 50 students.
Class
interval
(scores)
Frequenc
y (f)
50-54 4
45-59 8
40-44 11
35-39 9
30-34 12
25-29 6
cf
6
18
27
38
46
50
𝑇𝑜𝑡𝑎𝑙 𝑛 = 50
𝑄𝑘 = LB +
𝑘𝑁
4
−𝑐𝑓𝑏
𝑓𝑄𝑘
𝑖
𝑄3 𝑐𝑙𝑎𝑠𝑠 =
3(50
4
= 𝟑𝟕. 𝟓
𝑄1 𝑐𝑙𝑎𝑠𝑠
𝐿𝐵 = 39.5
𝑐𝑓𝑏 = 27
𝑓𝑄𝑘
= 11
𝑖 = 5
𝑄3 = 39.5 +
37.5 − 27
11
5
= 39.5 +
10.5
11
5
= 39.5 + .95 5
= 39.5 + 4.77
𝑸𝟑 = 𝟒𝟒. 𝟐𝟕
𝑄2 𝑐𝑙𝑎𝑠𝑠
𝑄3 𝑐𝑙𝑎𝑠𝑠
Q3 = 44.27: 75% of the students have
a score less than or equal to 44.27
The interquartile range describes the middle 50% of values when
ordered from lowest to highest. To find the interquartile range (IQR),
first find the median (middle value) of the upper and the lower half of
the data. These values are Q1 and Q3. The IQR is the difference
between Q3 and Q1.
Interquartile Range (IQR) = Q3 – Q1
The quartile deviation or semi-interquartile range is one-half the
difference between the third and the first quartile.
Quartile Deviation (QD) =
𝑄3−𝑄1
2
𝑄3 = 44.27
𝑄1 = 32.21
𝐼𝑄𝑅 = 44.27 − 32.21 = 12.06
𝑄𝐷 =
12.06
2
= 6.03
𝐸𝑋𝐴𝑀𝑃𝐿𝐸:
ACTIVITY
Class Interval Frequency(f)
88 – 96 9
80 – 87 10
72 – 79 15
64 – 71 13
56 – 63 9
48 – 55 9
Consider the distribution of scores of the students in Math.
Find: a) Q1 b) Q3 c) IR, d) QD
cf
65
56
46
31
18
9
𝑄1 =
65
4
= 𝟏𝟔. 𝟐𝟓
Q1 class
𝑄3 =
3(65)
4
= 𝟒𝟖. 𝟕𝟓
Q3 class 𝑄1 = 55.5 +
16.25 − 9
9
8
= 55.5 +
7.25 8
9
= 55.5 + 6.44
𝑸𝟏 = 𝟔𝟏. 𝟗𝟒
𝑄3 = 79.5 +
48.75 − 46
10
8
= 79.5 +
2.75
10
8
= 79.5 + 2.2
𝑸𝟑 = 𝟖𝟏. 𝟕𝟎
Interquartile Range (IR) = Q3 – Q1 = 81.70 – 61.94 = 19.76
Quartile Deviation (QD) = 19.76/2 = 9.88
The formula in finding the kth decile of a distribution is
𝐷𝑘 = 𝑙𝑏𝑑𝑘 +
(
𝑘
10
)𝑁 − 𝑐𝑓
𝑓𝐷𝑘
𝑖
DECILES FOR GROUPED DATA
Let the table be scores of 45 students in a
long test in Math.
EXAMPLE
Solve for (a) D1 and (b) D6
Class f
30-34 5
25-29 11
20-24 13
15-19 6
10-14 10
LB cf
9.5
14.5
19.5
24.5
29.5
10
16
29
40
45
𝑁 = 45
i = 5
𝐷1 =
𝑘
10
𝑁 =
1
10
45 = 4.5
→ 𝐷1
𝐿𝐵 = 9.5
𝐷𝑘 = 𝐿𝐵𝑑𝑘 +
(
𝑘
10
)𝑁 − 𝑐𝑓
𝑓𝐷𝑘
𝑖
𝑐𝑓 = 0
𝑓 = 10
𝐷1 = 9.5 +
4.5 − 0
10
5
= 9.5 + (
4.5
10
)5
= 9.5 + 2.25
𝑫𝟏 = 𝟏𝟏. 𝟕𝟓
Let the table be scores of 45 students in a
long test in Math.
EXAMPLE
Solve for (a) D1 and (b) D6
Class f
30-34 5
25-29 11
20-24 13
15-19 6
10-14 10
LB cf
9.5
14.5
19.5
24.5
29.5
10
16
29
40
45
𝑁 = 45
i = 5
𝐷6 =
𝑘
10
𝑁 =
6
10
45 = 27
→ 𝐷1
𝐿𝐵 = 19.5
𝐷𝑘 = 𝐿𝐵𝑑𝑘 +
(
𝑘
10
)𝑁 − 𝑐𝑓
𝑓𝐷𝑘
𝑖
𝑐𝑓 = 16
𝑓 = 13
𝐷6 = 19.5 +
27 − 16
13
5
= 19.5 + (
11
13
)5
= 19.5 + 4.23
𝑫𝟑 = 𝟐𝟑. 𝟕𝟑
→ 𝐷6
ACTIVITY
100 students are given a 50-item assessment in Mathematics 10 to
determine who will be qualified to apply for club membership. The
results of the assessment are shown in the table below.
𝐹𝑖𝑛𝑑 𝑡ℎ𝑒 𝐷3 𝑎𝑛𝑑 𝐷7
Scores F
46-50 19
41-45 18
36-40 12
31-35 17
26-30 14
21-25 15
16-20 3
11-15 2
LB
45.5
40.5
35.5
30.5
25.5
20.5
15.5
10.5
cf
100
81
63
51
34
20
5
2
𝑁 = 100
i= 5
𝐷3 =
𝑘
10
𝑁 =
3
10
100 = 30
→ 𝐷3
𝐿𝐵 = 25.5
𝑐𝑓 = 20
𝑓 = 14
𝐷𝑘 = 𝐿𝐵𝑑𝑘 +
(
𝑘
10
)𝑁 − 𝑐𝑓
𝑓𝐷𝑘
𝑖
𝐷3 = 25.5 +
30 − 20
14
5
= 25.5 +
10
14
5
= 25.5 + 3.57
= 29.07
ACTIVITY
100 students are given a 50-item assessment in Mathematics 10 to
determine who will be qualified to apply for club membership. The
results of the assessment are shown in the table below.
𝐹𝑖𝑛𝑑 𝑡ℎ𝑒 𝐷3 𝑎𝑛𝑑 𝐷7
Scores F
46-50 19
41-45 18
36-40 12
31-35 17
26-30 14
21-25 15
16-20 3
11-15 2
LB
45.5
40.5
35.5
30.5
25.5
20.5
15.5
10.5
cf
100
81
63
51
34
20
5
2
𝑁 = 100
i= 5
𝐷7 =
𝑘
10
𝑁 =
7
10
100 = 70
→ 𝐷3
𝐿𝐵 = 40.5
𝑐𝑓 = 63
𝑓 = 18
𝐷𝑘 = 𝐿𝐵𝑑𝑘 +
(
𝑘
10
)𝑁 − 𝑐𝑓
𝑓𝐷𝑘
𝑖
𝐷3 = 40.5 +
70 − 63
18
5
= 40.5 +
7
18
5
= 40.5 + 1.94
= 42.44
→ 𝐷7
RECAP
QUARTILE DECILE
CREDITS: This presentation template was created
by Slidesgo, including icons by Flaticon, and
infographics & images by Freepik
ANY
QUESTIONS?
THANK YOU!

QUARTILE AND DECILE OF GROUPED DATA

  • 1.
    Q4-WEEK 5 &6 WELCOME MATHEMATICS CLASS FOR GRADE 10 10th grade
  • 2.
    RECALL It is amethod that is used to divide a distribution into ten equal parts. is a quantile that divides a set of scores into 100 equal parts. the proportion of scores in a distribution that a specific score is greater than or equal to. DECILE QUARTILE PERCENTILE PERCENTILE RANK Quartiles are the values which divide the whole distribution into four equal parts.
  • 3.
    QUARTILE FOR GROUPEDDATA The steps in computing the median are similar to that of Q1 and Q3. In finding the median, we need first to determine the median class. The Q1 class is the class interval where the 𝑁 4 th score is contained, while the class interval that contains the 3𝑁 4 𝑡ℎ score is the Q3 class. Formula :𝑄𝑘 = LB + 𝑘𝑁 4 −𝑐𝑓𝑏 𝑓𝑄𝑘 𝑖 LB = lower boundary of the of the 𝑄𝑘 class N = total frequency 𝑐𝑓𝑏 = cumulative frequency of the class before the 𝑄𝑘 class 𝑓𝑄𝑘 = frequency of the 𝑄𝑘 class i = size of the class interval k = the value of quartile being asked
  • 4.
    EXAMPLE 1: Calculate Q1,Q2 and Q3 of the Mathematics test scores of 50 students. Class interval (scores) Frequenc y (f) 50-54 4 45-59 8 40-44 11 35-39 9 30-34 12 25-29 6 cf 6 18 27 38 46 50 𝑇𝑜𝑡𝑎𝑙 𝑛 = 50 𝑄𝑘 = LB + 𝑘𝑁 4 −𝑐𝑓𝑏 𝑓𝑄𝑘 𝑖 𝑄1 𝑐𝑙𝑎𝑠𝑠 = 50 4 = 𝟏𝟐. 𝟓 𝑄1 𝑐𝑙𝑎𝑠𝑠 𝐿𝐵 = 29.5 𝑐𝑓𝑏 = 6 𝑓𝑄𝑘 = 12 𝑖 = 5 𝑄1 = 29.5 + 12.5 − 6 12 5 = 29.5 + 6.5 12 5 = 29.5 + .54 5 = 29.5 + 2.71 𝑸𝟏 = 𝟑𝟐. 𝟐𝟏 Q1 = 32.21: 25% of the students have a score less than or equal to
  • 5.
    EXAMPLE 1: Calculate Q1,Q2 and Q3 of the Mathematics test scores of 50 students. Class interval (scores) Frequenc y (f) 50-54 4 45-59 8 40-44 11 35-39 9 30-34 12 25-29 6 cf 6 18 27 38 46 50 𝑇𝑜𝑡𝑎𝑙 𝑛 = 50 𝑄𝑘 = LB + 𝑘𝑁 4 −𝑐𝑓𝑏 𝑓𝑄𝑘 𝑖 𝑄2 𝑐𝑙𝑎𝑠𝑠 = 2(50 4 = 𝟐𝟓 𝑄1 𝑐𝑙𝑎𝑠𝑠 𝐿𝐵 = 34.5 𝑐𝑓𝑏 = 18 𝑓𝑄𝑘 = 9 𝑖 = 5 𝑄2 = 34.5 + 25 − 18 9 5 = 34.5 + 7 9 5 = 34.5 + .78 5 = 34.5 + 3.89 𝑸𝟐 = 𝟑𝟖. 𝟑𝟗 𝑄2 𝑐𝑙𝑎𝑠𝑠 Q2 = 38.39: 50% of the students have a score less than or equal to
  • 6.
    EXAMPLE 1: Calculate Q1,Q2 and Q3 of the Mathematics test scores of 50 students. Class interval (scores) Frequenc y (f) 50-54 4 45-59 8 40-44 11 35-39 9 30-34 12 25-29 6 cf 6 18 27 38 46 50 𝑇𝑜𝑡𝑎𝑙 𝑛 = 50 𝑄𝑘 = LB + 𝑘𝑁 4 −𝑐𝑓𝑏 𝑓𝑄𝑘 𝑖 𝑄3 𝑐𝑙𝑎𝑠𝑠 = 3(50 4 = 𝟑𝟕. 𝟓 𝑄1 𝑐𝑙𝑎𝑠𝑠 𝐿𝐵 = 39.5 𝑐𝑓𝑏 = 27 𝑓𝑄𝑘 = 11 𝑖 = 5 𝑄3 = 39.5 + 37.5 − 27 11 5 = 39.5 + 10.5 11 5 = 39.5 + .95 5 = 39.5 + 4.77 𝑸𝟑 = 𝟒𝟒. 𝟐𝟕 𝑄2 𝑐𝑙𝑎𝑠𝑠 𝑄3 𝑐𝑙𝑎𝑠𝑠 Q3 = 44.27: 75% of the students have a score less than or equal to 44.27
  • 7.
    The interquartile rangedescribes the middle 50% of values when ordered from lowest to highest. To find the interquartile range (IQR), first find the median (middle value) of the upper and the lower half of the data. These values are Q1 and Q3. The IQR is the difference between Q3 and Q1. Interquartile Range (IQR) = Q3 – Q1 The quartile deviation or semi-interquartile range is one-half the difference between the third and the first quartile. Quartile Deviation (QD) = 𝑄3−𝑄1 2 𝑄3 = 44.27 𝑄1 = 32.21 𝐼𝑄𝑅 = 44.27 − 32.21 = 12.06 𝑄𝐷 = 12.06 2 = 6.03 𝐸𝑋𝐴𝑀𝑃𝐿𝐸:
  • 8.
    ACTIVITY Class Interval Frequency(f) 88– 96 9 80 – 87 10 72 – 79 15 64 – 71 13 56 – 63 9 48 – 55 9 Consider the distribution of scores of the students in Math. Find: a) Q1 b) Q3 c) IR, d) QD cf 65 56 46 31 18 9 𝑄1 = 65 4 = 𝟏𝟔. 𝟐𝟓 Q1 class 𝑄3 = 3(65) 4 = 𝟒𝟖. 𝟕𝟓 Q3 class 𝑄1 = 55.5 + 16.25 − 9 9 8 = 55.5 + 7.25 8 9 = 55.5 + 6.44 𝑸𝟏 = 𝟔𝟏. 𝟗𝟒 𝑄3 = 79.5 + 48.75 − 46 10 8 = 79.5 + 2.75 10 8 = 79.5 + 2.2 𝑸𝟑 = 𝟖𝟏. 𝟕𝟎 Interquartile Range (IR) = Q3 – Q1 = 81.70 – 61.94 = 19.76 Quartile Deviation (QD) = 19.76/2 = 9.88
  • 9.
    The formula infinding the kth decile of a distribution is 𝐷𝑘 = 𝑙𝑏𝑑𝑘 + ( 𝑘 10 )𝑁 − 𝑐𝑓 𝑓𝐷𝑘 𝑖 DECILES FOR GROUPED DATA
  • 10.
    Let the tablebe scores of 45 students in a long test in Math. EXAMPLE Solve for (a) D1 and (b) D6 Class f 30-34 5 25-29 11 20-24 13 15-19 6 10-14 10 LB cf 9.5 14.5 19.5 24.5 29.5 10 16 29 40 45 𝑁 = 45 i = 5 𝐷1 = 𝑘 10 𝑁 = 1 10 45 = 4.5 → 𝐷1 𝐿𝐵 = 9.5 𝐷𝑘 = 𝐿𝐵𝑑𝑘 + ( 𝑘 10 )𝑁 − 𝑐𝑓 𝑓𝐷𝑘 𝑖 𝑐𝑓 = 0 𝑓 = 10 𝐷1 = 9.5 + 4.5 − 0 10 5 = 9.5 + ( 4.5 10 )5 = 9.5 + 2.25 𝑫𝟏 = 𝟏𝟏. 𝟕𝟓
  • 11.
    Let the tablebe scores of 45 students in a long test in Math. EXAMPLE Solve for (a) D1 and (b) D6 Class f 30-34 5 25-29 11 20-24 13 15-19 6 10-14 10 LB cf 9.5 14.5 19.5 24.5 29.5 10 16 29 40 45 𝑁 = 45 i = 5 𝐷6 = 𝑘 10 𝑁 = 6 10 45 = 27 → 𝐷1 𝐿𝐵 = 19.5 𝐷𝑘 = 𝐿𝐵𝑑𝑘 + ( 𝑘 10 )𝑁 − 𝑐𝑓 𝑓𝐷𝑘 𝑖 𝑐𝑓 = 16 𝑓 = 13 𝐷6 = 19.5 + 27 − 16 13 5 = 19.5 + ( 11 13 )5 = 19.5 + 4.23 𝑫𝟑 = 𝟐𝟑. 𝟕𝟑 → 𝐷6
  • 12.
    ACTIVITY 100 students aregiven a 50-item assessment in Mathematics 10 to determine who will be qualified to apply for club membership. The results of the assessment are shown in the table below. 𝐹𝑖𝑛𝑑 𝑡ℎ𝑒 𝐷3 𝑎𝑛𝑑 𝐷7 Scores F 46-50 19 41-45 18 36-40 12 31-35 17 26-30 14 21-25 15 16-20 3 11-15 2 LB 45.5 40.5 35.5 30.5 25.5 20.5 15.5 10.5 cf 100 81 63 51 34 20 5 2 𝑁 = 100 i= 5 𝐷3 = 𝑘 10 𝑁 = 3 10 100 = 30 → 𝐷3 𝐿𝐵 = 25.5 𝑐𝑓 = 20 𝑓 = 14 𝐷𝑘 = 𝐿𝐵𝑑𝑘 + ( 𝑘 10 )𝑁 − 𝑐𝑓 𝑓𝐷𝑘 𝑖 𝐷3 = 25.5 + 30 − 20 14 5 = 25.5 + 10 14 5 = 25.5 + 3.57 = 29.07
  • 13.
    ACTIVITY 100 students aregiven a 50-item assessment in Mathematics 10 to determine who will be qualified to apply for club membership. The results of the assessment are shown in the table below. 𝐹𝑖𝑛𝑑 𝑡ℎ𝑒 𝐷3 𝑎𝑛𝑑 𝐷7 Scores F 46-50 19 41-45 18 36-40 12 31-35 17 26-30 14 21-25 15 16-20 3 11-15 2 LB 45.5 40.5 35.5 30.5 25.5 20.5 15.5 10.5 cf 100 81 63 51 34 20 5 2 𝑁 = 100 i= 5 𝐷7 = 𝑘 10 𝑁 = 7 10 100 = 70 → 𝐷3 𝐿𝐵 = 40.5 𝑐𝑓 = 63 𝑓 = 18 𝐷𝑘 = 𝐿𝐵𝑑𝑘 + ( 𝑘 10 )𝑁 − 𝑐𝑓 𝑓𝐷𝑘 𝑖 𝐷3 = 40.5 + 70 − 63 18 5 = 40.5 + 7 18 5 = 40.5 + 1.94 = 42.44 → 𝐷7
  • 14.
  • 15.
    CREDITS: This presentationtemplate was created by Slidesgo, including icons by Flaticon, and infographics & images by Freepik ANY QUESTIONS?
  • 16.