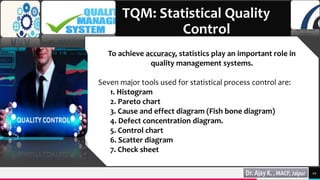
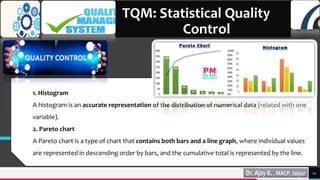
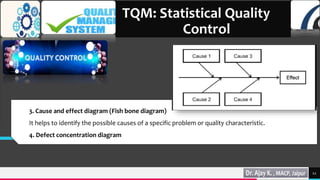
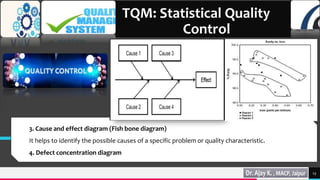
Download as PPSX, PPTX

![TREY
research
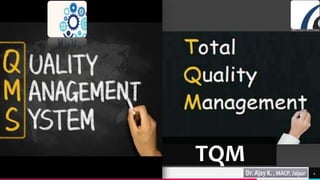
“A management approach of an organization
centered on quality,
based on participation of all its members and
aiming at long term benefits to all members of
the organization and society”.
[International Organization of Standard (ISO)]
7
TQM](https://image.slidesharecdn.com/qms-tqmqbd-210506154105/85/quality-management-systems-Total-quality-management-Quality-by-design-7-320.jpg)
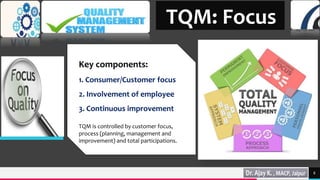
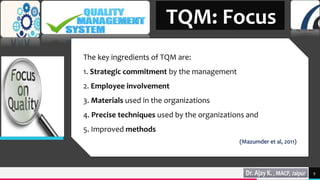
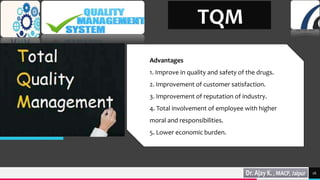

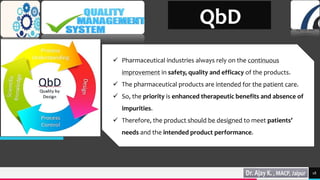
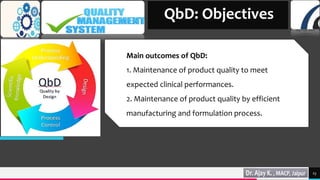
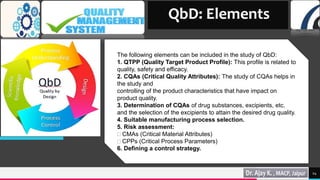
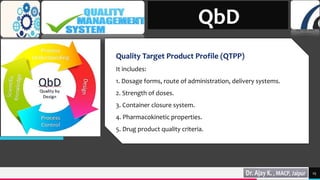
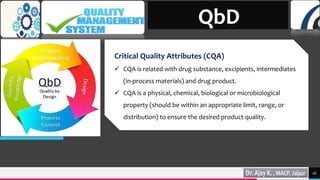
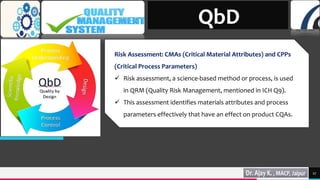
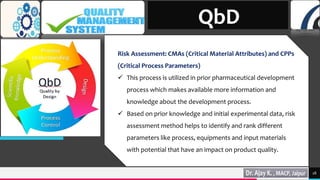
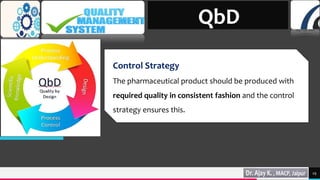
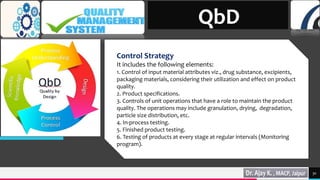
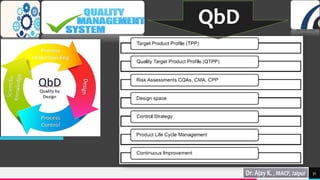


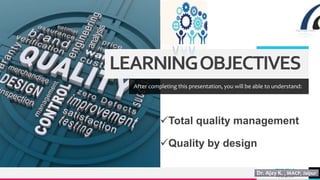
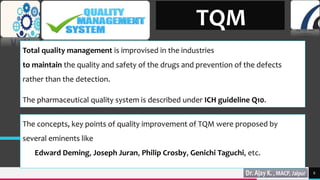
Total quality management (TQM) and quality by design (QbD) are important approaches for maintaining quality in the pharmaceutical industry. TQM focuses on continuous improvement and prevention of defects rather than detection. It involves strategic commitment, employee involvement, and precise techniques. QbD is a systematic approach that includes prior product and process understanding to design quality into the manufacturing process from the beginning. The main objectives of QbD are increasing efficiency, enhancing product quality, and avoiding regulatory issues. It involves defining quality target profiles, identifying critical quality attributes, assessing risks, and establishing control strategies.


