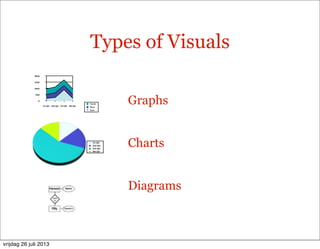
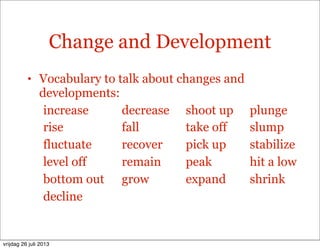
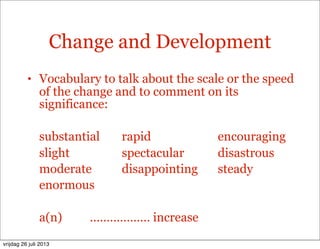
Giving Presentations
How to Use Visual Aids
vrijdag 26 juli 2013
How to Use Visual Aids
vrijdag 26 juli 2013
How to Use Visual Aids
• Introducing Visuals
• Commenting on Visuals
• Change and Development
vrijdag 26 juli 2013
Introducing Visuals
vrijdag 26 juli 2013
Introducing Visuals
• Visuals are:
• Highly memorable
• Reduce the amount of talking
• Used to speak for you
vrijdag 26 juli 2013
Types of Visuals
0
50,0
100,0
150,0
200,0
1st Qtr 2nd Qtr 3rd Qtr 4th Qtr
East
West
North
1st Qtr
2nd Qtr
3rd Qtr
4th Qtr
Graphs
Charts
Diagrams
vrijdag 26 juli 2013
Types of Visuals
0
50,0
100,0
150,0
200,0
1st Qtr 2nd Qtr 3rd Qtr 4th Qtr
East
West
North
1st Qtr
2nd Qtr
3rd Qtr
4th Qtr
Graphs
Charts
Diagrams
vrijdag 26 juli 2013
Introducing Visuals
vrijdag 26 juli 2013
Introducing Visuals
• If you don’t know the different types of visual,
simply say:
• Have/Take a look at this.
• As you can see here … and here … .
vrijdag 26 juli 2013
Commenting on Visuals
vrijdag 26 juli 2013
Commenting on Visuals
• Use visuals for situations, developments,
events and processes that would take a long
time to explain.
• Good visuals speak for themselves and
require little or no description.
vrijdag 26 juli 2013
Commenting on Visuals
vrijdag 26 juli 2013
Commenting on Visuals
• You often need to draw attention to one or
more key points before you discuss in more
detail:
• Highlights Which part of the visual
are most significant?
• Comments Why?
• Interpretations What conclusions can you
draw?
vrijdag 26 juli 2013
Commenting on Visuals
vrijdag 26 juli 2013
Commenting on Visuals
• Highlighting Important Information
• I’d like to look at …
• I’d like us to focus our attention on …
• I’d like you to think about…
• I’d like to point out …
• I’d like to draw your attention to …
vrijdag 26 juli 2013
Commenting on Visuals
vrijdag 26 juli 2013
Commenting on Visuals
• Commenting on Important Information
• As you can see, there …
• If you look at it more closely, you’ll …
• However you try to explain it, this is very
bad news.
• Whatever the reason for this, the
underlying trend is obvious.
• Whichever way you look at it, these are
some of our best results ever.
vrijdag 26 juli 2013
Commenting on Visuals
vrijdag 26 juli 2013
Commenting on Visuals
• Interpreting Important Information
• I’m sure the conclusions to be drawn from
this are …
• I’m sure the lesson to be learned from this
is …
• I’m sure the implications of this are clear to
all of us.
• I’m sure the significance of this is …
• I’m sure the message here is …
vrijdag 26 juli 2013
Change and Development
vrijdag 26 juli 2013
Change and Development
• Vocabulary to talk about changes and
developments:
increase decrease shoot up plunge
rise fall take off slump
fluctuate recover pick up stabilize
level off remain peak hit a low
bottom out grow expand shrink
decline
vrijdag 26 juli 2013
Change and Development
vrijdag 26 juli 2013
Change and Development
• Vocabulary to talk about the scale or the speed
of the change and to comment on its
significance:
substantial rapid encouraging
slight spectacular disastrous
moderate disappointing steady
enormous
a(n) ……………… increase
vrijdag 26 juli 2013
Change and Development
vrijdag 26 juli 2013
Change and Development
• Except in complex technical and scientific
presentations, you don’t quote precise figures.
• Include important figures in a separate
handout or report at the beginning or end of
the presentation.
• When describing detailed visual aids, mention
overall trends and approximate figures.
vrijdag 26 juli 2013
Questions?
vrijdag 26 juli 2013

Presentations: Visual aids

  • 1.
    Giving Presentations How toUse Visual Aids vrijdag 26 juli 2013
  • 2.
    How to UseVisual Aids vrijdag 26 juli 2013
  • 3.
    How to UseVisual Aids • Introducing Visuals • Commenting on Visuals • Change and Development vrijdag 26 juli 2013
  • 4.
  • 5.
    Introducing Visuals • Visualsare: • Highly memorable • Reduce the amount of talking • Used to speak for you vrijdag 26 juli 2013
  • 6.
    Types of Visuals 0 50,0 100,0 150,0 200,0 1stQtr 2nd Qtr 3rd Qtr 4th Qtr East West North 1st Qtr 2nd Qtr 3rd Qtr 4th Qtr Graphs Charts Diagrams vrijdag 26 juli 2013
  • 7.
    Types of Visuals 0 50,0 100,0 150,0 200,0 1stQtr 2nd Qtr 3rd Qtr 4th Qtr East West North 1st Qtr 2nd Qtr 3rd Qtr 4th Qtr Graphs Charts Diagrams vrijdag 26 juli 2013
  • 8.
  • 9.
    Introducing Visuals • Ifyou don’t know the different types of visual, simply say: • Have/Take a look at this. • As you can see here … and here … . vrijdag 26 juli 2013
  • 10.
  • 11.
    Commenting on Visuals •Use visuals for situations, developments, events and processes that would take a long time to explain. • Good visuals speak for themselves and require little or no description. vrijdag 26 juli 2013
  • 12.
  • 13.
    Commenting on Visuals •You often need to draw attention to one or more key points before you discuss in more detail: • Highlights Which part of the visual are most significant? • Comments Why? • Interpretations What conclusions can you draw? vrijdag 26 juli 2013
  • 14.
  • 15.
    Commenting on Visuals •Highlighting Important Information • I’d like to look at … • I’d like us to focus our attention on … • I’d like you to think about… • I’d like to point out … • I’d like to draw your attention to … vrijdag 26 juli 2013
  • 16.
  • 17.
    Commenting on Visuals •Commenting on Important Information • As you can see, there … • If you look at it more closely, you’ll … • However you try to explain it, this is very bad news. • Whatever the reason for this, the underlying trend is obvious. • Whichever way you look at it, these are some of our best results ever. vrijdag 26 juli 2013
  • 18.
  • 19.
    Commenting on Visuals •Interpreting Important Information • I’m sure the conclusions to be drawn from this are … • I’m sure the lesson to be learned from this is … • I’m sure the implications of this are clear to all of us. • I’m sure the significance of this is … • I’m sure the message here is … vrijdag 26 juli 2013
  • 20.
  • 21.
    Change and Development •Vocabulary to talk about changes and developments: increase decrease shoot up plunge rise fall take off slump fluctuate recover pick up stabilize level off remain peak hit a low bottom out grow expand shrink decline vrijdag 26 juli 2013
  • 22.
  • 23.
    Change and Development •Vocabulary to talk about the scale or the speed of the change and to comment on its significance: substantial rapid encouraging slight spectacular disastrous moderate disappointing steady enormous a(n) ……………… increase vrijdag 26 juli 2013
  • 24.
  • 25.
    Change and Development •Except in complex technical and scientific presentations, you don’t quote precise figures. • Include important figures in a separate handout or report at the beginning or end of the presentation. • When describing detailed visual aids, mention overall trends and approximate figures. vrijdag 26 juli 2013
  • 26.
  • 27.
  • 28.