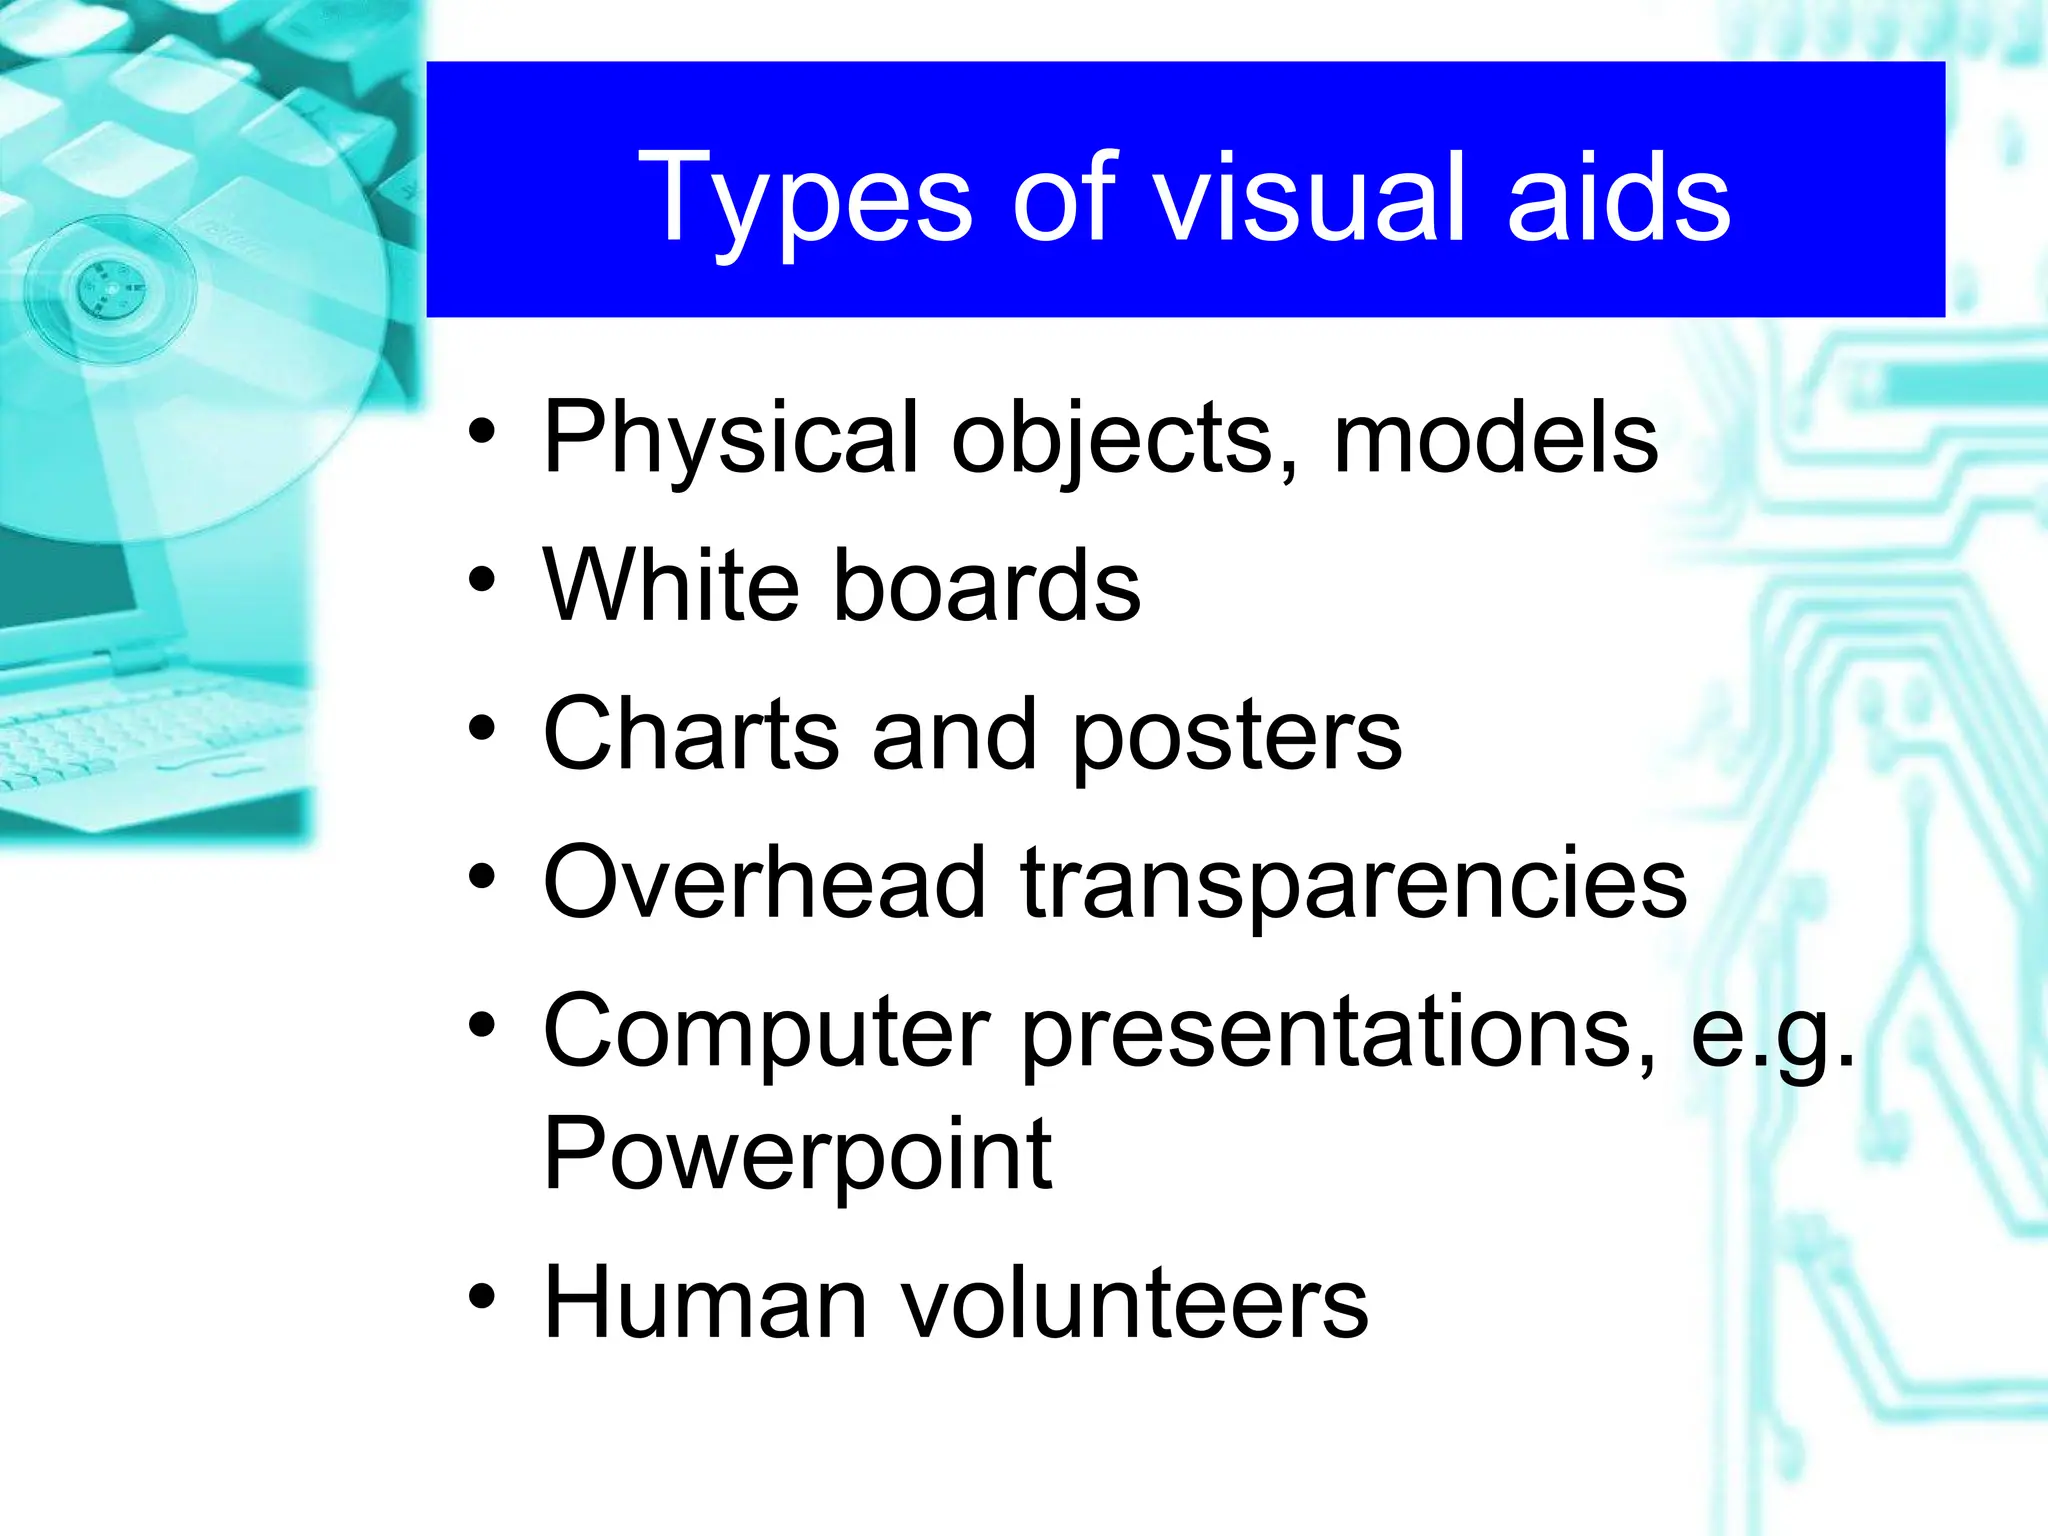
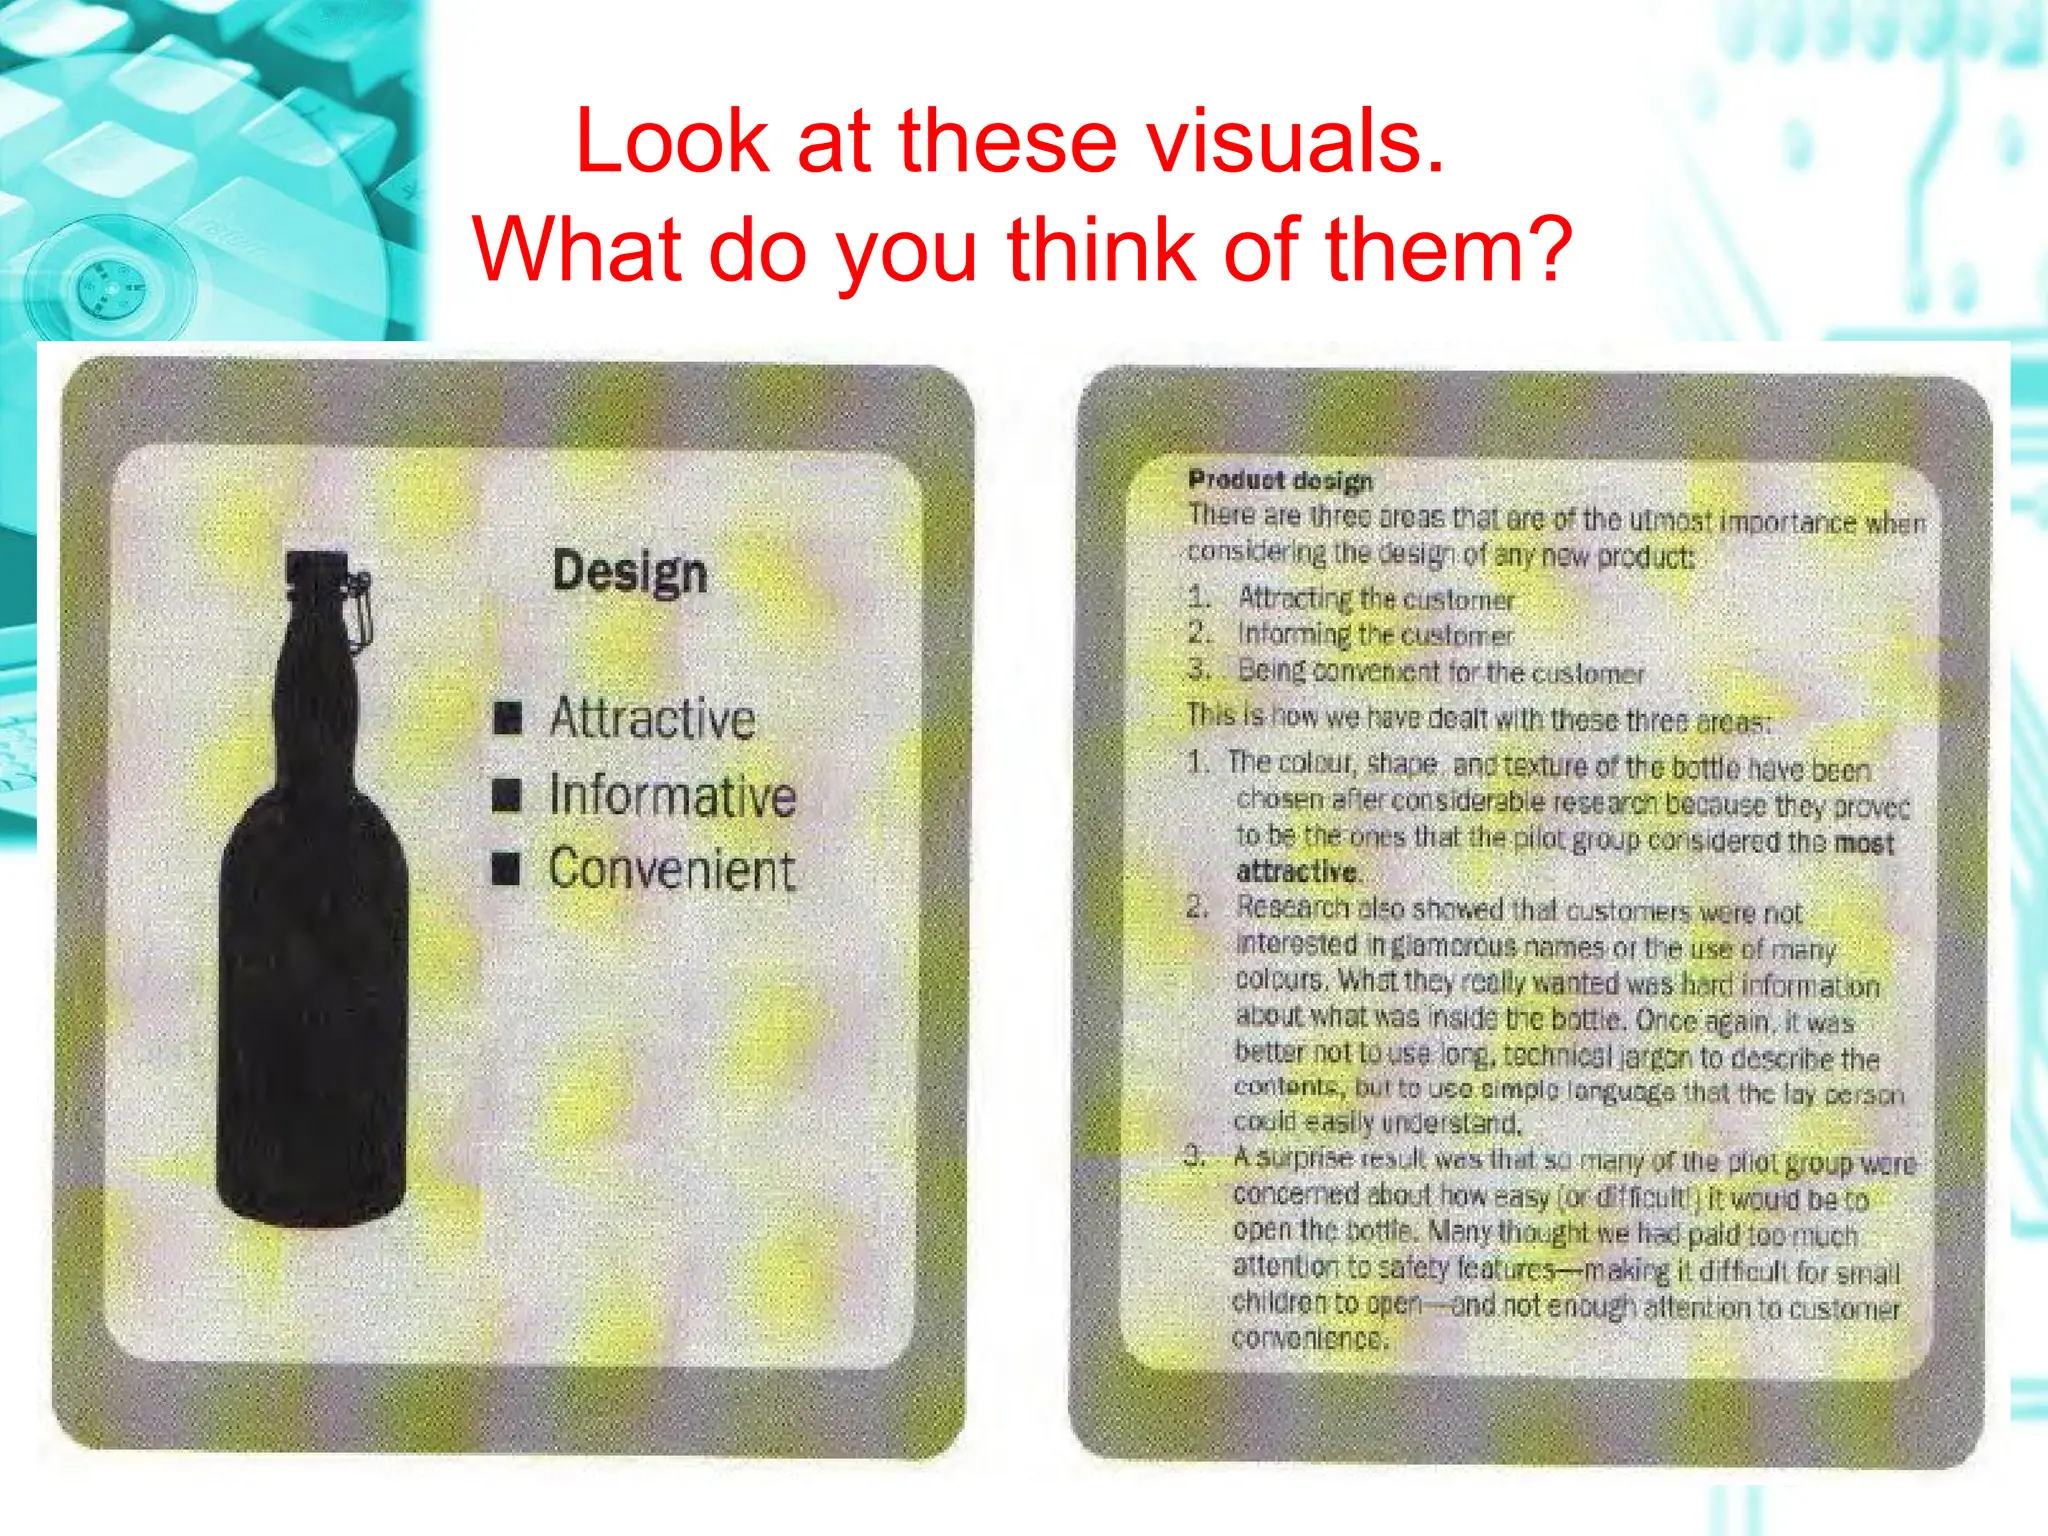
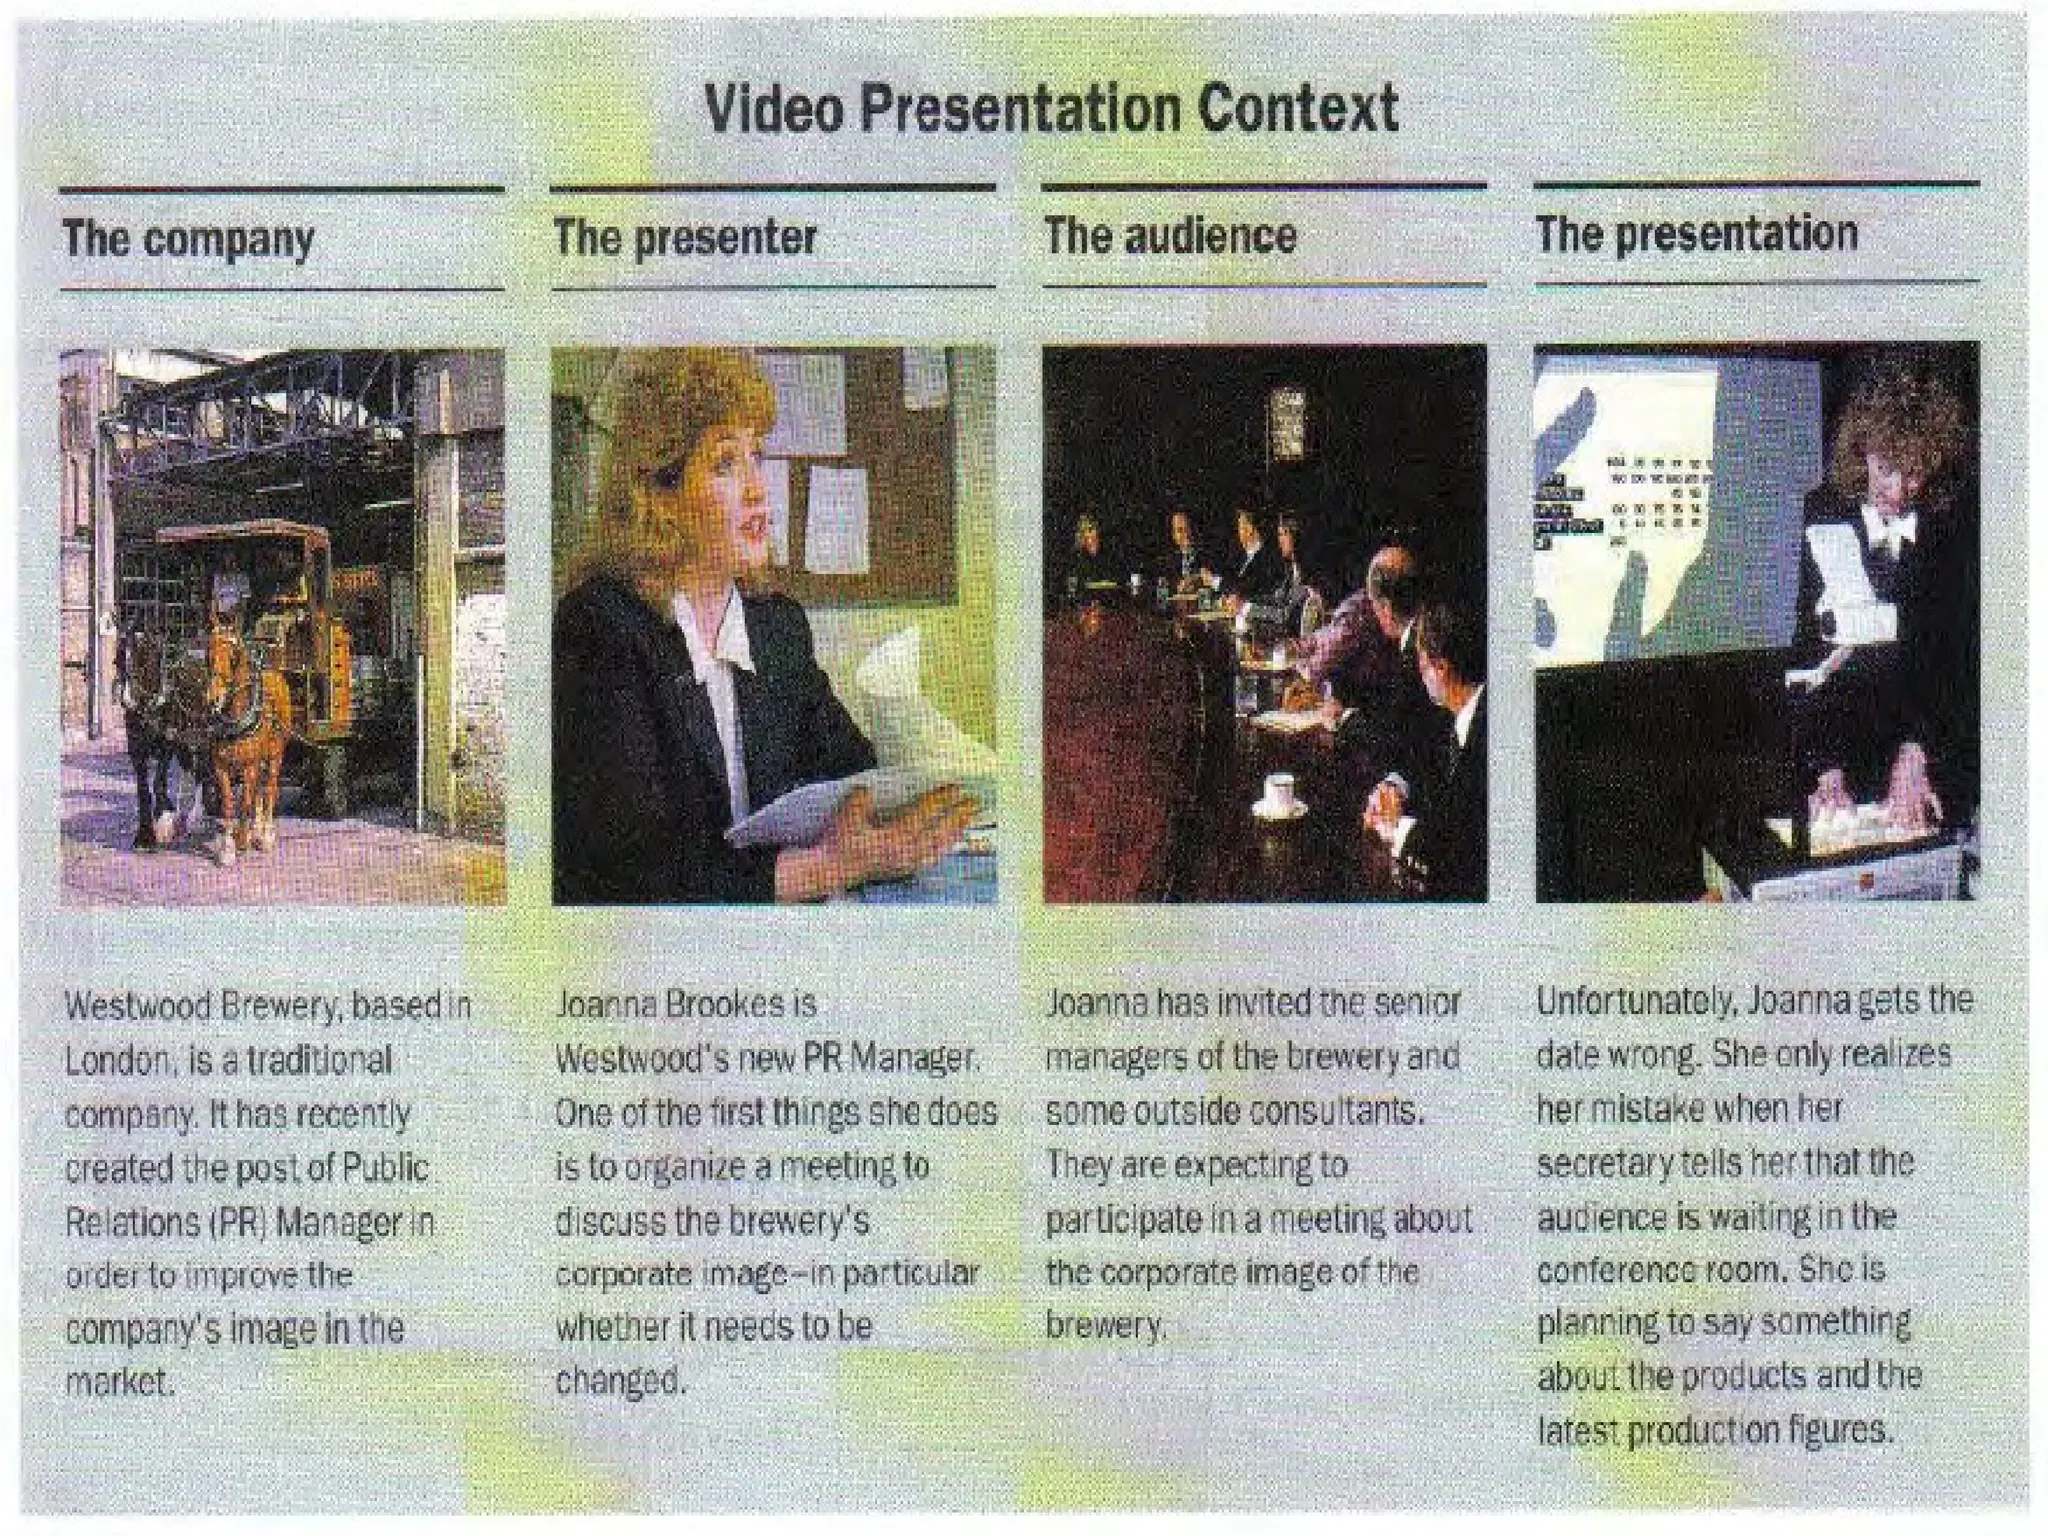
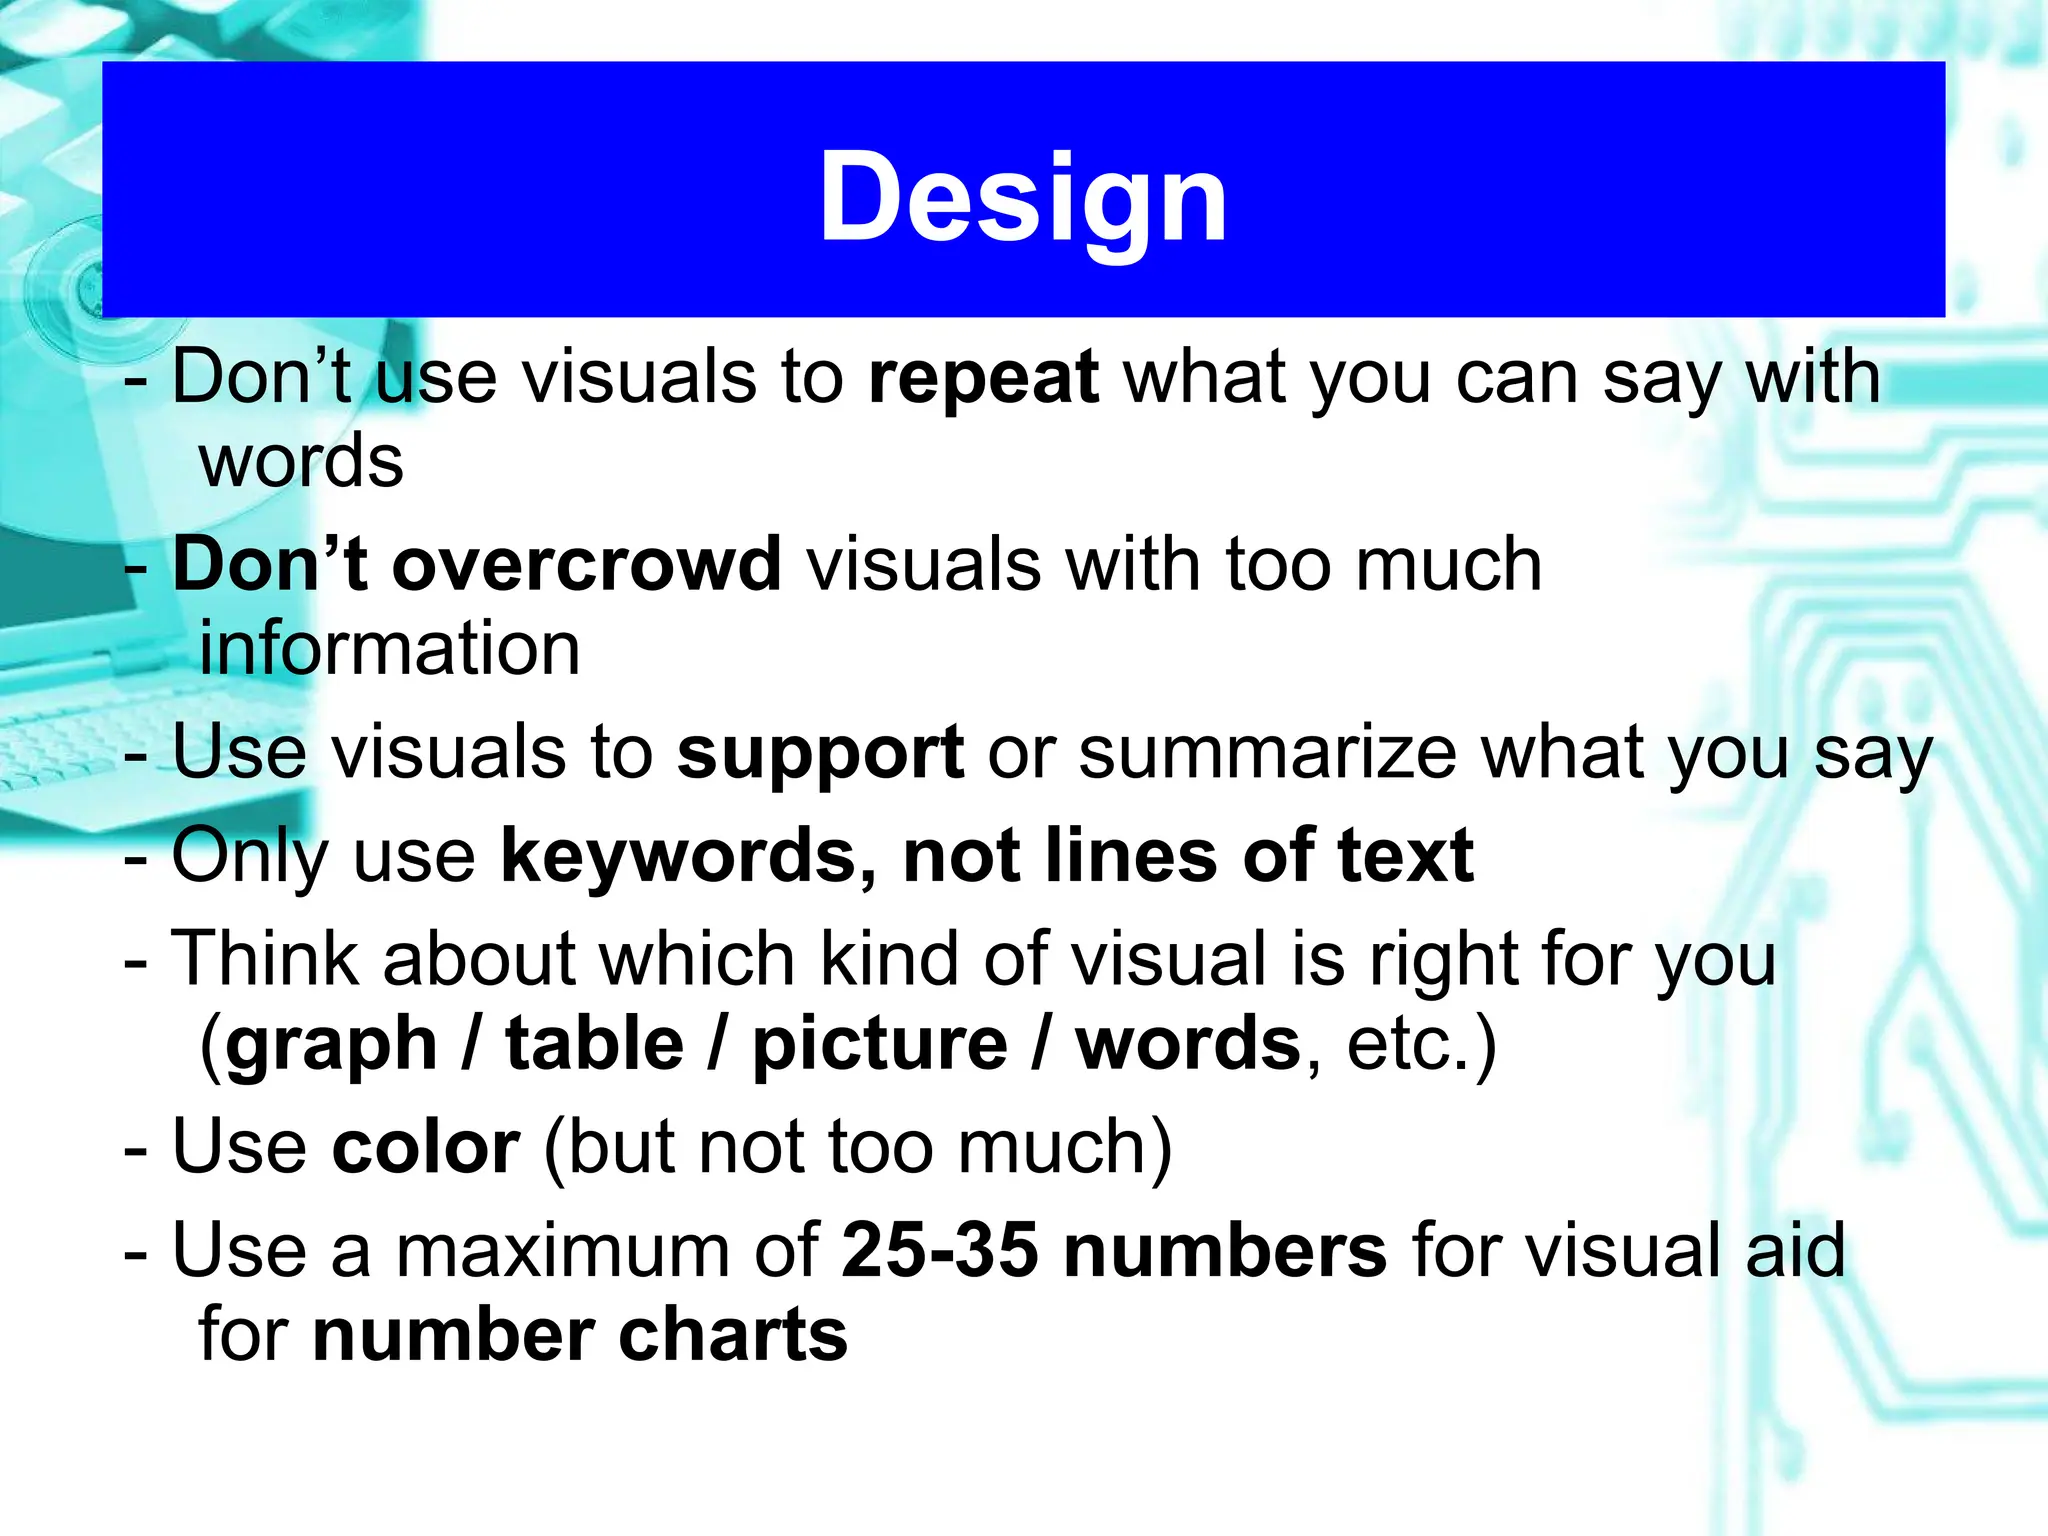
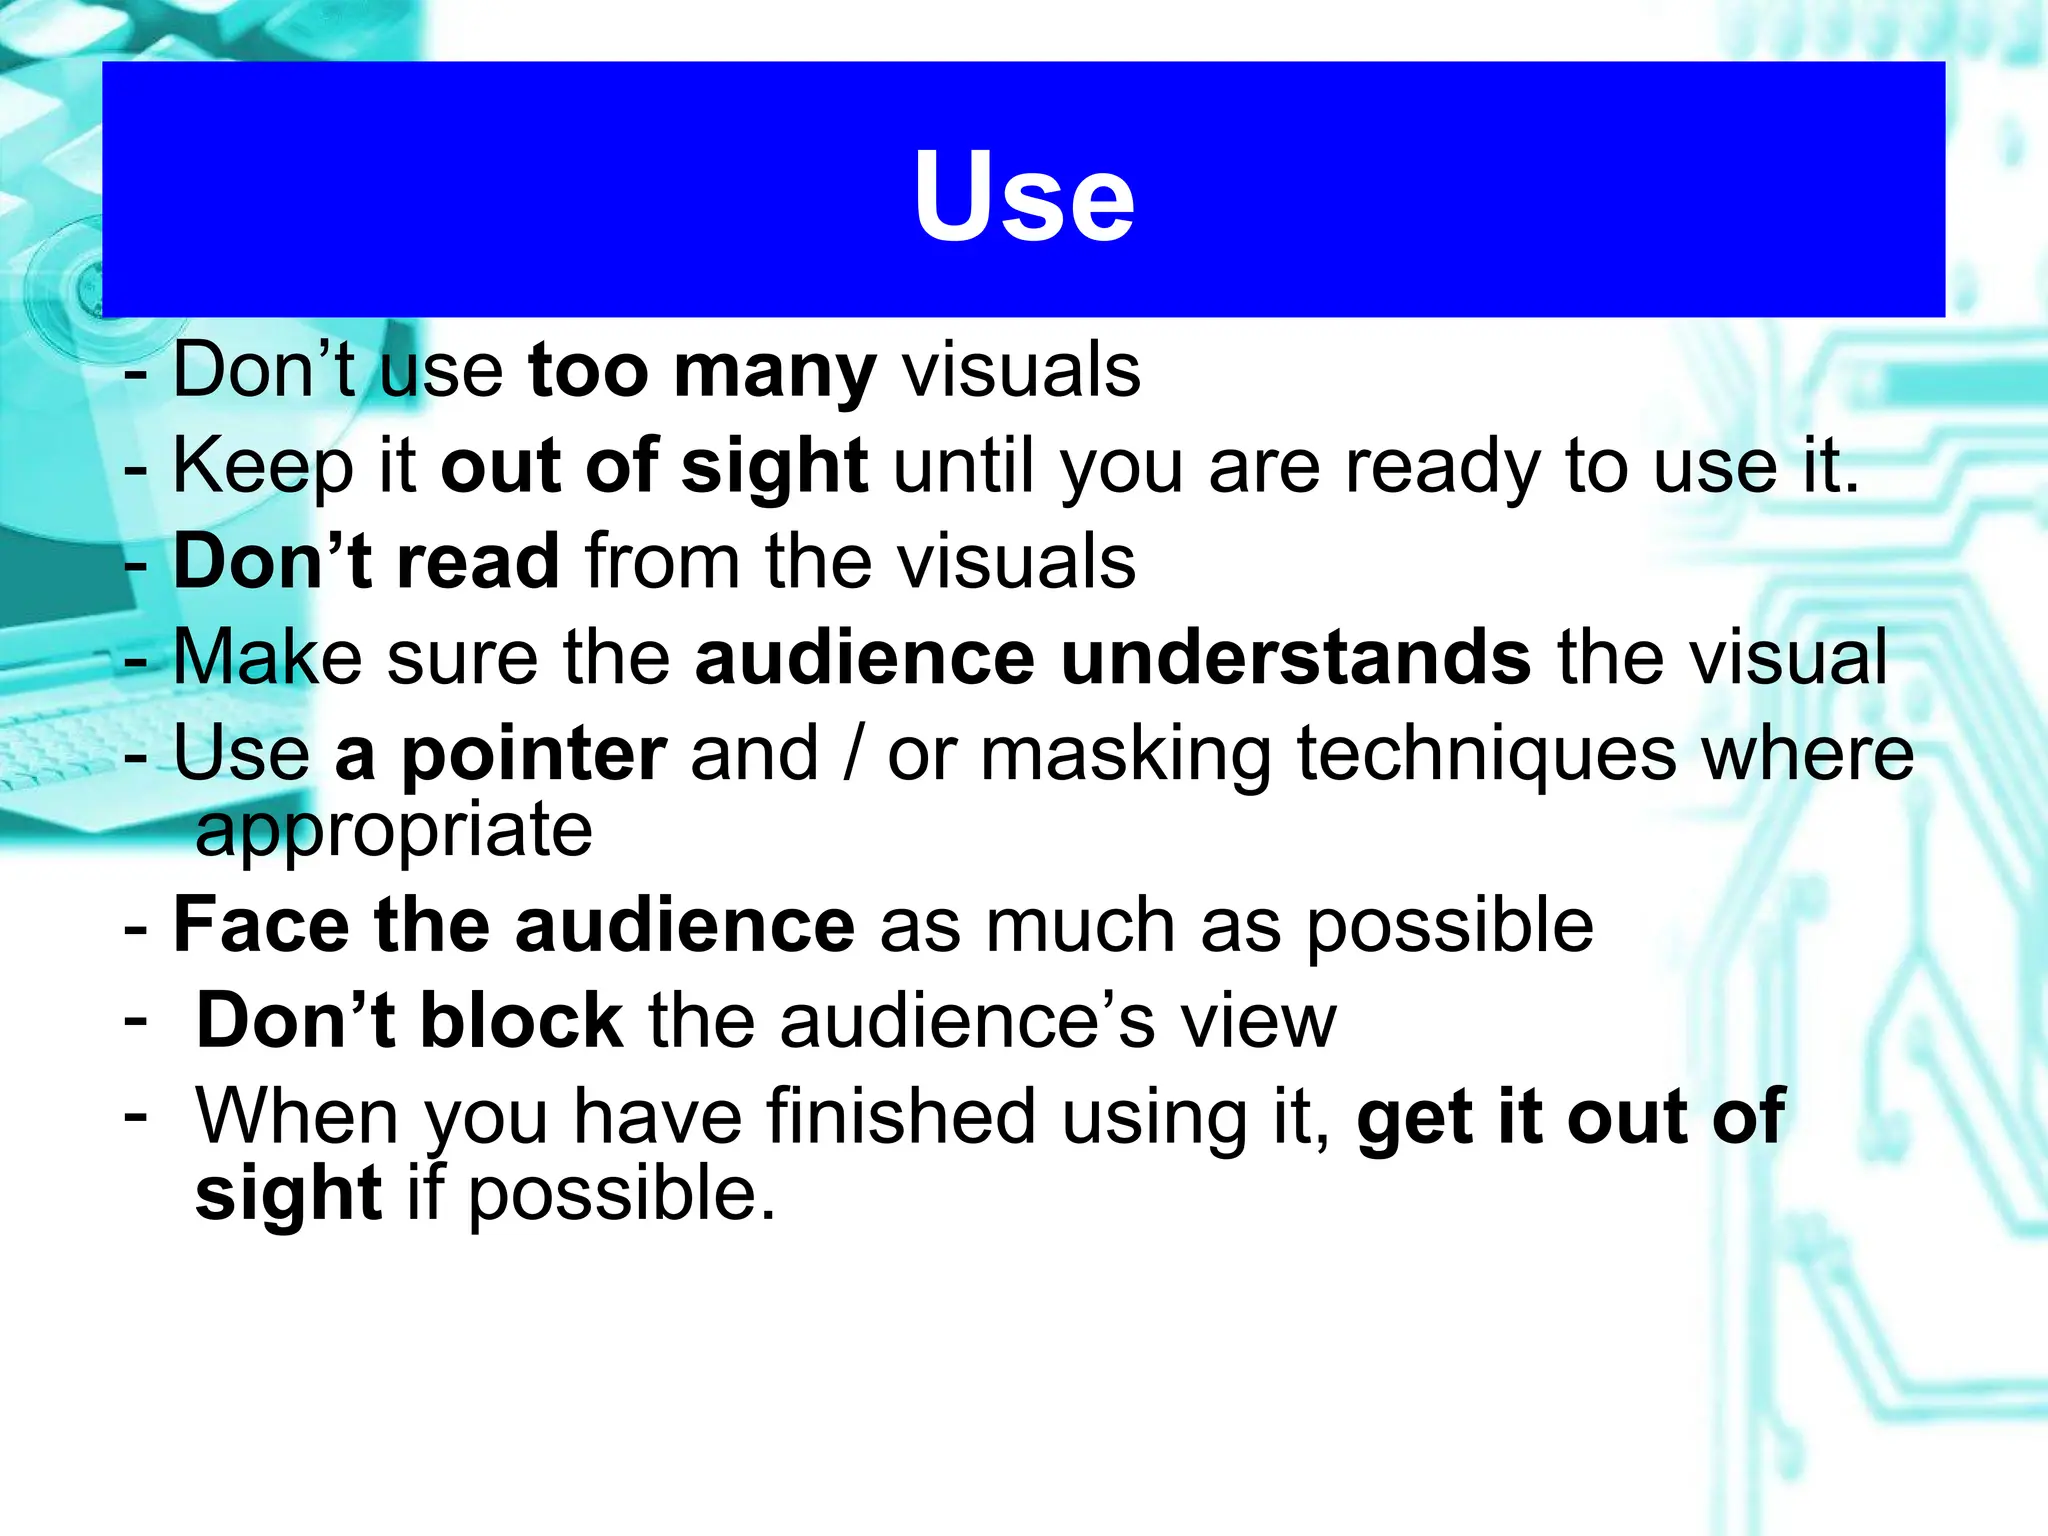
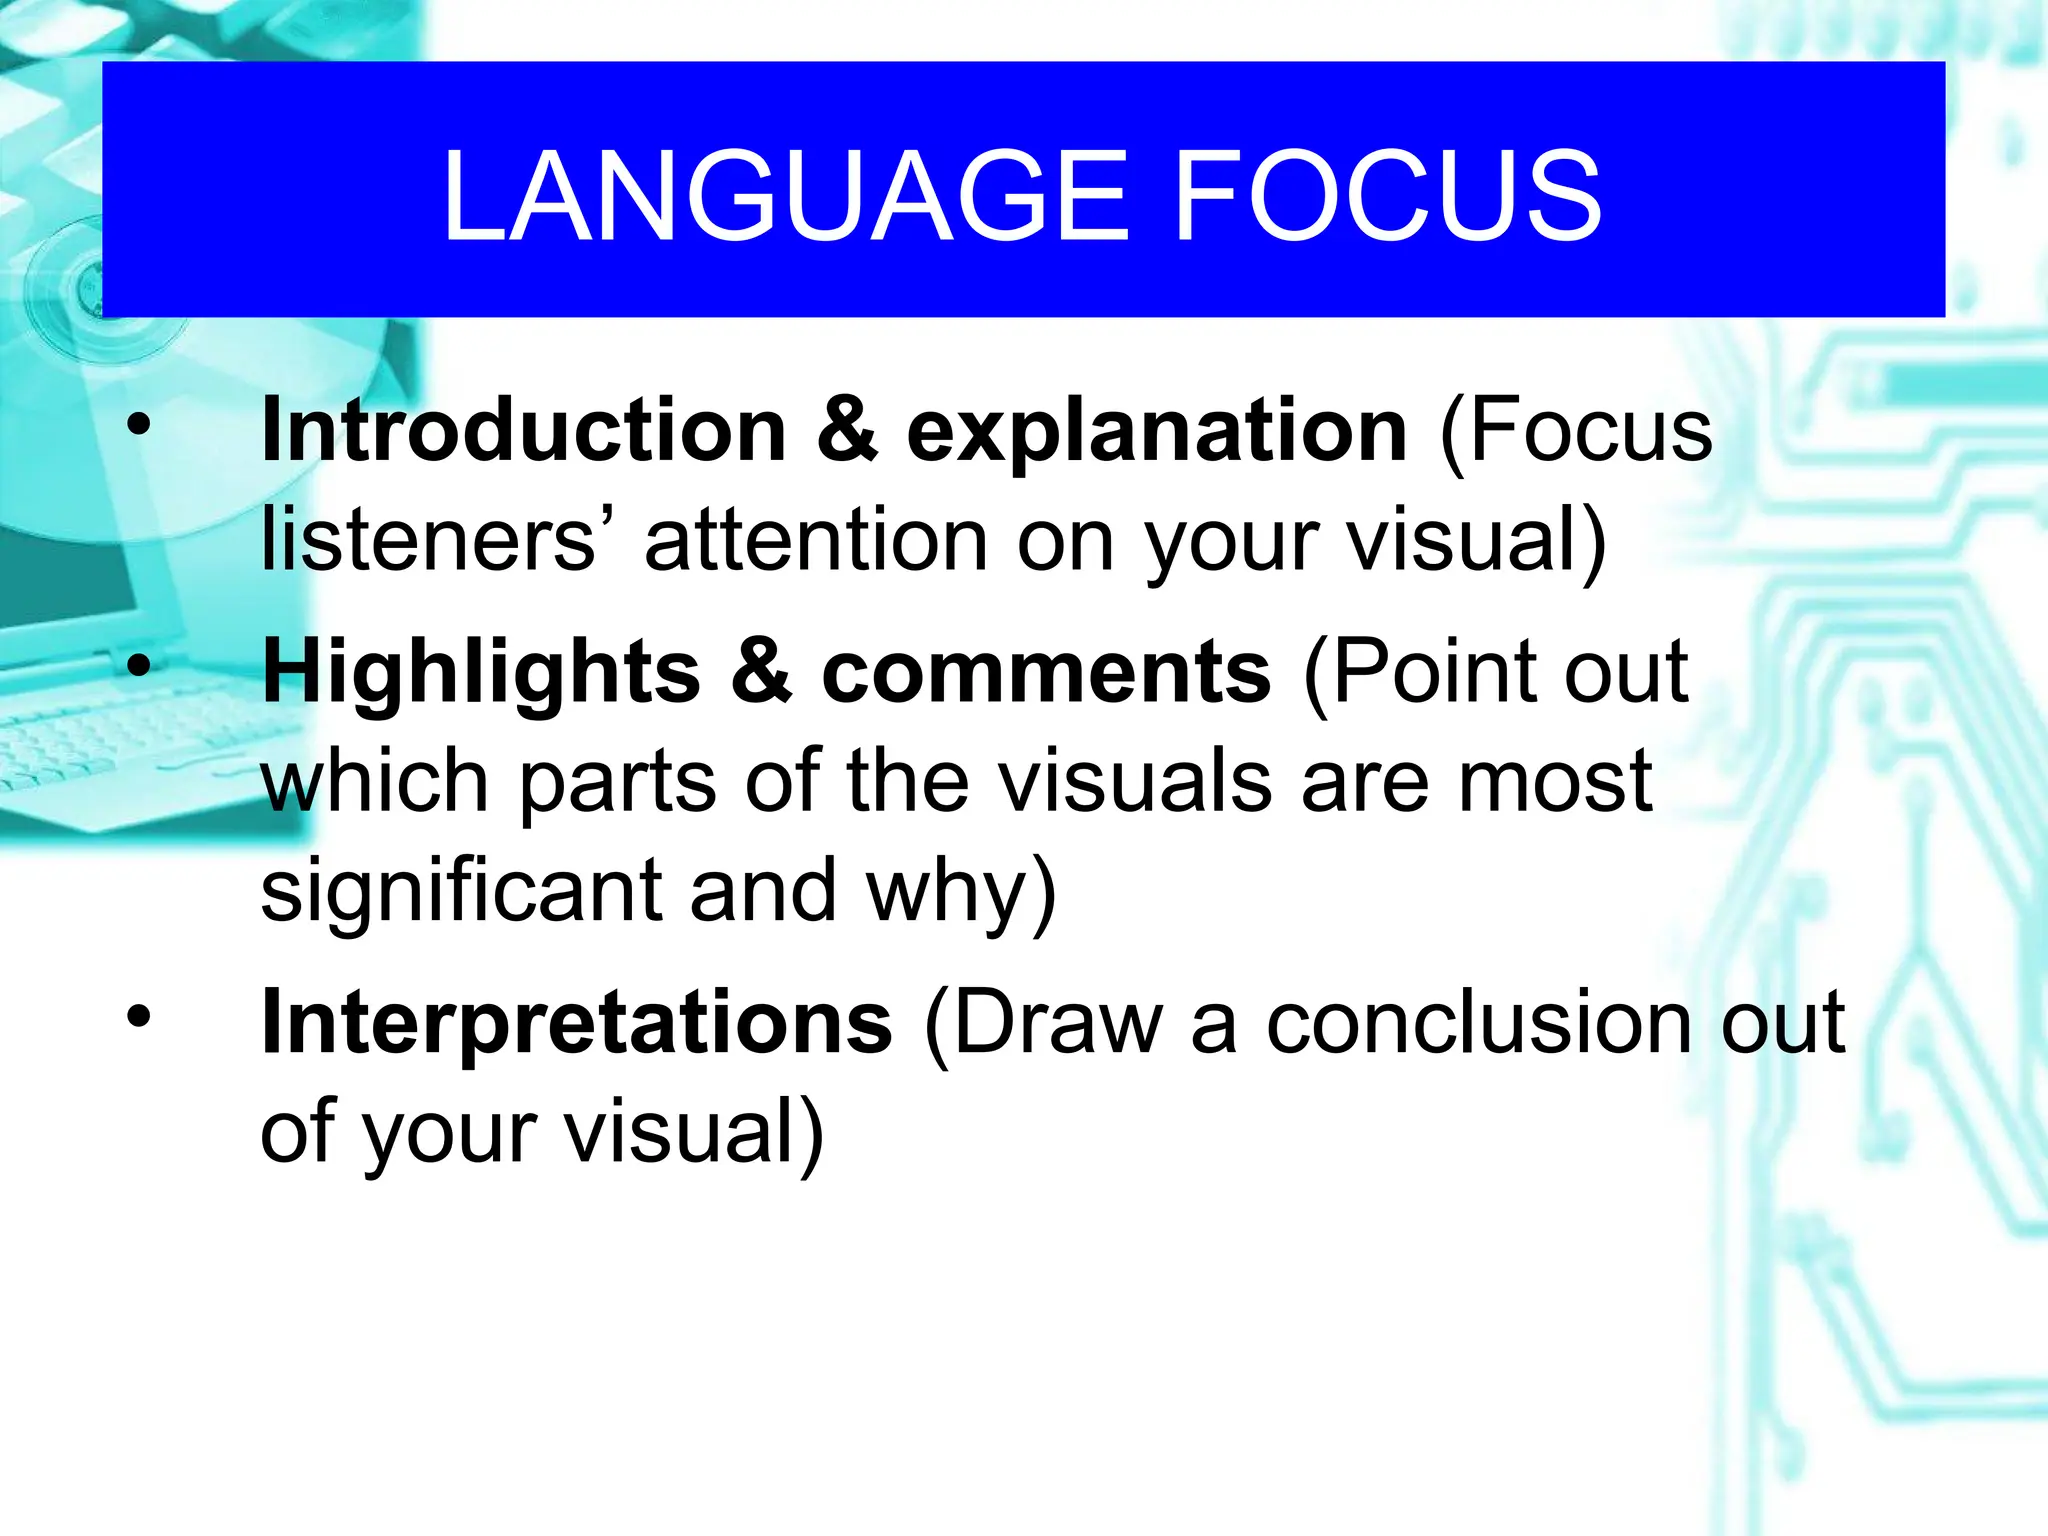
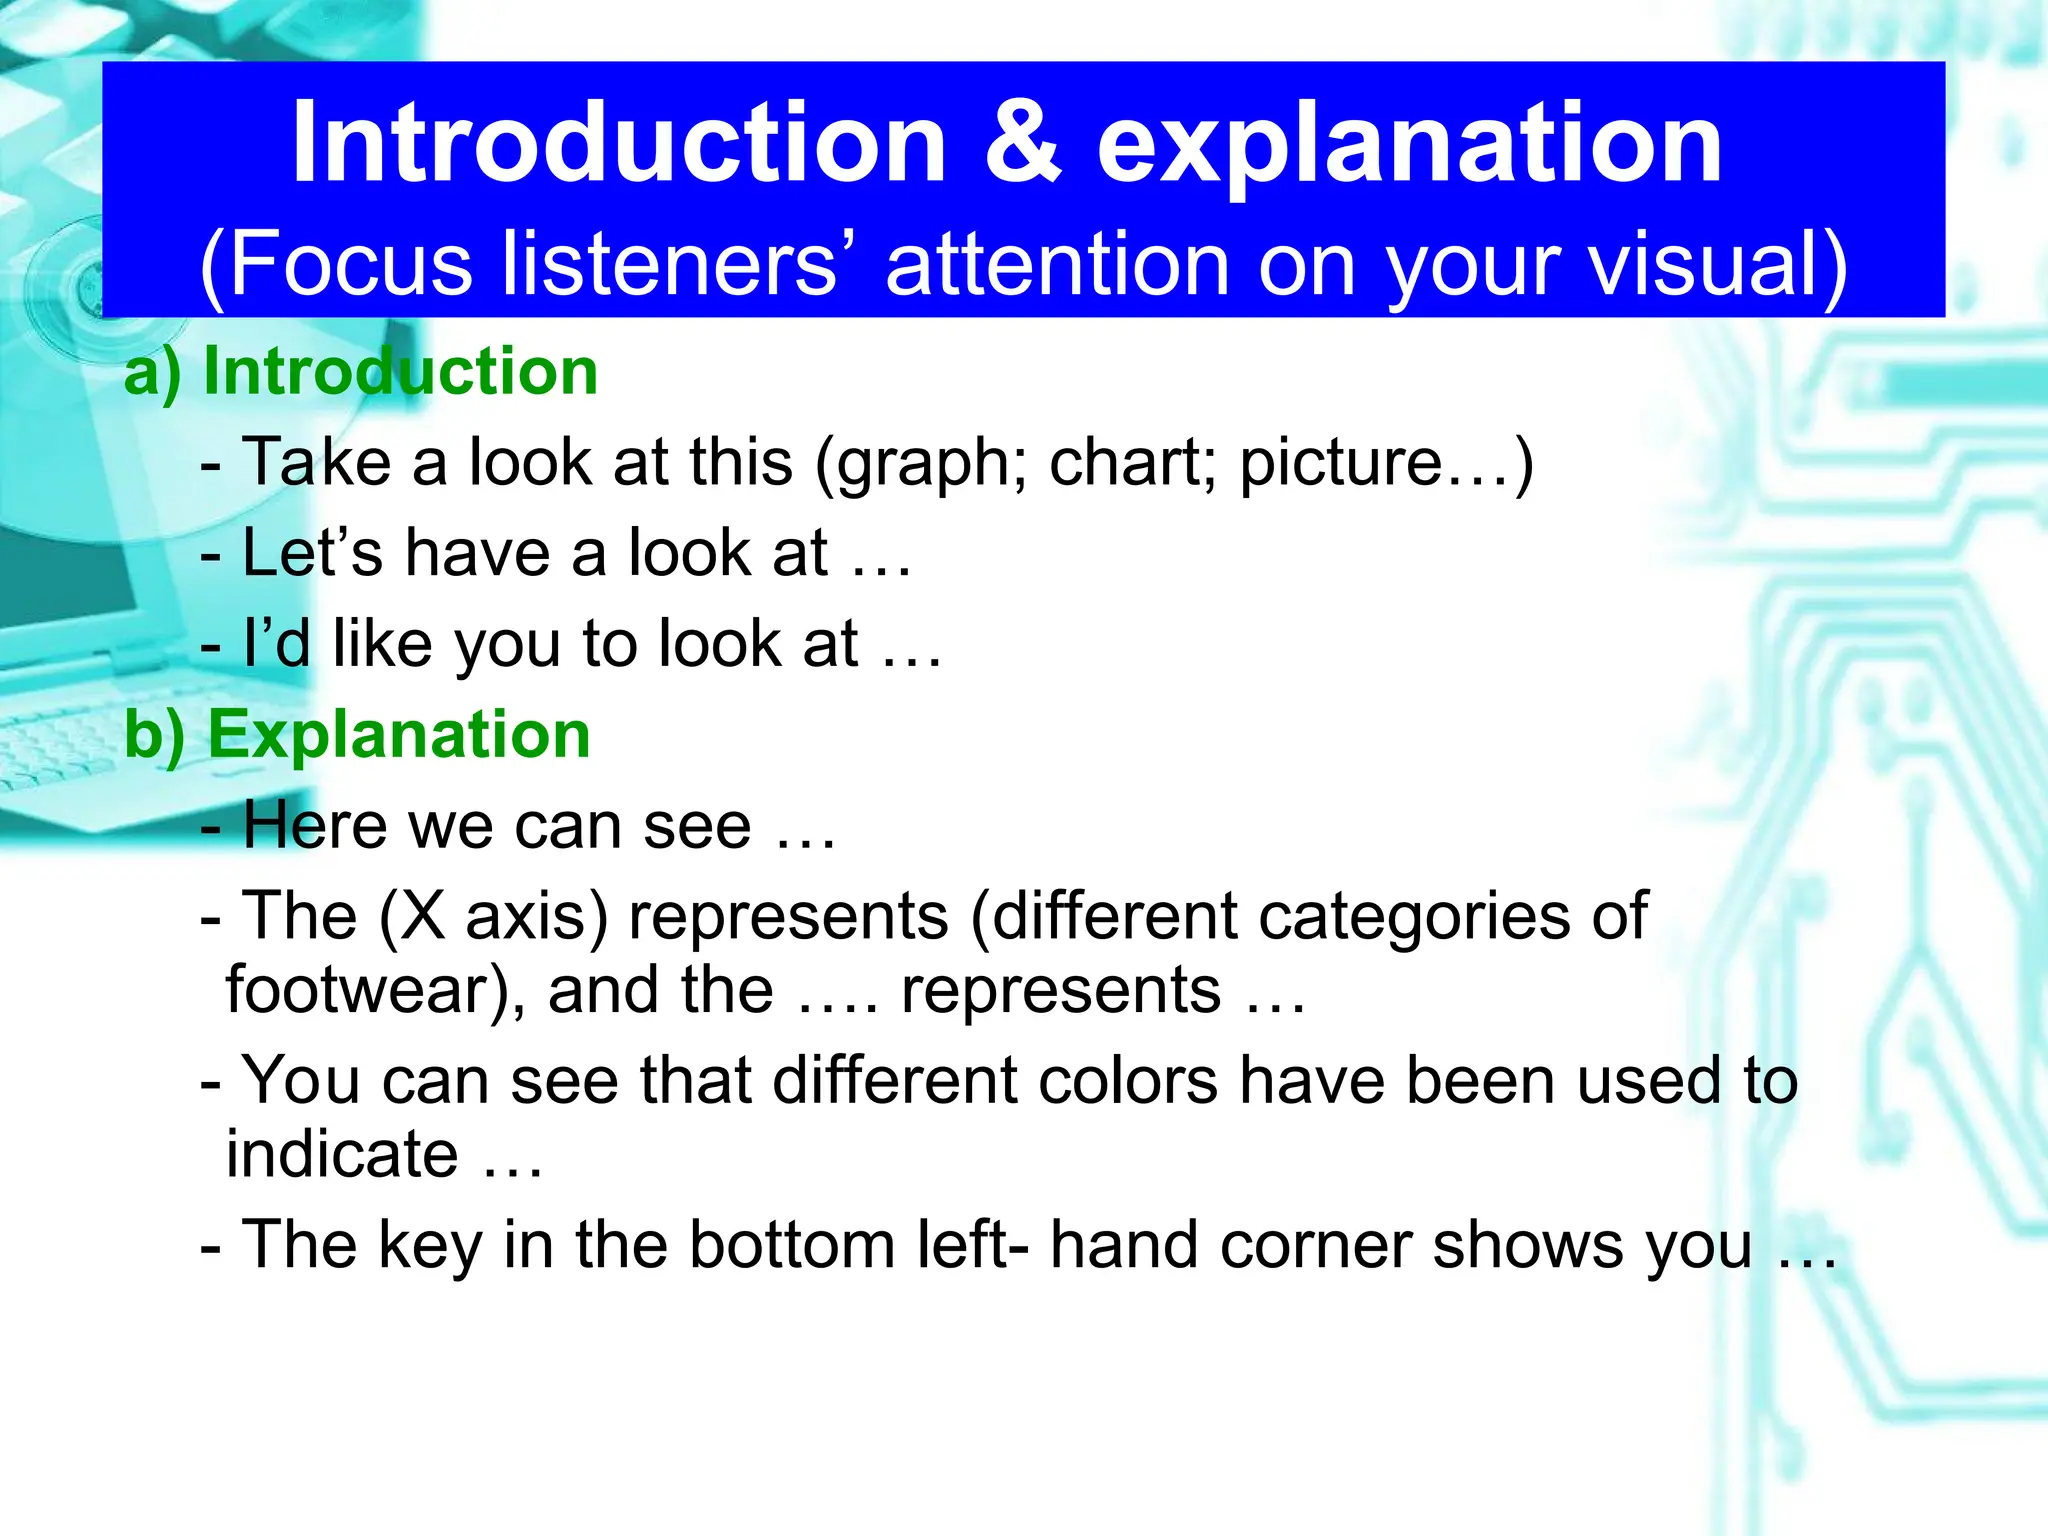
UNIT 4
UNIT 4
VISUAL AIDS
VISUAL AIDS
13/9/2010 By KP
Outline
Outline
WHY
1
Different Types
2
Tips for design and use
3
Language focus
4
Why?
• “One seeing is better than 100
times telling it”
• “A picture is worth a thousand
words”
www.writing.engr.psu.edu/handbook/visuals/08b.ppt
Advantages of using visual aids
• Make ideas clear and understandable
• Helps make the speech more
interesting
• Helps audience remember facts and
details
• Makes explaining things easier
• Helps prove a point
• …
Outline
Outline
WHY
1
Different Types
2
Tips for design and use
3
Language focus
4
Types of visual aids
• Physical objects, models
• White boards
• Charts and posters
• Overhead transparencies
• Computer presentations, e.g.
Powerpoint
• Human volunteers
Outline
Outline
WHY
1
Different Types
2
Tips for design and use
3
Language focus
4
Look at these visuals.
What do you think of them?
VIDEO VIEWING
• Textbook – page 20
- Read the Video Presentation Context.
- Watch the video (15.35 – 20.30) – version
1 & 2
- Take notes
TASK 1
Design
- Don’t use visuals to repeat what you can say with
words
- Don’t overcrowd visuals with too much
information
- Use visuals to support or summarize what you say
- Only use keywords, not lines of text
- Think about which kind of visual is right for you
(graph / table / picture / words, etc.)
- Use color (but not too much)
- Use a maximum of 25-35 numbers for visual aid
for number charts
Use
- Don’t use too many visuals
- Keep it out of sight until you are ready to use it.
- Don’t read from the visuals
- Make sure the audience understands the visual
- Use a pointer and / or masking techniques where
appropriate
- Face the audience as much as possible
- Don’t block the audience’s view
- When you have finished using it, get it out of
sight if possible.
Other notes
• Developing titles
• Placing the equipment
• Using pointers
Developing titles
• Sales Figures
 Topic title
• Sales in 2010 were up 20% over 2009
 Thematic title
• We should focus our education effort in
the rural areas.
 Assertive title
Placing the equipment
Using pointers
A. Pointers are not needed on word charts.
B. When using a pointer, keep your shoulder
oriented toward the audience. Do not cross
your arm over your body to refer to
something on the screen. Instead, hold the
pointer in the hand closest to the screen.
C. Play with the pointer when not using it.
D. When using a laser pointer, don’t try to
point with it- rather circle the part of the
graph or drawing you want the audience to
focus on.
Remember
Your visuals should HELP YOU
COMMUNICATE your message.
They should NOT DISTRACT your
audience’s attention from what you
say.
Practice: Task 5 – page 23
What Is Supply-Chain Management?
Developing long term partnerships among
channel members working together to
create a distribution system that reduces
inefficiencies, costs, and redundancies
while creating a competitive advantage
and satisfying customers.
Practice: Task 5 – page 23
Outline
Outline
WHY
1
Different Types
2
Tips for design and use
3
Language focus
4
LANGUAGE FOCUS
• Introduction & explanation (Focus
listeners’ attention on your visual)
• Highlights & comments (Point out
which parts of the visuals are most
significant and why)
• Interpretations (Draw a conclusion out
of your visual)
Introduction & explanation
(Focus listeners’ attention on your visual)
a) Introduction
- Take a look at this (graph; chart; picture…)
- Let’s have a look at …
- I’d like you to look at …
b) Explanation
- Here we can see …
- The (X axis) represents (different categories of
footwear), and the …. represents …
- You can see that different colors have been used to
indicate …
- The key in the bottom left- hand corner shows you …
Highlights & comments
(Point out which parts of the visuals are most significant
and why)
• - I’d like us to look at … in more details. As
you can see, …
• - I’d like to start by drawing your attention
to …
• - What I’d like to point out here is …
• - I think you’ll be surprised to see …
• - Let’s look more closely at …
Interpretations
(Draw a conclusion out of your visual)
conclusion to be drawn from this are
lesson to be learned from this is
I’m sure the implications of this are clear to all
of
us
significance of this is
message here is
Match the two parts to make sentences used
to talk about visuals.
1. Let’s now have a look
2. The black line gives us
3. Each line on the graph
indicates
4. In the upper right-hand
corner
5. The graph on the following
slide
6. Now I’d like you to take
7. The names of the new
models are listed
8. You can see the test results
in the
9. This aspects of the problem
is illustrated in
10. I’d like to draw your
a. shows our revenues since 2004
b. the next pie chart
c. at how the new division will be
structured
d. attention to the figures in the left-
hand corner
e. you can see the specifications for
the TP model
f. the sale figures for the VB Fox
g. table on the right
h. a look at the next slide
i. the production output of a different
product
j. across the top
1. c 2. f 3. i 4. e 5. a
6. h 7. j 8. g 9. b 10. d
REFERENCES
• Effective Presentations
• Professional Presentations
• English for Presentations
• Presenting in English
U4 - visual aids - Presentation skills_2010.ppt

U4 - visual aids - Presentation skills_2010.ppt

  • 1.
    UNIT 4 UNIT 4 VISUALAIDS VISUAL AIDS 13/9/2010 By KP
  • 2.
    Outline Outline WHY 1 Different Types 2 Tips fordesign and use 3 Language focus 4
  • 3.
    Why? • “One seeingis better than 100 times telling it” • “A picture is worth a thousand words”
  • 4.
  • 5.
    Advantages of usingvisual aids • Make ideas clear and understandable • Helps make the speech more interesting • Helps audience remember facts and details • Makes explaining things easier • Helps prove a point • …
  • 6.
    Outline Outline WHY 1 Different Types 2 Tips fordesign and use 3 Language focus 4
  • 7.
    Types of visualaids • Physical objects, models • White boards • Charts and posters • Overhead transparencies • Computer presentations, e.g. Powerpoint • Human volunteers
  • 8.
    Outline Outline WHY 1 Different Types 2 Tips fordesign and use 3 Language focus 4
  • 9.
    Look at thesevisuals. What do you think of them?
  • 10.
    VIDEO VIEWING • Textbook– page 20 - Read the Video Presentation Context. - Watch the video (15.35 – 20.30) – version 1 & 2 - Take notes
  • 12.
  • 13.
    Design - Don’t usevisuals to repeat what you can say with words - Don’t overcrowd visuals with too much information - Use visuals to support or summarize what you say - Only use keywords, not lines of text - Think about which kind of visual is right for you (graph / table / picture / words, etc.) - Use color (but not too much) - Use a maximum of 25-35 numbers for visual aid for number charts
  • 14.
    Use - Don’t usetoo many visuals - Keep it out of sight until you are ready to use it. - Don’t read from the visuals - Make sure the audience understands the visual - Use a pointer and / or masking techniques where appropriate - Face the audience as much as possible - Don’t block the audience’s view - When you have finished using it, get it out of sight if possible.
  • 15.
    Other notes • Developingtitles • Placing the equipment • Using pointers
  • 16.
    Developing titles • SalesFigures  Topic title • Sales in 2010 were up 20% over 2009  Thematic title • We should focus our education effort in the rural areas.  Assertive title
  • 17.
  • 18.
    Using pointers A. Pointersare not needed on word charts. B. When using a pointer, keep your shoulder oriented toward the audience. Do not cross your arm over your body to refer to something on the screen. Instead, hold the pointer in the hand closest to the screen. C. Play with the pointer when not using it. D. When using a laser pointer, don’t try to point with it- rather circle the part of the graph or drawing you want the audience to focus on.
  • 19.
    Remember Your visuals shouldHELP YOU COMMUNICATE your message. They should NOT DISTRACT your audience’s attention from what you say.
  • 20.
    Practice: Task 5– page 23
  • 21.
    What Is Supply-ChainManagement? Developing long term partnerships among channel members working together to create a distribution system that reduces inefficiencies, costs, and redundancies while creating a competitive advantage and satisfying customers. Practice: Task 5 – page 23
  • 23.
    Outline Outline WHY 1 Different Types 2 Tips fordesign and use 3 Language focus 4
  • 24.
    LANGUAGE FOCUS • Introduction& explanation (Focus listeners’ attention on your visual) • Highlights & comments (Point out which parts of the visuals are most significant and why) • Interpretations (Draw a conclusion out of your visual)
  • 25.
    Introduction & explanation (Focuslisteners’ attention on your visual) a) Introduction - Take a look at this (graph; chart; picture…) - Let’s have a look at … - I’d like you to look at … b) Explanation - Here we can see … - The (X axis) represents (different categories of footwear), and the …. represents … - You can see that different colors have been used to indicate … - The key in the bottom left- hand corner shows you …
  • 26.
    Highlights & comments (Pointout which parts of the visuals are most significant and why) • - I’d like us to look at … in more details. As you can see, … • - I’d like to start by drawing your attention to … • - What I’d like to point out here is … • - I think you’ll be surprised to see … • - Let’s look more closely at …
  • 27.
    Interpretations (Draw a conclusionout of your visual) conclusion to be drawn from this are lesson to be learned from this is I’m sure the implications of this are clear to all of us significance of this is message here is
  • 28.
    Match the twoparts to make sentences used to talk about visuals. 1. Let’s now have a look 2. The black line gives us 3. Each line on the graph indicates 4. In the upper right-hand corner 5. The graph on the following slide 6. Now I’d like you to take 7. The names of the new models are listed 8. You can see the test results in the 9. This aspects of the problem is illustrated in 10. I’d like to draw your a. shows our revenues since 2004 b. the next pie chart c. at how the new division will be structured d. attention to the figures in the left- hand corner e. you can see the specifications for the TP model f. the sale figures for the VB Fox g. table on the right h. a look at the next slide i. the production output of a different product j. across the top 1. c 2. f 3. i 4. e 5. a 6. h 7. j 8. g 9. b 10. d
  • 29.
    REFERENCES • Effective Presentations •Professional Presentations • English for Presentations • Presenting in English