Downloaded 987 times

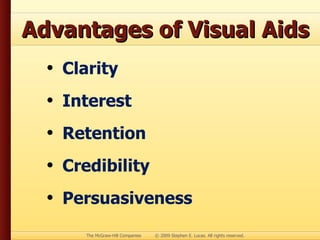
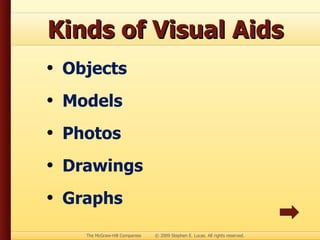
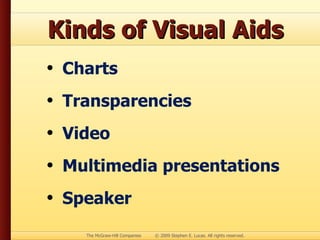


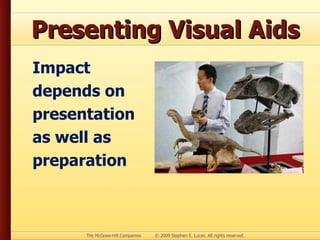

Visual aids like photos, drawings, graphs and charts can make presentations clearer, more interesting and help audiences retain information. The document provides tips for using different types of visual aids effectively, such as making sure photos and drawings are large enough to see, using simple and clear charts to summarize information, and preparing and presenting visual aids in a way that enhances rather than distracts from a speech.