Downloaded 720 times


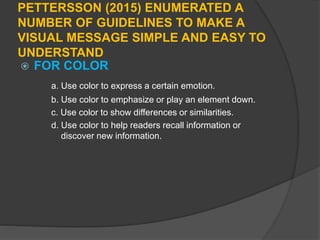


1. A logo using distinct colors, simple shapes, and bold text to clearly convey the business name and purpose. An advertisement poster highlighting essential information through clear images, captions, and minimal distracting elements. 2. A logo incorporating symbolic visual elements and words to represent the business. An advertisement using realistic illustrations and visual sequencing to simply present complex business concepts. 3. A logo with consistent size and distinct contrast between elements. An advertisement restricting the number of visual symbols and keeping the design simple and focused on key selling points.


![Getting Started with Apache Spark: Big Data Made Simple [Free Meetup]](https://cdn.slidesharecdn.com/ss_thumbnails/apachesparkgettingstarted-260203175547-8361bcc3-thumbnail.jpg?width=640&height=640&fit=bounds)


