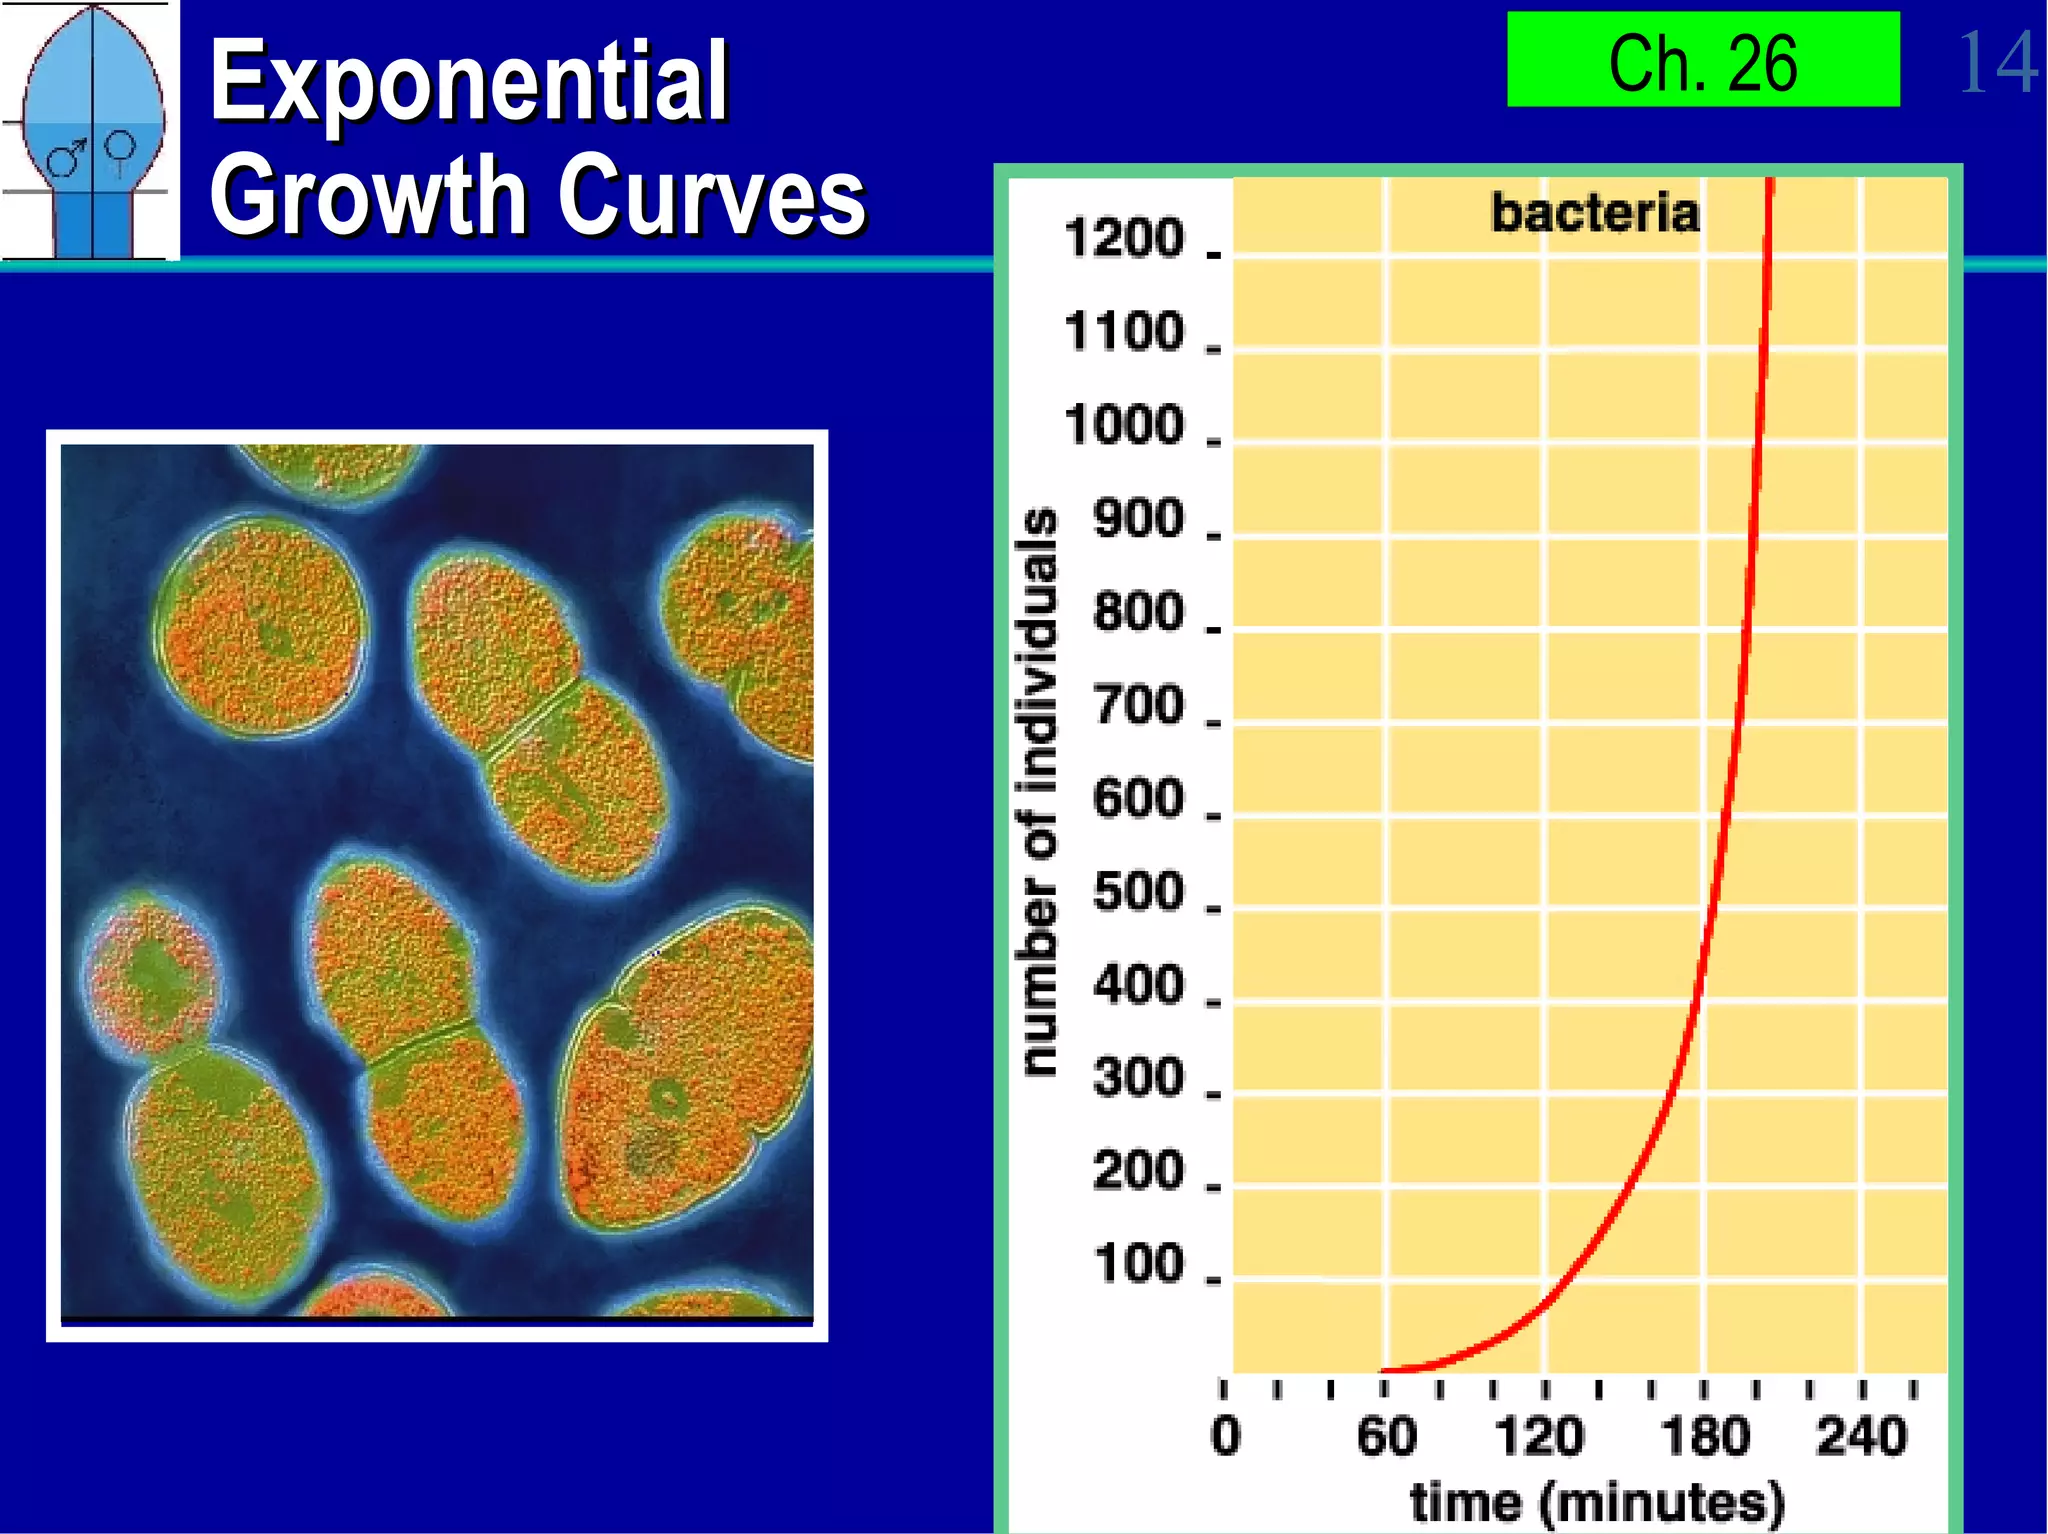
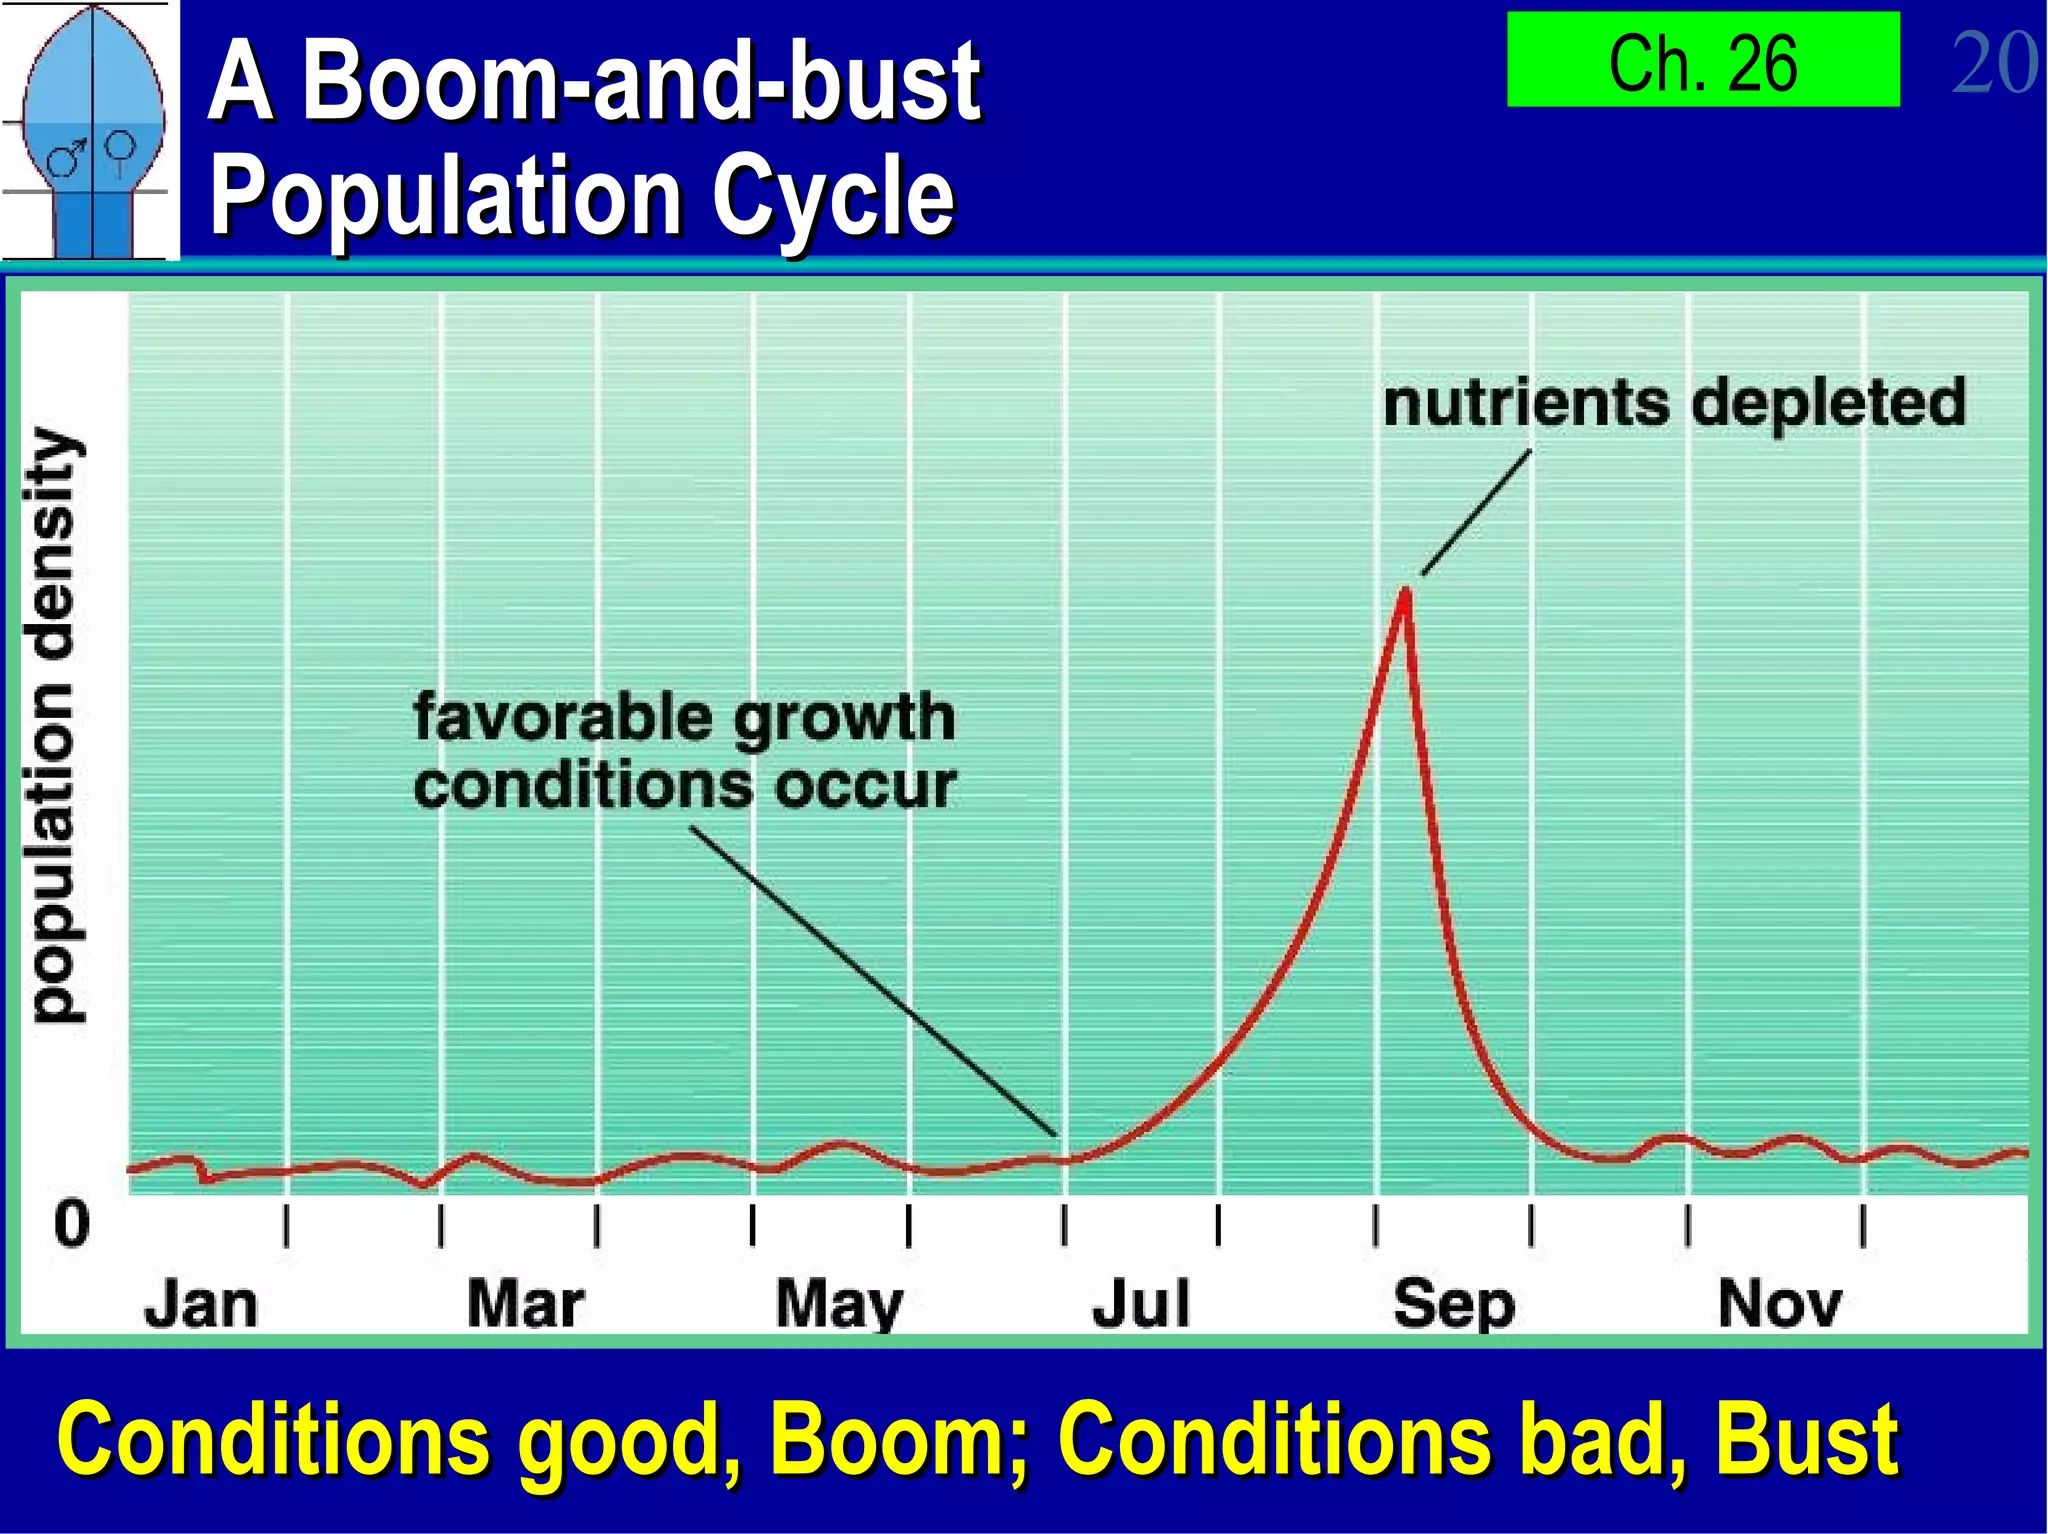
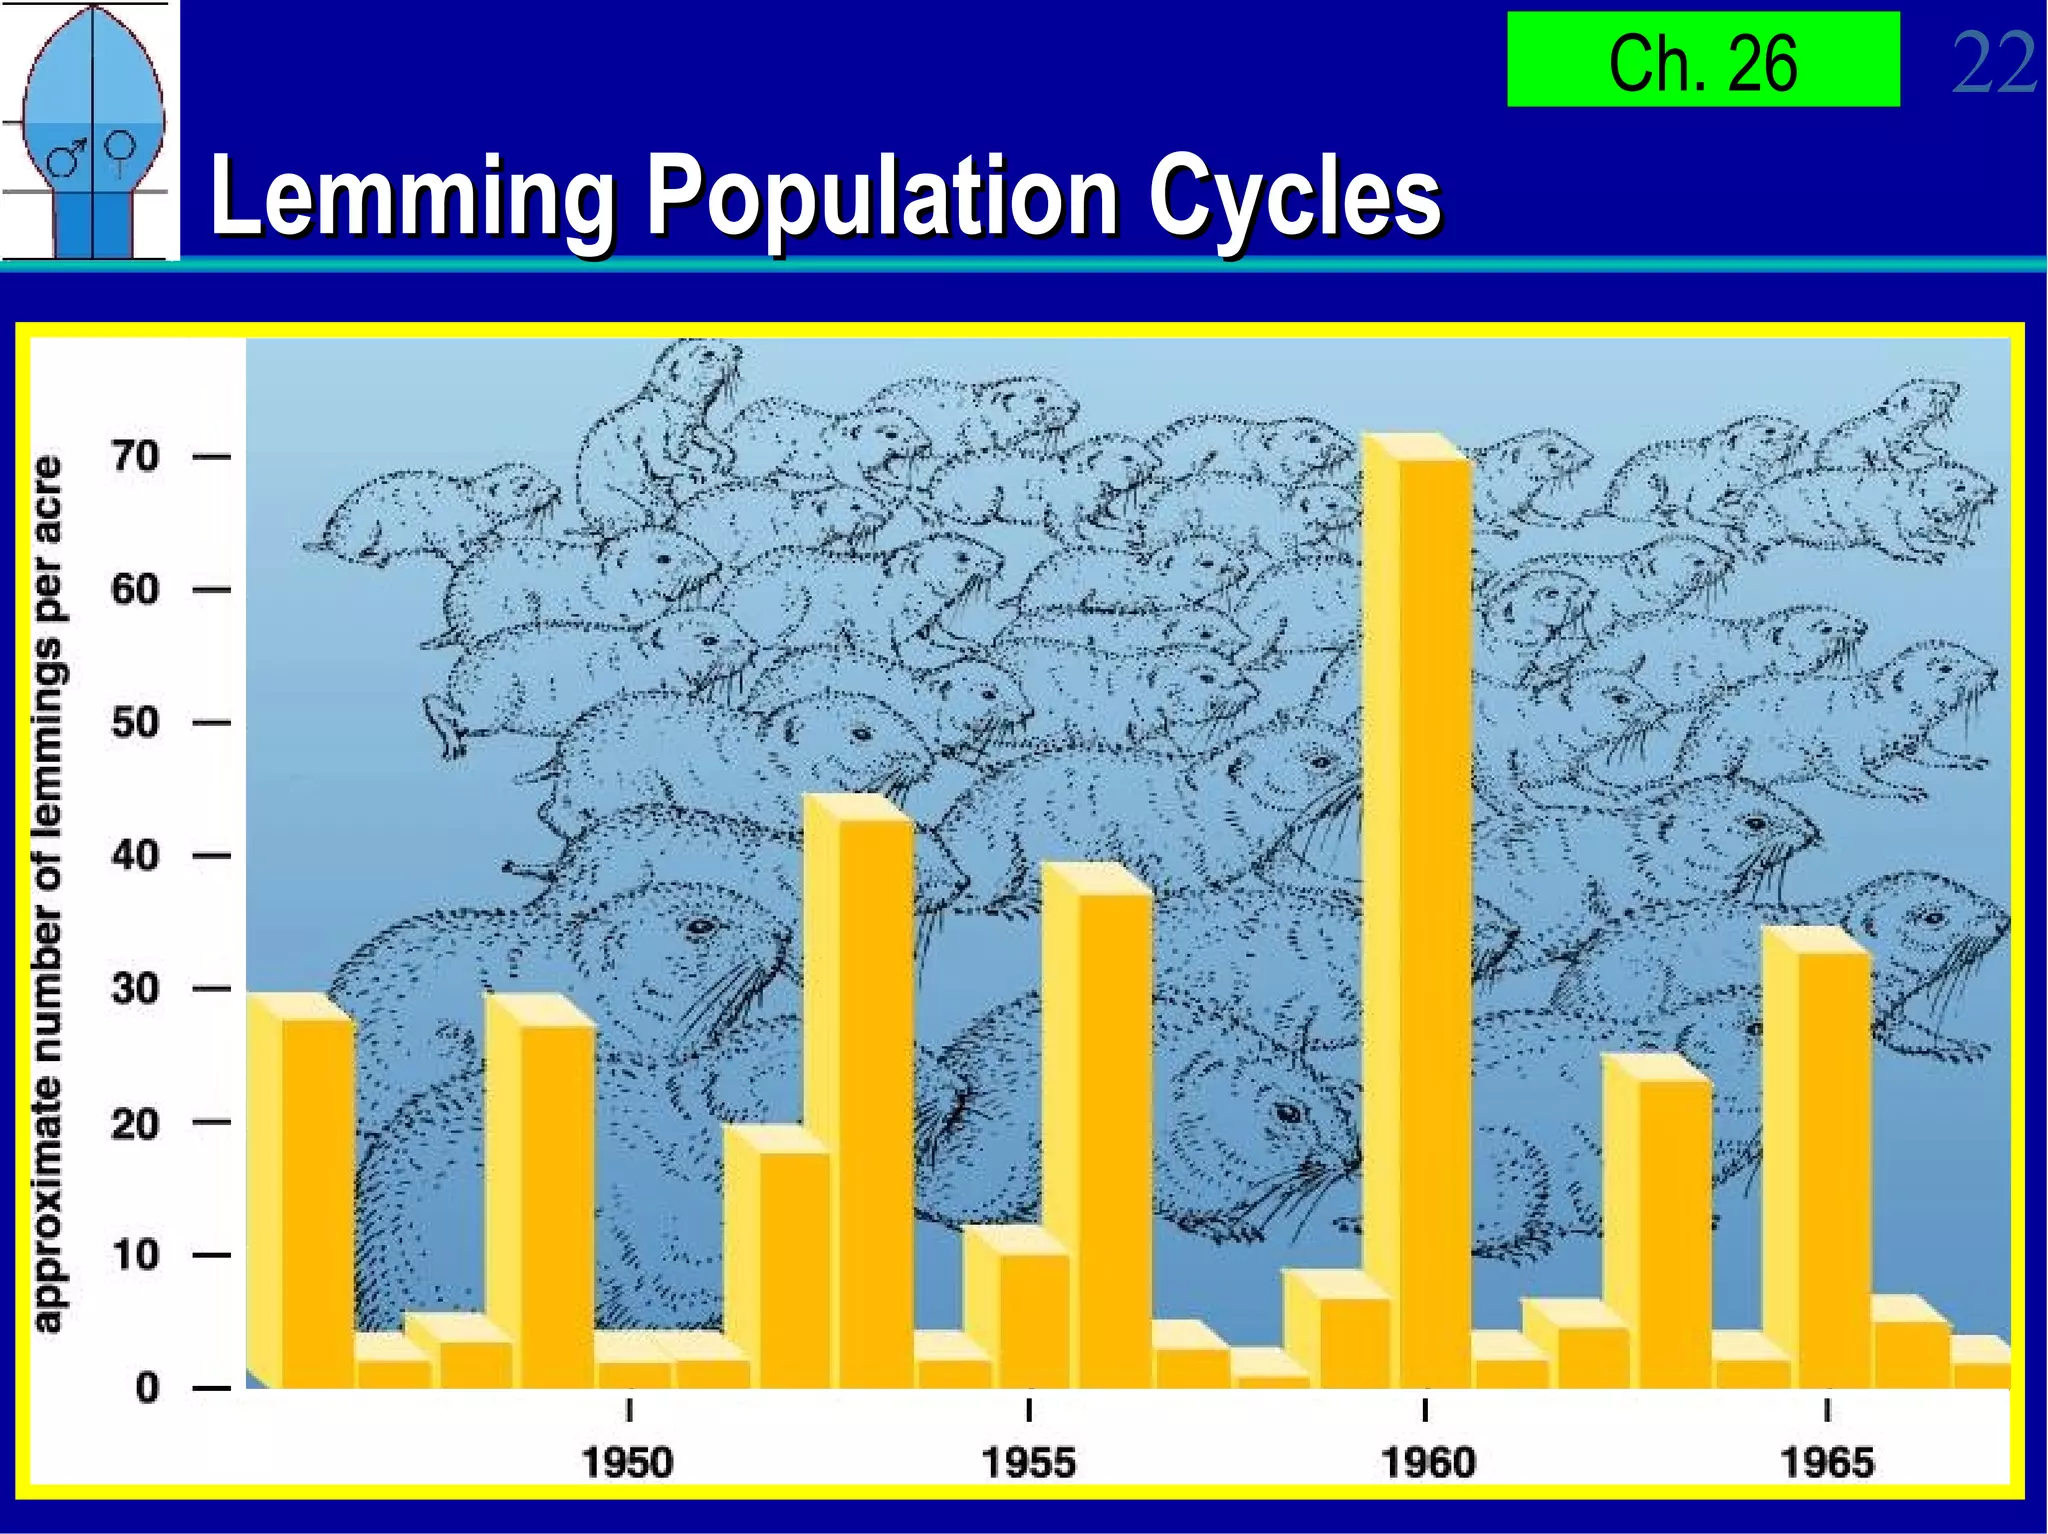
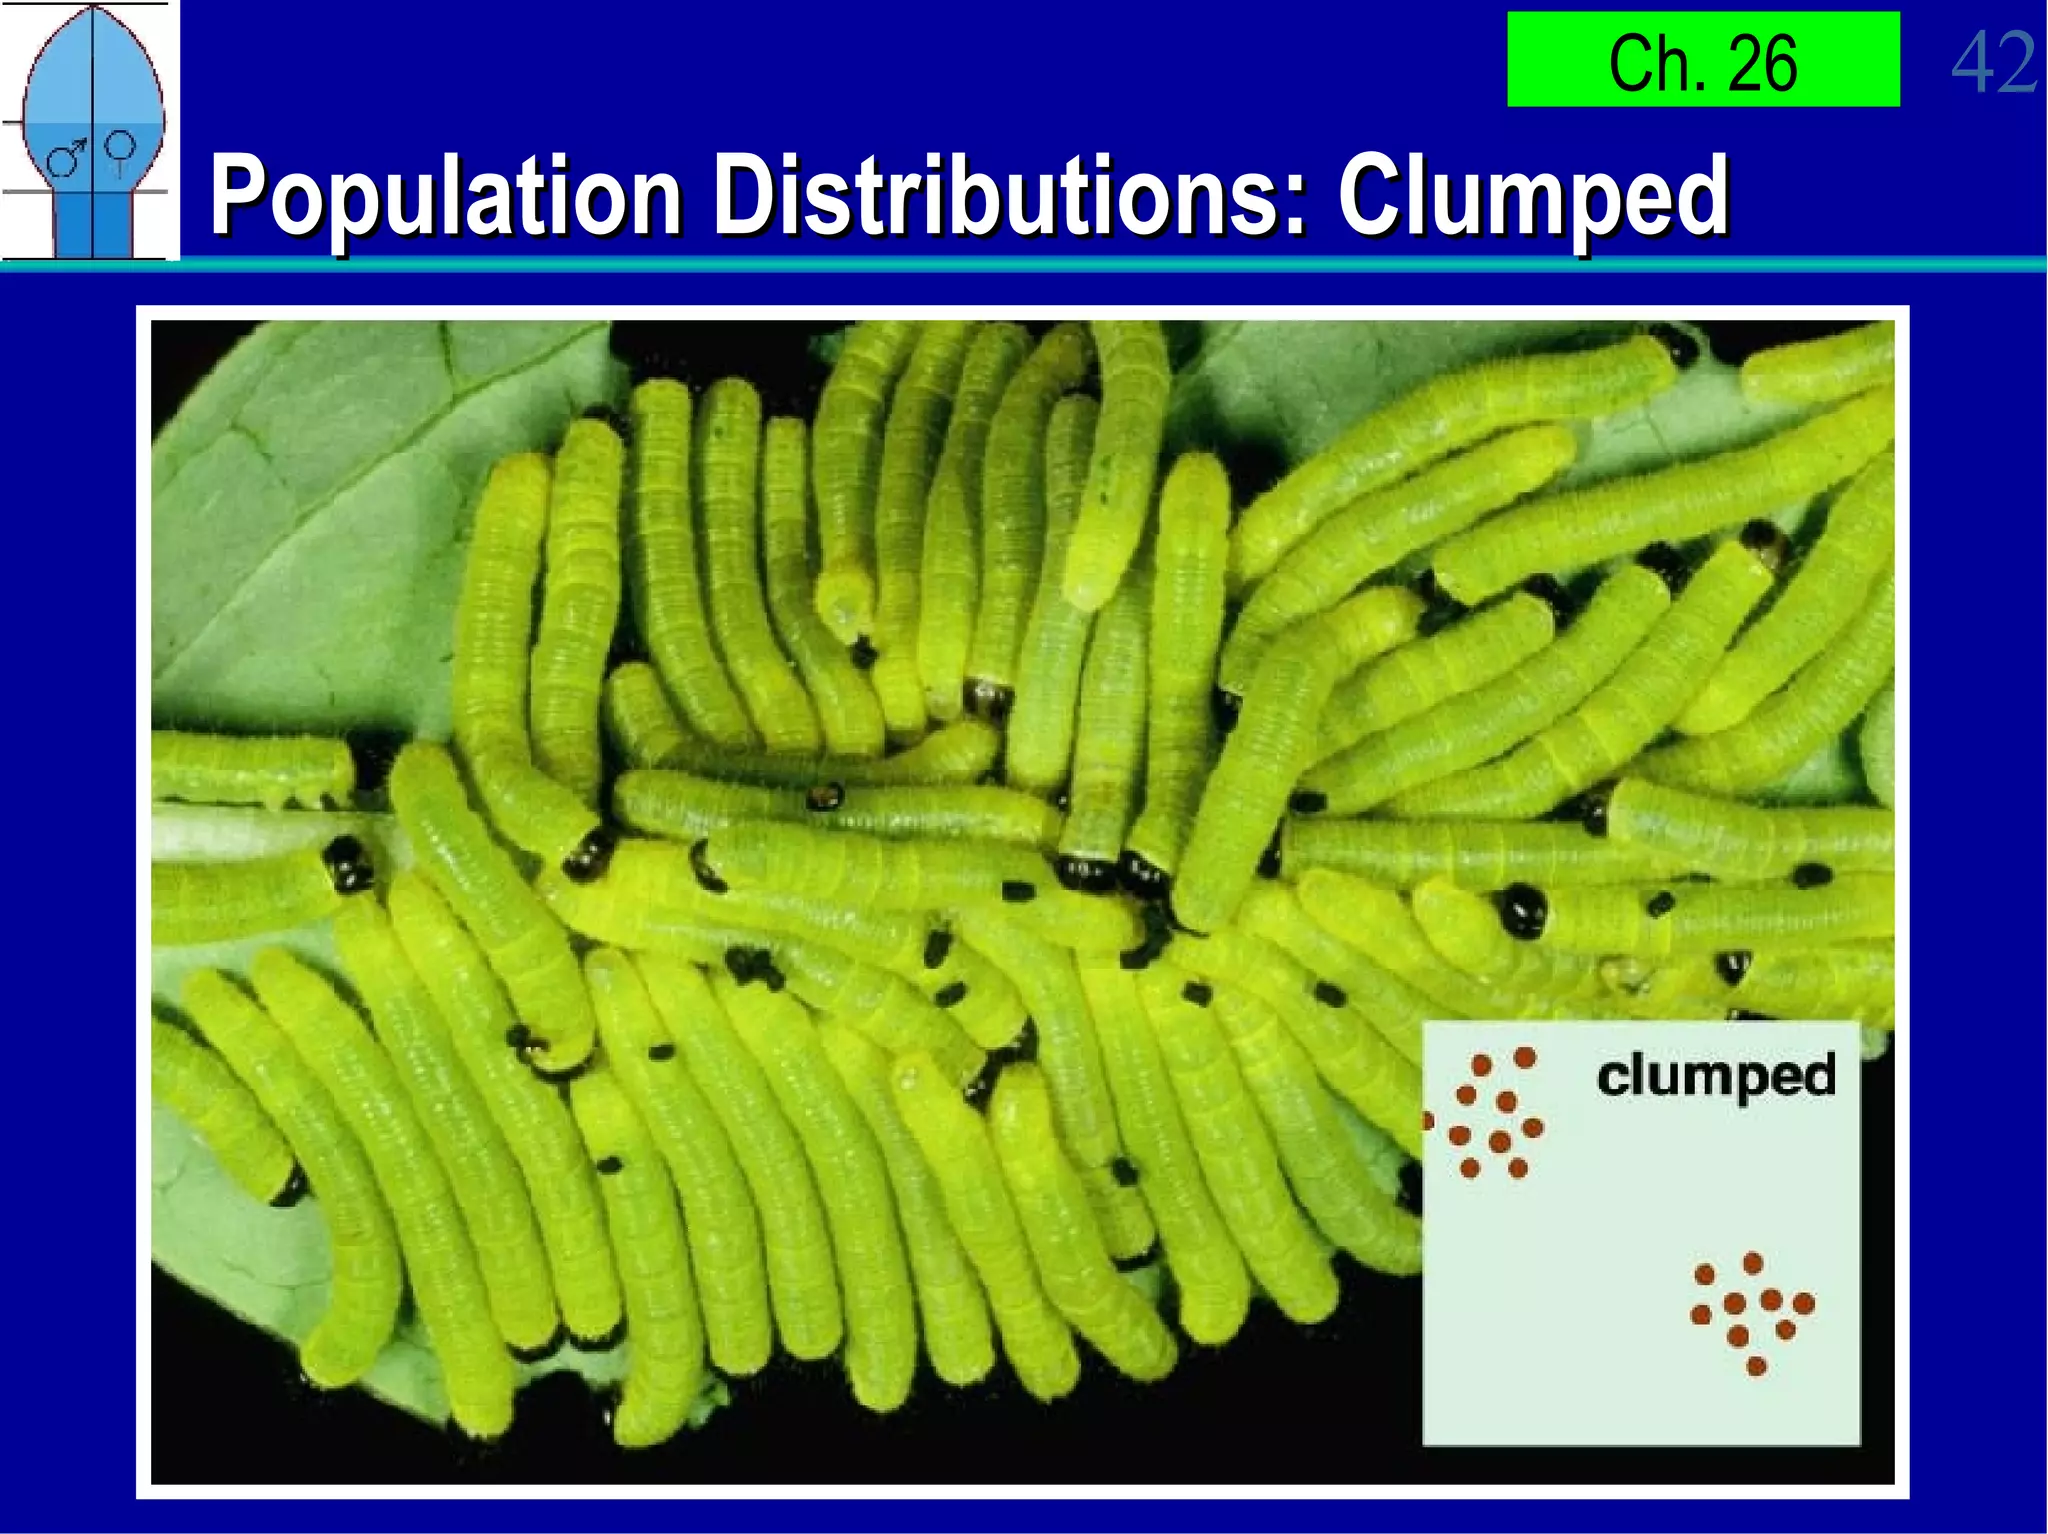
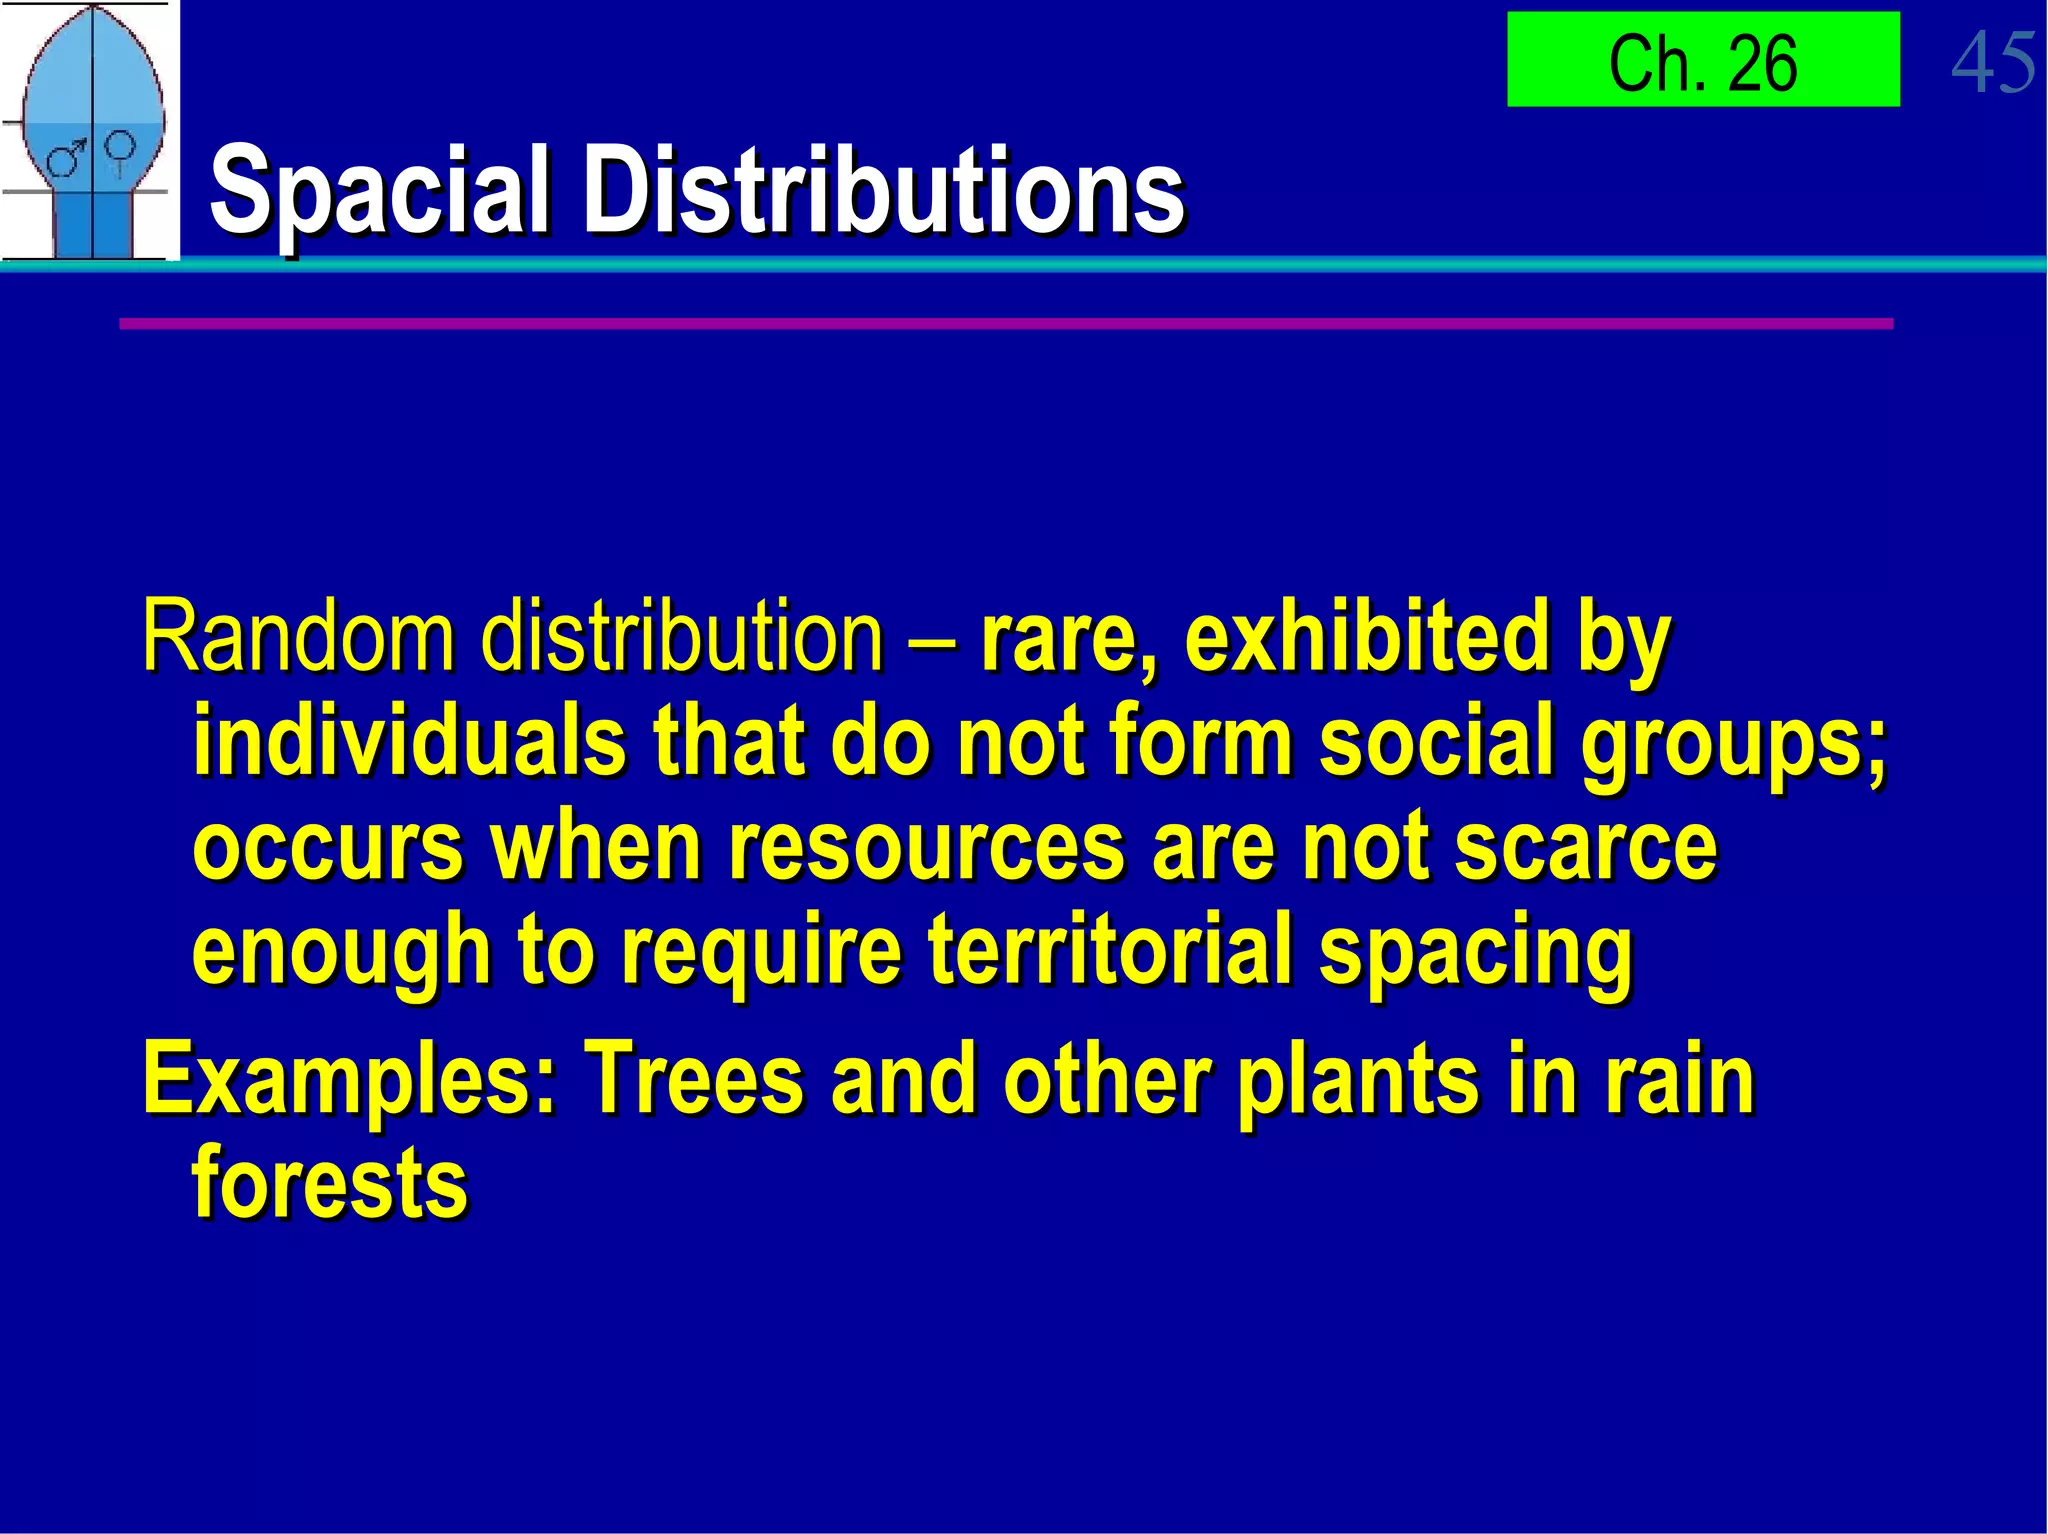
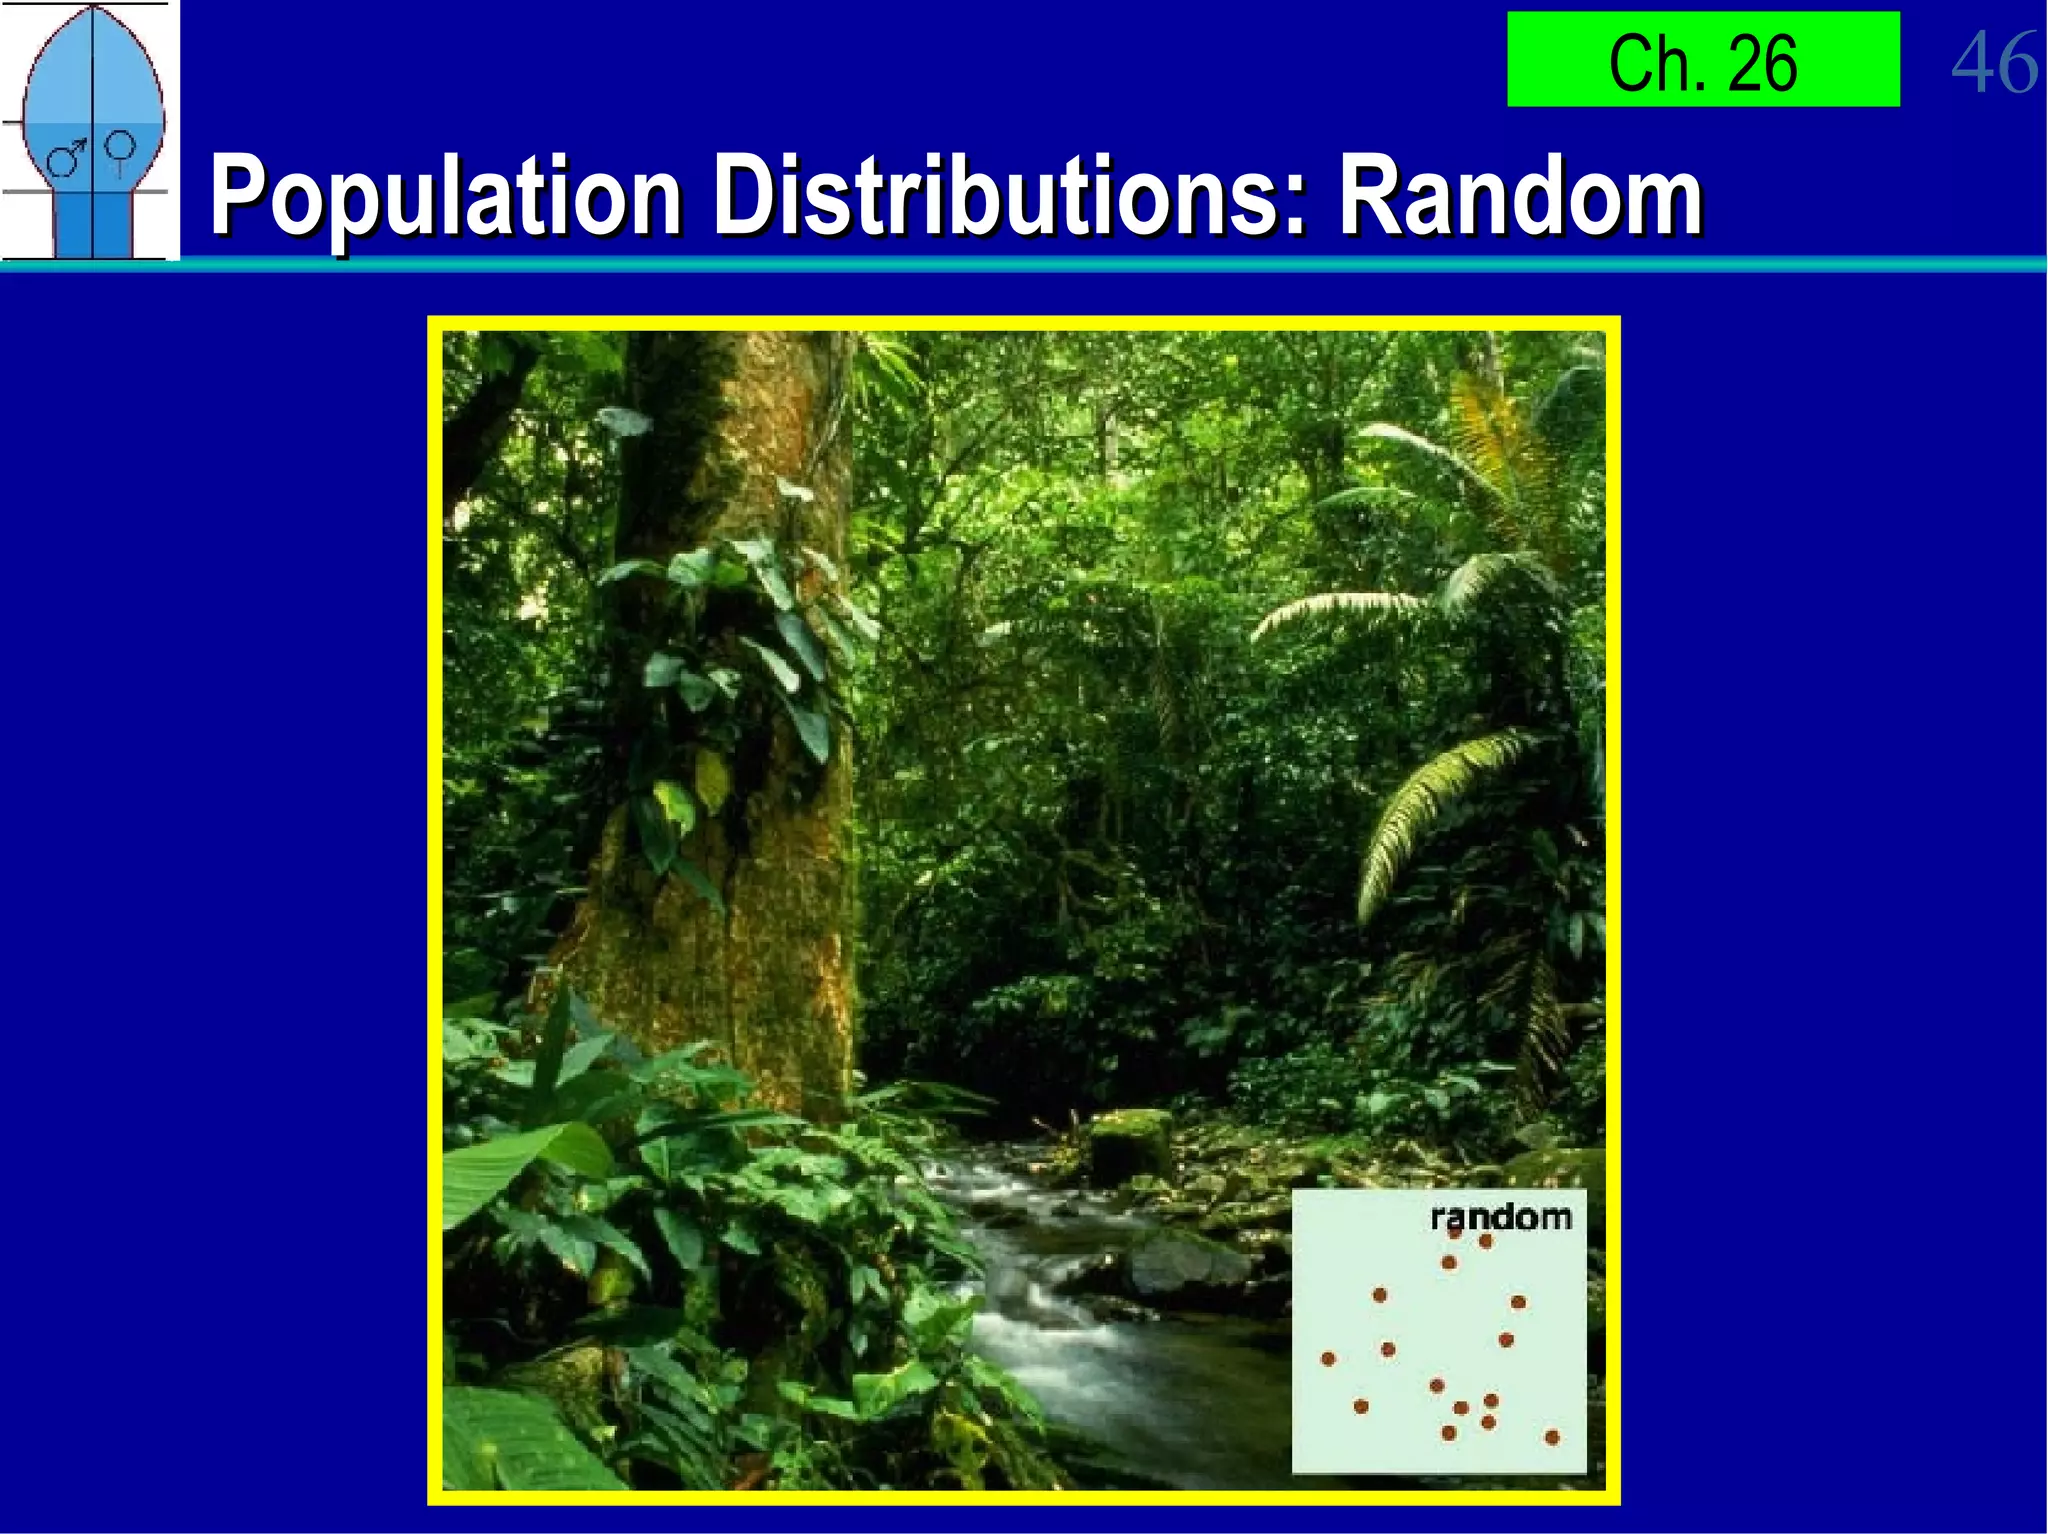
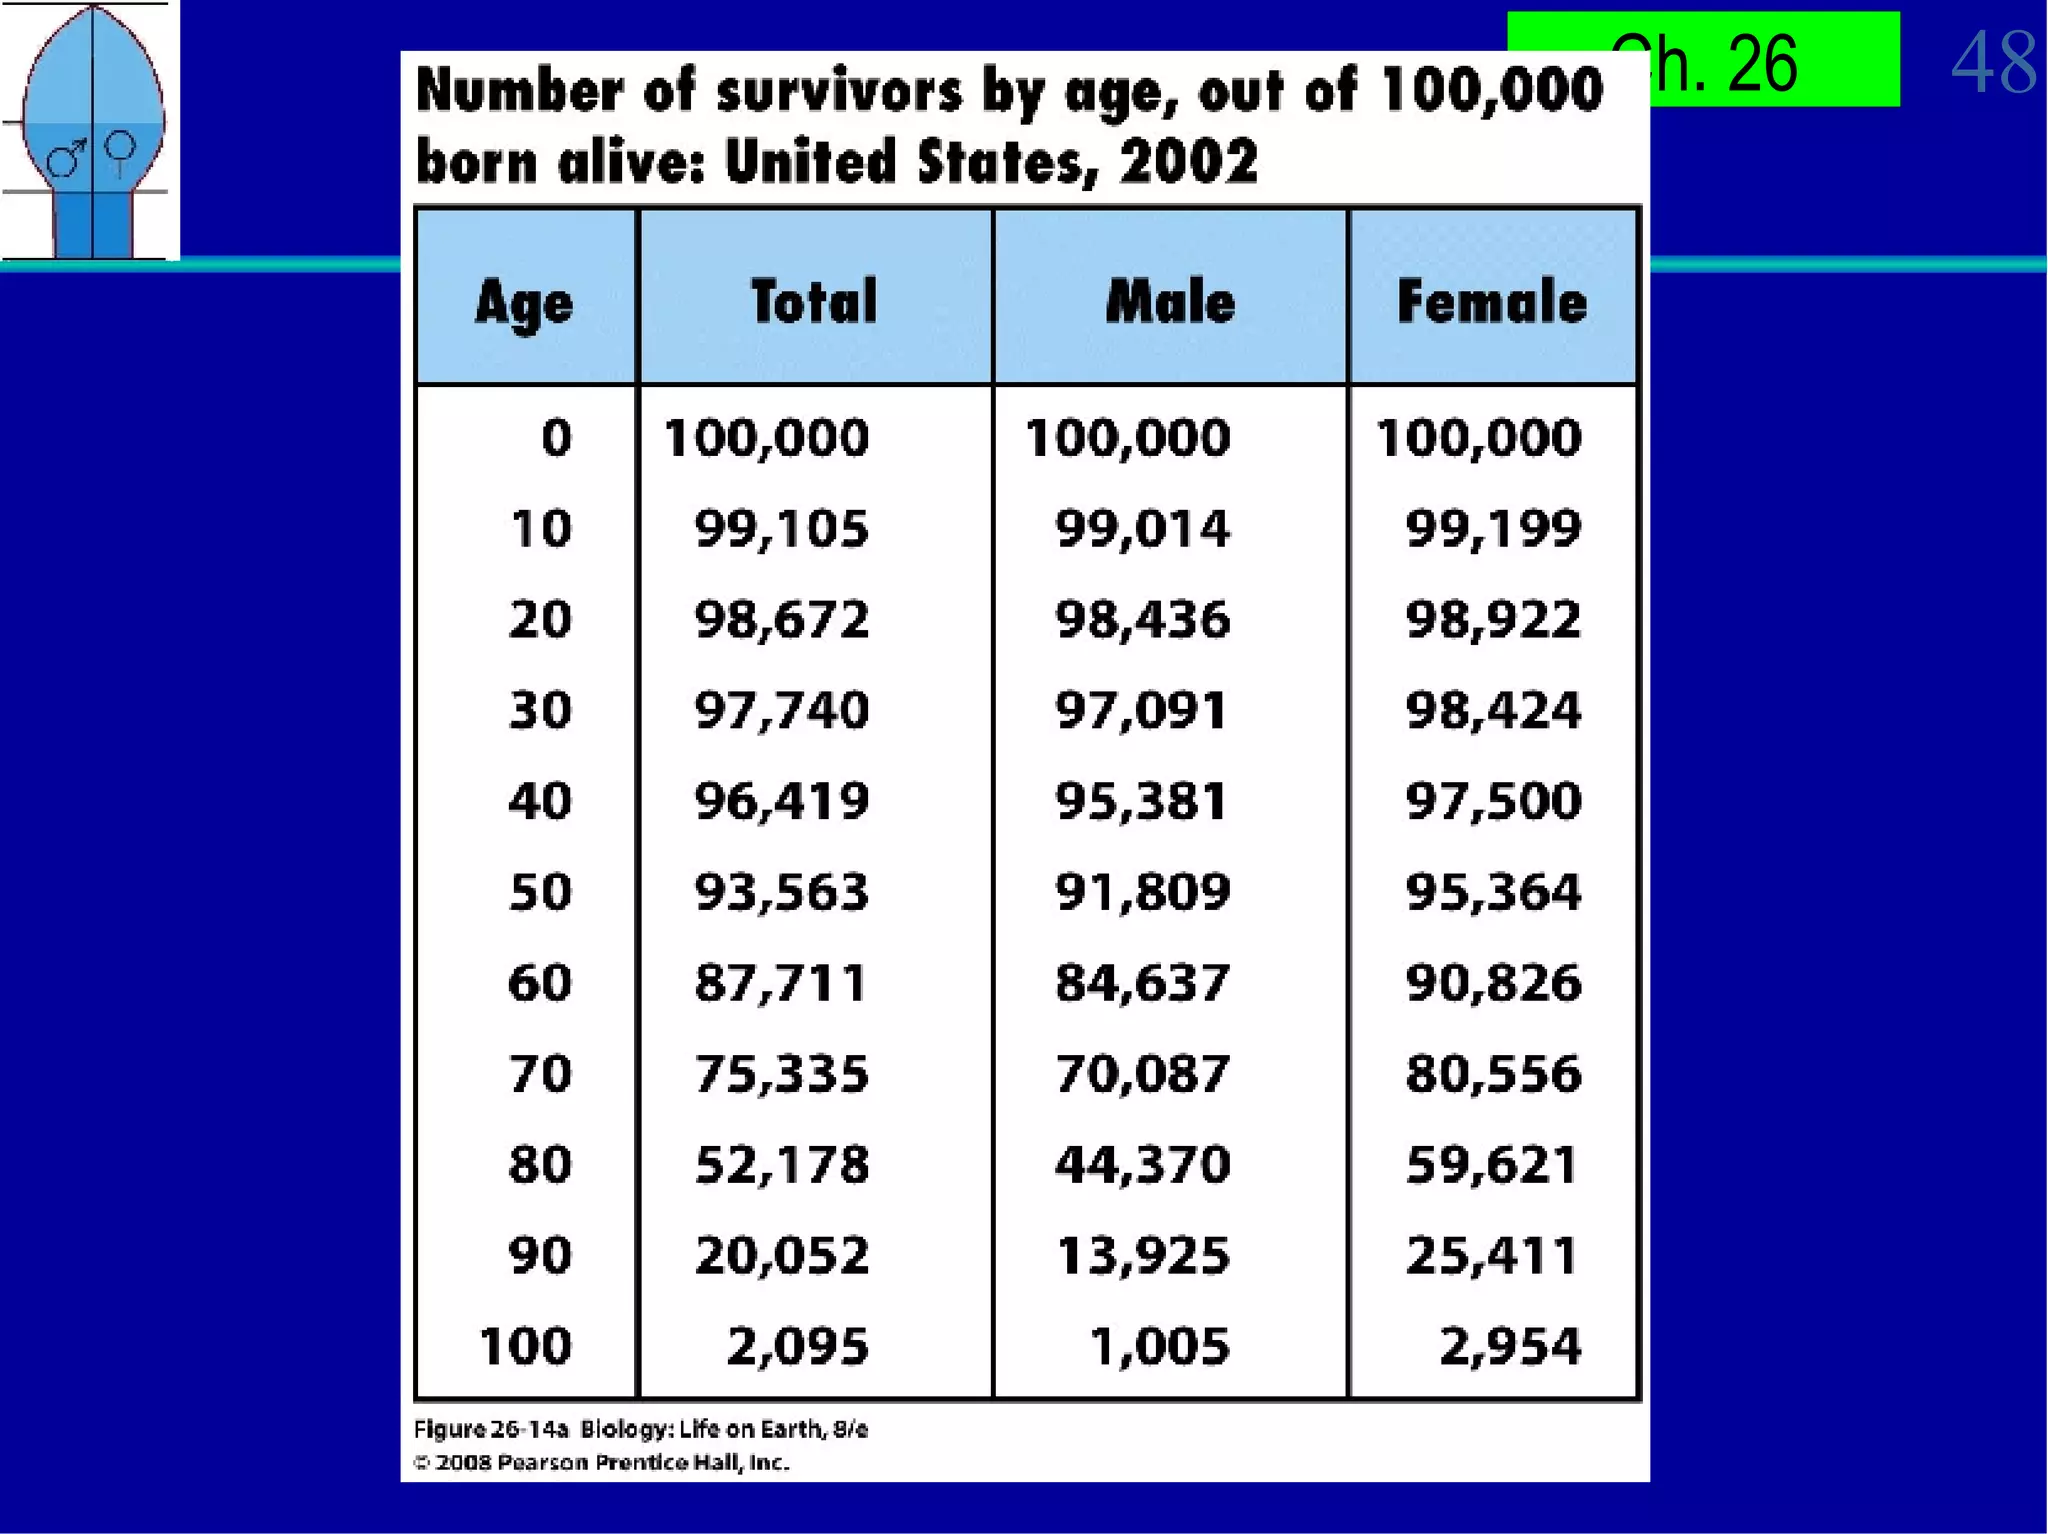
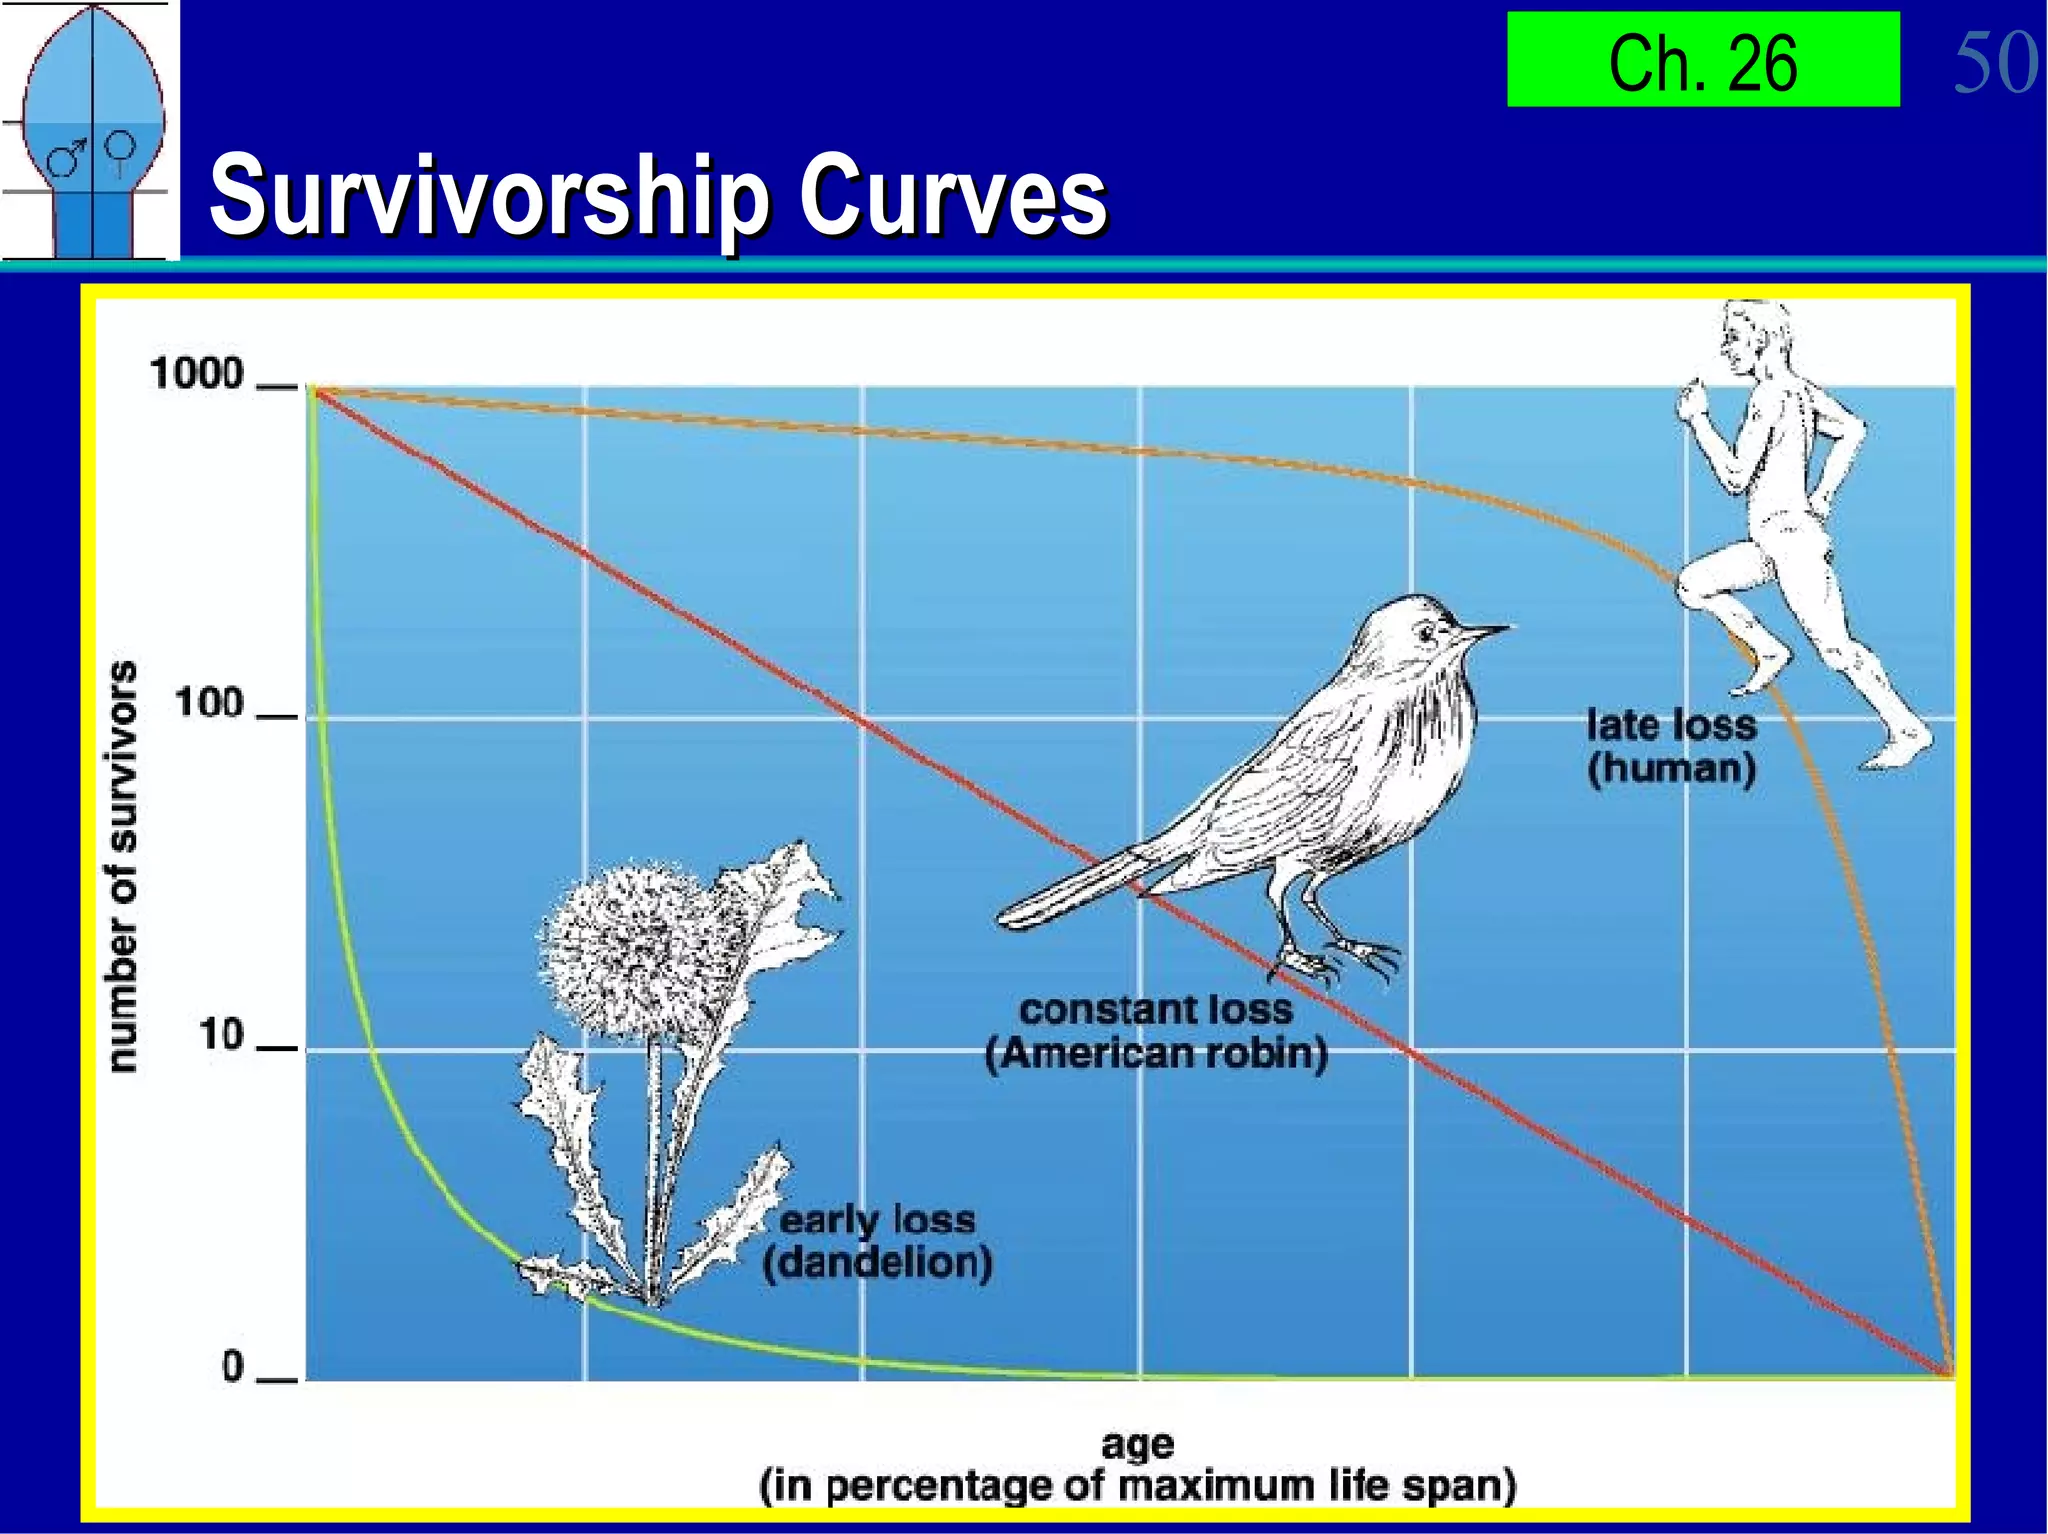
Population Growth and Regulation
The Study of Ecology  Ecology : the study of interrelationships between living things and their nonliving environment The environment consists of two components Abiotic  component: nonliving, such as soil and weather Biotic  component: all living forms of life
The Study of Ecology  Ecology can be studied at several organizational levels Populations : all members of a single species living in a given time and place and actually or potentially interbreeding Ecosystem : all the interacting populations in a given time and place Communities : all the organisms and their nonliving environment in a defined area  Biosphere : all life on Earth
How Does Population Size Change? Several processes can change the size of populations Birth  and  immigration  add individuals to a population  Death  and  emigration  remove individuals from the population Change in population size   = (births – deaths) + (immigrants – emigrants)
How Does Population Size Change? Ignoring migration, population size is determined by two opposing forces Biotic potential : the maximum rate at which a population could increase when birth rate is maximal and death rate minimal Environmental resistance : limits set by the living and nonliving environment that decrease birth rates and/or increase death rates (examples: food, space, and predation)
Population Growth The  growth rate  ( r ) of a population is the change in the population size  per individual  over some time interval Determined by Growth rate ( r ) = birth rate ( b ) – death rate ( d )
Population Growth Birth rate  ( b ) is the average number of births per individual per unit time Example: if there are 5 births among 10 individuals,  b  = 5/10 =  0.5
Population Growth Death rate  ( d ) is the proportion of individuals dying per unit time Example: if 4 of 10 individuals die,  d  = 4/10  =  0.4 Thus,  r  =  b  –  d   = 0.5 – 0.4  =  0.1
Population Growth Population growth per unit of time can be calculated by multiplying growth rate ( r ) by the original population size ( N ) Population growth (G) =  rN   In the previous example, population growth =  rN  = 0.1(10) =  1 , so the population has grown by one individual
Population Growth To determine the size of the population at the end of the time period, add the population growth ( rN ) to the initial population size ( N ) =  N  +  rN   = 10 + 0.1(10)  = 10 + 1  =  11
Exponential Growth Exponential growth  occurs when a population continuously grows at a fixed percentage of its size at the beginning of each time period This results in a  J-shaped growth curve
Exponential Growth Doubling time  describes the amount of time it takes to double its population at its current state of growth Doubling time can be calculated as 0.7 divided by  r   In our previous example, 0.7/0.1 =  7 time intervals
Biotic Potential Biotic potential is influenced by several factors The age at which the organism first reproduces  Populations that have their offspring earlier in life tend to grow at a faster rate (2) The frequency at which reproduction occurs
Exponential Growth Curves
Biotic Potential (3) The average number of offspring produced each time (4) The length of the organism's reproductive life span (5) The death rate of individuals Increased death rates can slow the rate of population growth significantly
Effect of Death Rates on Population Growth No deaths 10% die between doublings 25% die between doublings bacteria
Exponential Growth Exponential growth cannot continue indefinitely All populations that exhibit exponential growth must eventually stabilize or crash Exponential growth can be observed in populations that undergo  boom-and-bust cycles Periods of rapid growth followed by a sudden massive die-off
Exponential Growth Boom-and-bust cycles can be seen in short lived, rapidly reproducing species Ideal conditions encourage rapid growth Deteriorating conditions encourage massive die-off Example Each year cyanobacteria in a lake may exhibit exponential growth when conditions are ideal, but crash when they have depleted their nutrient supply
A Boom-and-bust Population Cycle Conditions good, Boom; Conditions bad, Bust
Exponential Growth Example Lemming cycles are more complex and involve overgrazing of food supply, large migrations, and massive mortality caused by predators and starvation
Lemming Population Cycles
Environmental Resistance Limits Population Growth Decreases birthrate, increases death rate Density-dependent factors Predation Parasitism Competition (inter- and intraspecific) Density-independent factors Weather, pesticides, pollutants Causes populations to stabilize at or below carrying capacity  Maximum population size an area can support long term  Limitations on population growth necessary
The S-Curve of Population Growth (biotic potential) Carrying Capacity Exponential Growth Equilibrium (environmental resistance) Number of Individuals Time
Environmental Resistance Carrying capacity  ( K ) is the maximum population size that can be sustained by an ecosystem for an extended time without damage to the ecosystem
 
 
Environmental Resistance Logistic population growth can occur in nature when a species moves into a new habitat, e.g. barnacles colonizing bare rock along a rocky ocean shoreline Initially, new settlers may find ideal conditions that allow their population to grow almost exponentially As population density increases, individuals compete for space, energy, and nutrients
The Effects of Exceeding Carrying Capacity
Environmental Resistance Environmental resistance can be classified into two broad categories Density-independent factors Density-dependent factors
Density-Independent Factors Density-independent factors  limit populations regardless of their density Examples: climate, weather, floods, fires, pesticide use, pollutant release, and overhunting Some species have evolved means of limiting their losses Examples: seasonally migrating to a better climate or entering a period of dormancy when conditions deteriorate
Density-Dependent Factors Density-dependent factors  become more effective as population density increases Exert negative feedback effect on population size Density-dependent factors  can cause birth rates to drop and/or death rates to increase Population growth slows resulting in an S-shaped growth curve (or  S-curve )
Density-Dependent Factors At carrying capacity, each individual's share of resources is just enough to allow it to replace itself in the next generation  At carrying capacity birth rate ( b ) = death rate ( d )
Density-Dependent Factors Carrying capacity is determined by the continuous availability of resources Include community interactions Predation Parasitism Competition
Predation Predation  involves a  predator  killing a  prey  organism in order to eat it Example: a pack of grey wolves hunting an elk Predators exert density-dependent controls on a population Increased prey availability can increase birth rates and/or decrease death rates of predators Prey population losses will increase
Predation There is often a lag between prey availability and changes in predator numbers  Overshoots in predator numbers may cause predator-prey  population cycles Predator and prey population numbers alternate cycles of growth and decline Predation may maintain prey populations near carrying capacity  “ Surplus" animals are weakened or more exposed
Population Cycles in Predators and Prey
Experimental Predator– prey Cycles
Parasitism Parasitism  involves a  parasite  living on or in a  host  organism, feeding on it but not generally killing it Examples: bacterium causing Lyme disease, some fungi, intestinal worms, ticks, and some protists  While parasites seldom directly kill their hosts, they may weaken them enough that death due to other causes is more likely Parasites spread more readily in large populations
Spatial Distributions  The spatial pattern in which individuals are dispersed within a given area is that population’s  distribution,  which may vary with time There are three major types of spatial distributions Clumped Uniform Random
Spatial Distributions  Clumped distribution –  includes family and social groups  Examples: elephant herds, wolf packs, prides of lions, flocks of birds, and schools of fish Advantages Provides many eyes that can search for localized food sources Confuses predators with sheer numbers Cooperation for hunting more effectively
Population Distributions: Clumped
Spatial Distributions  Uniform   distribution  – constant distance maintained between individuals; common among territorial animals defending scarce resources or defending breeding territories Examples: iguanas, shorebirds, tawny owls Advantage: a uniform distribution helps ensure adequate resources for each individual
Population Distributions: Uniform
Spacial Distributions  Random distribution –  rare, exhibited by individuals that do not form social groups; occurs when resources are not scarce enough to require territorial spacing Examples: Trees and other plants in rain forests
Population Distributions: Random
Survivorship in Populations  Survivorship describes the pattern of survival in a population Life tables  track groups of organisms born at the same time throughout their life span, recording how many continue to survive in each succeeding year
 
Survivorship in Populations  A  survivorship curve  for a population can be produced by graphing life table survivorship data  Y-axis:  the log of the number of individuals surviving to a particular age  X-axis: age Three types of survivorship curves can be distinguished Late loss Constant loss Early loss
Survivorship Curves
Survivorship in Populations  "Late loss" curves : seen in many animals with few offspring that receive substantial parental care; are convex in shape, with low mortality until individuals reach old age Examples: humans and many large mammals
Survivorship in Populations  "Constant loss" curves : an approximate straight line, indicates an equal chance of dying at any age  Example: some bird species
Survivorship in Populations  "Early loss" curves : high early mortality as most offspring fail to become established; are concave in shape  Typical of most plants and many animals that do not receive parental care Examples: most invertebrates and fish
Human Population Growing exponentially Exponential growth will continue (age-structure) Developed countries with more stable populations We continue to overcome environmental resistance Medical advances, agricultural revolution U.S. population Growing faster than world average (>1% annually) Immigration accounts for 30% of our growth Baby boomers are at reproductive age
Rapid Human Population Growth In the last few centuries, the human population has grown at nearly an exponential rate Follows a J-shaped growth curve
Technological Advances Most species must "make due" with the resources in an area  Humans have manipulated the environment to increase the Earth’s carrying capacity Several technological “revolutions” have greatly influenced the human ability to make resources available Technical and cultural revolution Agricultural revolution   Industrial-medical revolution
Human Population Growth
Demographic Transition In "developed" countries, the  industrial-medical revolution  resulted in an initial rise in population, which then stabilized Caused by a decrease in death rates, followed later by a decrease in birth rates
Pop. Growth Rates: Developed & Developing Countries Developing Countries Developed Countries
Demographic Transition Declining birth rates associated with demographic transition result from many factors Better education Increased access to contraceptives Shift of populations to cities (children provide fewer advantages than in agricultural areas) More women working outside the home
Demographic Transition Demographic transition has occurred in most  developed countries When the adults of a population have just enough children to replace themselves, the  situation is called  replacement-level fertility (RLF) Because not all children survive to maturity, RLF is slightly higher than 2
Uneven Distribution Many "developing" countries still have rapidly growing populations, as birth rates vastly exceed death rates As in developed countries, death rates from infectious disease and starvation are low However, birth rates remain high Low incomes and the need for many children to raise family income or produce food Knowledge of and access to contraception are limited
Population Age Structure Age structure Refers to the distribution of human populations according to age groups  Age structure can be shown graphically  Age is shown on the vertical axis  The number of individuals in each age group is shown on the horizontal axis, with males and females placed on opposite sides
Population Age Structure All age-structure diagrams peak at the maximum life span, but the shape below the peak reveals if the population is expanding, stable, or shrinking
Generalized Age-Structure Diagrams Post-Reproductive (46-100 y old) Reproductive (15-45 y old) Pre-Reproductive (0-14 y old) Expanding Stable Contracting
Age Structures Compared
Population Age Structure These diagrams reveal that even if developing countries were to achieve RLF immediately, their population increases would continue for decades A large population of children today create a momentum for future growth as they enter their reproductive years
Fertility in Europe A comparison of growth rates for various world regions shows Europe as the only one with average rate of change that is negative
Population Growth by World Regions 0 0.5 1 1.5 2 2.5 3 -0.5 World Average 1.4% Developing Countries 1.7% Africa 2.4% Latin America/Caribbean 1.8% Asia (excluding China) 1.7% China 0.9% North America 0.6% Developed   Countries 0.1% Europe -0.1% Natural Increase (annual %)
The U.S. Population U.S. population is fastest growing of all industrial nations  U.S. fertility rate is only ~2.0, actually below RLF However, immigration is adding people rapidly
U.S. Population Growth U. S. over-consumes and over-pollutes U.S. citizen uses 6X energy of average world citizen 4.7% of world population  22% of carbon dioxide and CFC emissions
The End

Population Growth APBio

  • 1.
  • 2.
    The Study ofEcology Ecology : the study of interrelationships between living things and their nonliving environment The environment consists of two components Abiotic component: nonliving, such as soil and weather Biotic component: all living forms of life
  • 3.
    The Study ofEcology Ecology can be studied at several organizational levels Populations : all members of a single species living in a given time and place and actually or potentially interbreeding Ecosystem : all the interacting populations in a given time and place Communities : all the organisms and their nonliving environment in a defined area Biosphere : all life on Earth
  • 4.
    How Does PopulationSize Change? Several processes can change the size of populations Birth and immigration add individuals to a population Death and emigration remove individuals from the population Change in population size = (births – deaths) + (immigrants – emigrants)
  • 5.
    How Does PopulationSize Change? Ignoring migration, population size is determined by two opposing forces Biotic potential : the maximum rate at which a population could increase when birth rate is maximal and death rate minimal Environmental resistance : limits set by the living and nonliving environment that decrease birth rates and/or increase death rates (examples: food, space, and predation)
  • 6.
    Population Growth The growth rate ( r ) of a population is the change in the population size per individual over some time interval Determined by Growth rate ( r ) = birth rate ( b ) – death rate ( d )
  • 7.
    Population Growth Birthrate ( b ) is the average number of births per individual per unit time Example: if there are 5 births among 10 individuals, b = 5/10 = 0.5
  • 8.
    Population Growth Deathrate ( d ) is the proportion of individuals dying per unit time Example: if 4 of 10 individuals die, d = 4/10 = 0.4 Thus, r = b – d = 0.5 – 0.4 = 0.1
  • 9.
    Population Growth Populationgrowth per unit of time can be calculated by multiplying growth rate ( r ) by the original population size ( N ) Population growth (G) = rN In the previous example, population growth = rN = 0.1(10) = 1 , so the population has grown by one individual
  • 10.
    Population Growth Todetermine the size of the population at the end of the time period, add the population growth ( rN ) to the initial population size ( N ) = N + rN = 10 + 0.1(10) = 10 + 1 = 11
  • 11.
    Exponential Growth Exponentialgrowth occurs when a population continuously grows at a fixed percentage of its size at the beginning of each time period This results in a J-shaped growth curve
  • 12.
    Exponential Growth Doublingtime describes the amount of time it takes to double its population at its current state of growth Doubling time can be calculated as 0.7 divided by r In our previous example, 0.7/0.1 = 7 time intervals
  • 13.
    Biotic Potential Bioticpotential is influenced by several factors The age at which the organism first reproduces Populations that have their offspring earlier in life tend to grow at a faster rate (2) The frequency at which reproduction occurs
  • 14.
  • 15.
  • 16.
    Biotic Potential (3)The average number of offspring produced each time (4) The length of the organism's reproductive life span (5) The death rate of individuals Increased death rates can slow the rate of population growth significantly
  • 17.
    Effect of DeathRates on Population Growth No deaths 10% die between doublings 25% die between doublings bacteria
  • 18.
    Exponential Growth Exponentialgrowth cannot continue indefinitely All populations that exhibit exponential growth must eventually stabilize or crash Exponential growth can be observed in populations that undergo boom-and-bust cycles Periods of rapid growth followed by a sudden massive die-off
  • 19.
    Exponential Growth Boom-and-bustcycles can be seen in short lived, rapidly reproducing species Ideal conditions encourage rapid growth Deteriorating conditions encourage massive die-off Example Each year cyanobacteria in a lake may exhibit exponential growth when conditions are ideal, but crash when they have depleted their nutrient supply
  • 20.
    A Boom-and-bust PopulationCycle Conditions good, Boom; Conditions bad, Bust
  • 21.
    Exponential Growth ExampleLemming cycles are more complex and involve overgrazing of food supply, large migrations, and massive mortality caused by predators and starvation
  • 22.
  • 23.
    Environmental Resistance LimitsPopulation Growth Decreases birthrate, increases death rate Density-dependent factors Predation Parasitism Competition (inter- and intraspecific) Density-independent factors Weather, pesticides, pollutants Causes populations to stabilize at or below carrying capacity Maximum population size an area can support long term Limitations on population growth necessary
  • 24.
    The S-Curve ofPopulation Growth (biotic potential) Carrying Capacity Exponential Growth Equilibrium (environmental resistance) Number of Individuals Time
  • 25.
    Environmental Resistance Carryingcapacity ( K ) is the maximum population size that can be sustained by an ecosystem for an extended time without damage to the ecosystem
  • 26.
  • 27.
  • 28.
    Environmental Resistance Logisticpopulation growth can occur in nature when a species moves into a new habitat, e.g. barnacles colonizing bare rock along a rocky ocean shoreline Initially, new settlers may find ideal conditions that allow their population to grow almost exponentially As population density increases, individuals compete for space, energy, and nutrients
  • 29.
    The Effects ofExceeding Carrying Capacity
  • 30.
    Environmental Resistance Environmentalresistance can be classified into two broad categories Density-independent factors Density-dependent factors
  • 31.
    Density-Independent Factors Density-independentfactors limit populations regardless of their density Examples: climate, weather, floods, fires, pesticide use, pollutant release, and overhunting Some species have evolved means of limiting their losses Examples: seasonally migrating to a better climate or entering a period of dormancy when conditions deteriorate
  • 32.
    Density-Dependent Factors Density-dependentfactors become more effective as population density increases Exert negative feedback effect on population size Density-dependent factors can cause birth rates to drop and/or death rates to increase Population growth slows resulting in an S-shaped growth curve (or S-curve )
  • 33.
    Density-Dependent Factors Atcarrying capacity, each individual's share of resources is just enough to allow it to replace itself in the next generation At carrying capacity birth rate ( b ) = death rate ( d )
  • 34.
    Density-Dependent Factors Carryingcapacity is determined by the continuous availability of resources Include community interactions Predation Parasitism Competition
  • 35.
    Predation Predation involves a predator killing a prey organism in order to eat it Example: a pack of grey wolves hunting an elk Predators exert density-dependent controls on a population Increased prey availability can increase birth rates and/or decrease death rates of predators Prey population losses will increase
  • 36.
    Predation There isoften a lag between prey availability and changes in predator numbers Overshoots in predator numbers may cause predator-prey population cycles Predator and prey population numbers alternate cycles of growth and decline Predation may maintain prey populations near carrying capacity “ Surplus" animals are weakened or more exposed
  • 37.
    Population Cycles inPredators and Prey
  • 38.
  • 39.
    Parasitism Parasitism involves a parasite living on or in a host organism, feeding on it but not generally killing it Examples: bacterium causing Lyme disease, some fungi, intestinal worms, ticks, and some protists While parasites seldom directly kill their hosts, they may weaken them enough that death due to other causes is more likely Parasites spread more readily in large populations
  • 40.
    Spatial Distributions The spatial pattern in which individuals are dispersed within a given area is that population’s distribution, which may vary with time There are three major types of spatial distributions Clumped Uniform Random
  • 41.
    Spatial Distributions Clumped distribution – includes family and social groups Examples: elephant herds, wolf packs, prides of lions, flocks of birds, and schools of fish Advantages Provides many eyes that can search for localized food sources Confuses predators with sheer numbers Cooperation for hunting more effectively
  • 42.
  • 43.
    Spatial Distributions Uniform distribution – constant distance maintained between individuals; common among territorial animals defending scarce resources or defending breeding territories Examples: iguanas, shorebirds, tawny owls Advantage: a uniform distribution helps ensure adequate resources for each individual
  • 44.
  • 45.
    Spacial Distributions Random distribution – rare, exhibited by individuals that do not form social groups; occurs when resources are not scarce enough to require territorial spacing Examples: Trees and other plants in rain forests
  • 46.
  • 47.
    Survivorship in Populations Survivorship describes the pattern of survival in a population Life tables track groups of organisms born at the same time throughout their life span, recording how many continue to survive in each succeeding year
  • 48.
  • 49.
    Survivorship in Populations A survivorship curve for a population can be produced by graphing life table survivorship data Y-axis: the log of the number of individuals surviving to a particular age X-axis: age Three types of survivorship curves can be distinguished Late loss Constant loss Early loss
  • 50.
  • 51.
    Survivorship in Populations "Late loss" curves : seen in many animals with few offspring that receive substantial parental care; are convex in shape, with low mortality until individuals reach old age Examples: humans and many large mammals
  • 52.
    Survivorship in Populations "Constant loss" curves : an approximate straight line, indicates an equal chance of dying at any age Example: some bird species
  • 53.
    Survivorship in Populations "Early loss" curves : high early mortality as most offspring fail to become established; are concave in shape Typical of most plants and many animals that do not receive parental care Examples: most invertebrates and fish
  • 54.
    Human Population Growingexponentially Exponential growth will continue (age-structure) Developed countries with more stable populations We continue to overcome environmental resistance Medical advances, agricultural revolution U.S. population Growing faster than world average (>1% annually) Immigration accounts for 30% of our growth Baby boomers are at reproductive age
  • 55.
    Rapid Human PopulationGrowth In the last few centuries, the human population has grown at nearly an exponential rate Follows a J-shaped growth curve
  • 56.
    Technological Advances Mostspecies must "make due" with the resources in an area Humans have manipulated the environment to increase the Earth’s carrying capacity Several technological “revolutions” have greatly influenced the human ability to make resources available Technical and cultural revolution Agricultural revolution Industrial-medical revolution
  • 57.
  • 58.
    Demographic Transition In"developed" countries, the industrial-medical revolution resulted in an initial rise in population, which then stabilized Caused by a decrease in death rates, followed later by a decrease in birth rates
  • 59.
    Pop. Growth Rates:Developed & Developing Countries Developing Countries Developed Countries
  • 60.
    Demographic Transition Decliningbirth rates associated with demographic transition result from many factors Better education Increased access to contraceptives Shift of populations to cities (children provide fewer advantages than in agricultural areas) More women working outside the home
  • 61.
    Demographic Transition Demographictransition has occurred in most developed countries When the adults of a population have just enough children to replace themselves, the situation is called replacement-level fertility (RLF) Because not all children survive to maturity, RLF is slightly higher than 2
  • 62.
    Uneven Distribution Many"developing" countries still have rapidly growing populations, as birth rates vastly exceed death rates As in developed countries, death rates from infectious disease and starvation are low However, birth rates remain high Low incomes and the need for many children to raise family income or produce food Knowledge of and access to contraception are limited
  • 63.
    Population Age StructureAge structure Refers to the distribution of human populations according to age groups Age structure can be shown graphically Age is shown on the vertical axis The number of individuals in each age group is shown on the horizontal axis, with males and females placed on opposite sides
  • 64.
    Population Age StructureAll age-structure diagrams peak at the maximum life span, but the shape below the peak reveals if the population is expanding, stable, or shrinking
  • 65.
    Generalized Age-Structure DiagramsPost-Reproductive (46-100 y old) Reproductive (15-45 y old) Pre-Reproductive (0-14 y old) Expanding Stable Contracting
  • 66.
  • 67.
  • 68.
    Population Age StructureThese diagrams reveal that even if developing countries were to achieve RLF immediately, their population increases would continue for decades A large population of children today create a momentum for future growth as they enter their reproductive years
  • 69.
    Fertility in EuropeA comparison of growth rates for various world regions shows Europe as the only one with average rate of change that is negative
  • 70.
    Population Growth byWorld Regions 0 0.5 1 1.5 2 2.5 3 -0.5 World Average 1.4% Developing Countries 1.7% Africa 2.4% Latin America/Caribbean 1.8% Asia (excluding China) 1.7% China 0.9% North America 0.6% Developed Countries 0.1% Europe -0.1% Natural Increase (annual %)
  • 71.
    The U.S. PopulationU.S. population is fastest growing of all industrial nations U.S. fertility rate is only ~2.0, actually below RLF However, immigration is adding people rapidly
  • 72.
    U.S. Population GrowthU. S. over-consumes and over-pollutes U.S. citizen uses 6X energy of average world citizen 4.7% of world population 22% of carbon dioxide and CFC emissions
  • 73.