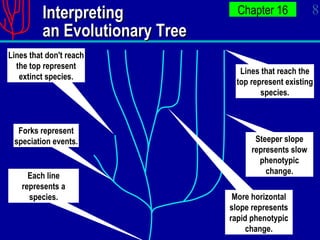
The document discusses several key aspects of speciation and taxonomy:
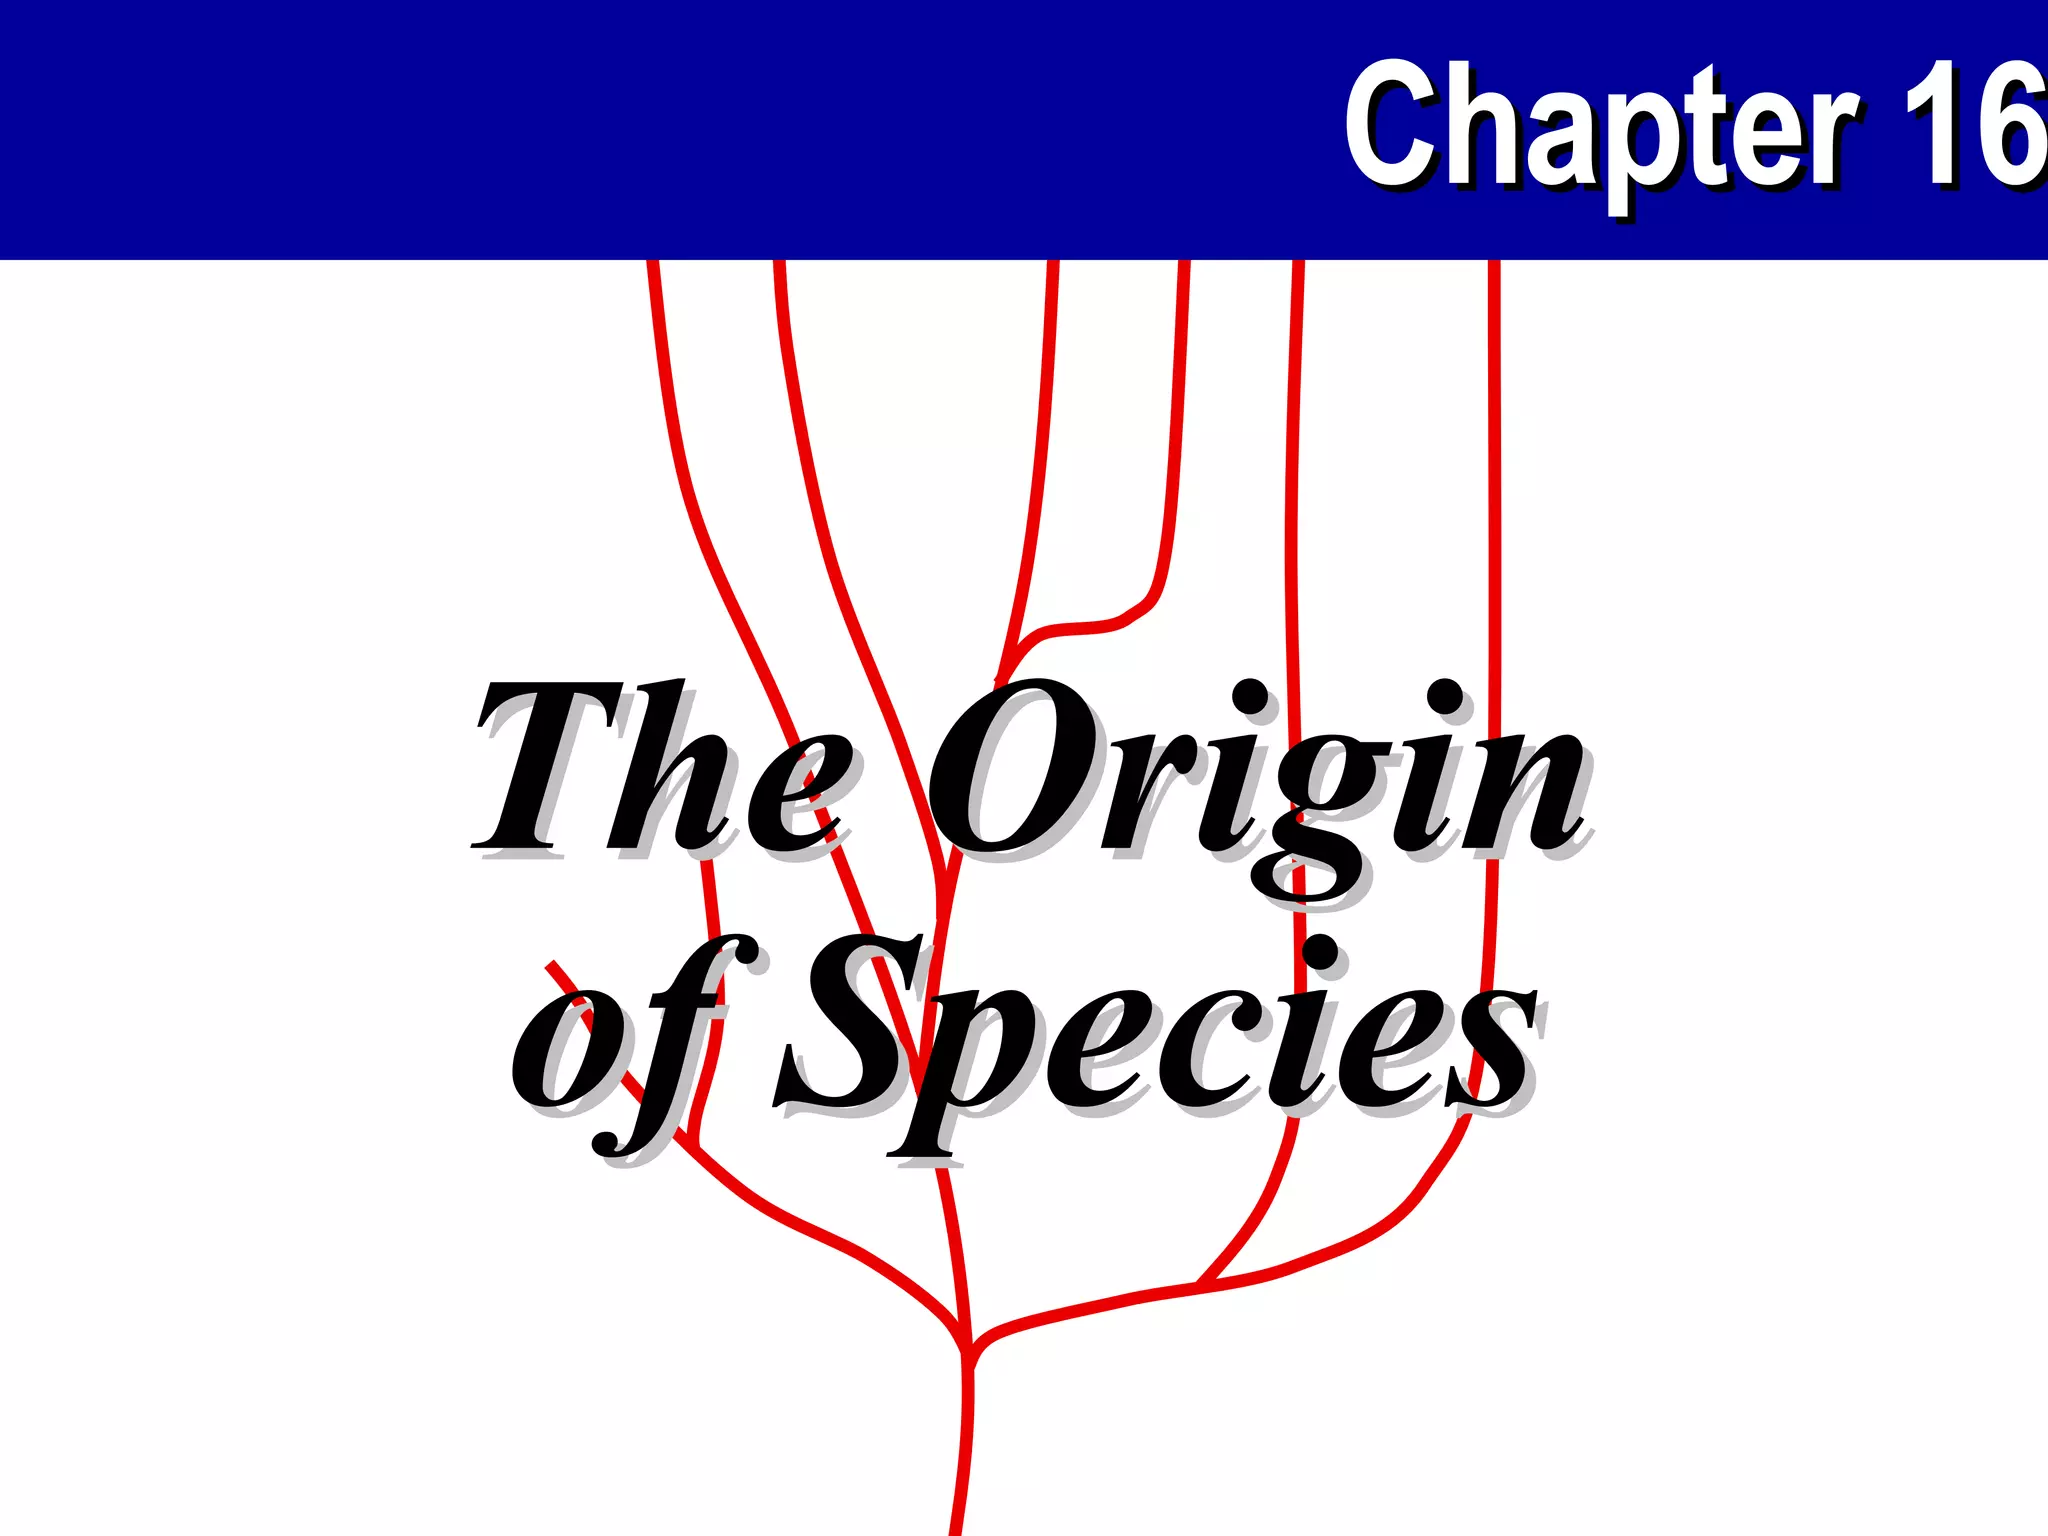
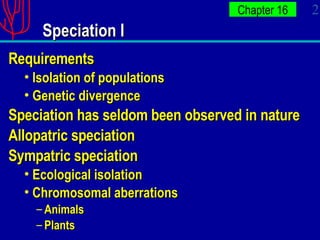
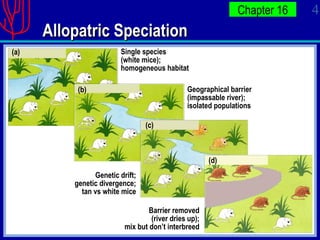
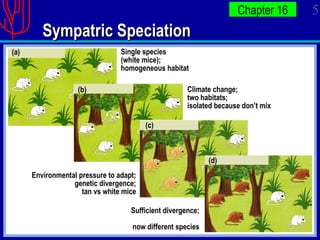
1) Speciation requires isolation of populations which then undergo genetic divergence and reproductive isolation. The main types of speciation discussed are allopatric and sympatric speciation.
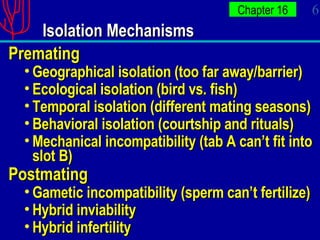
2) Mechanisms of reproductive isolation that can lead to speciation include geographical, ecological, temporal, behavioral, mechanical and gametic isolation.
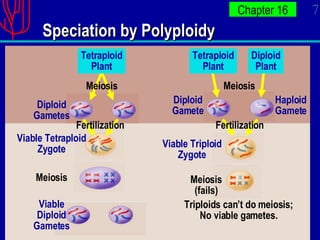
3) Polyploidy, where organisms have more than two paired sets of chromosomes, is another path to speciation discussed.
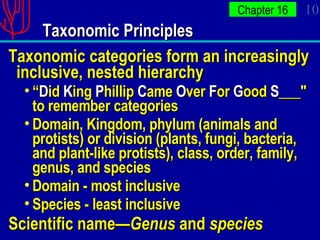
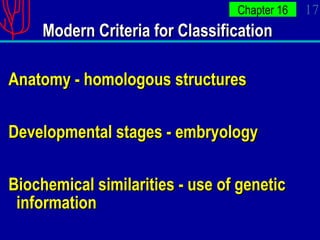
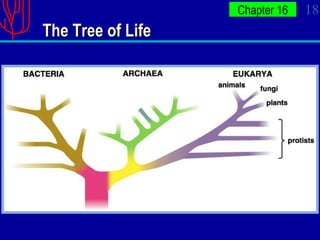
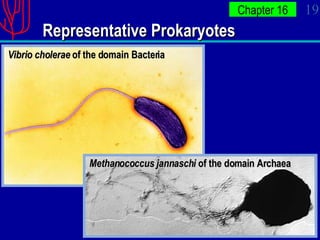
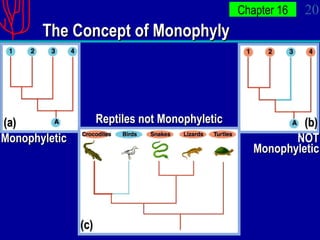
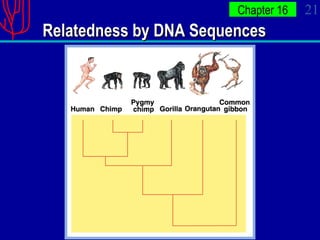
4) The document outlines the history of taxonomy from Aristotle to the current three domain system recognizing bacteria, archaea and eukarya based on genetic analysis.


![Biology 16 3 the process of speciation[1]](https://cdn.slidesharecdn.com/ss_thumbnails/biology16-3theprocessofspeciation1-110817154217-phpapp02-thumbnail.jpg?width=640&height=640&fit=bounds)