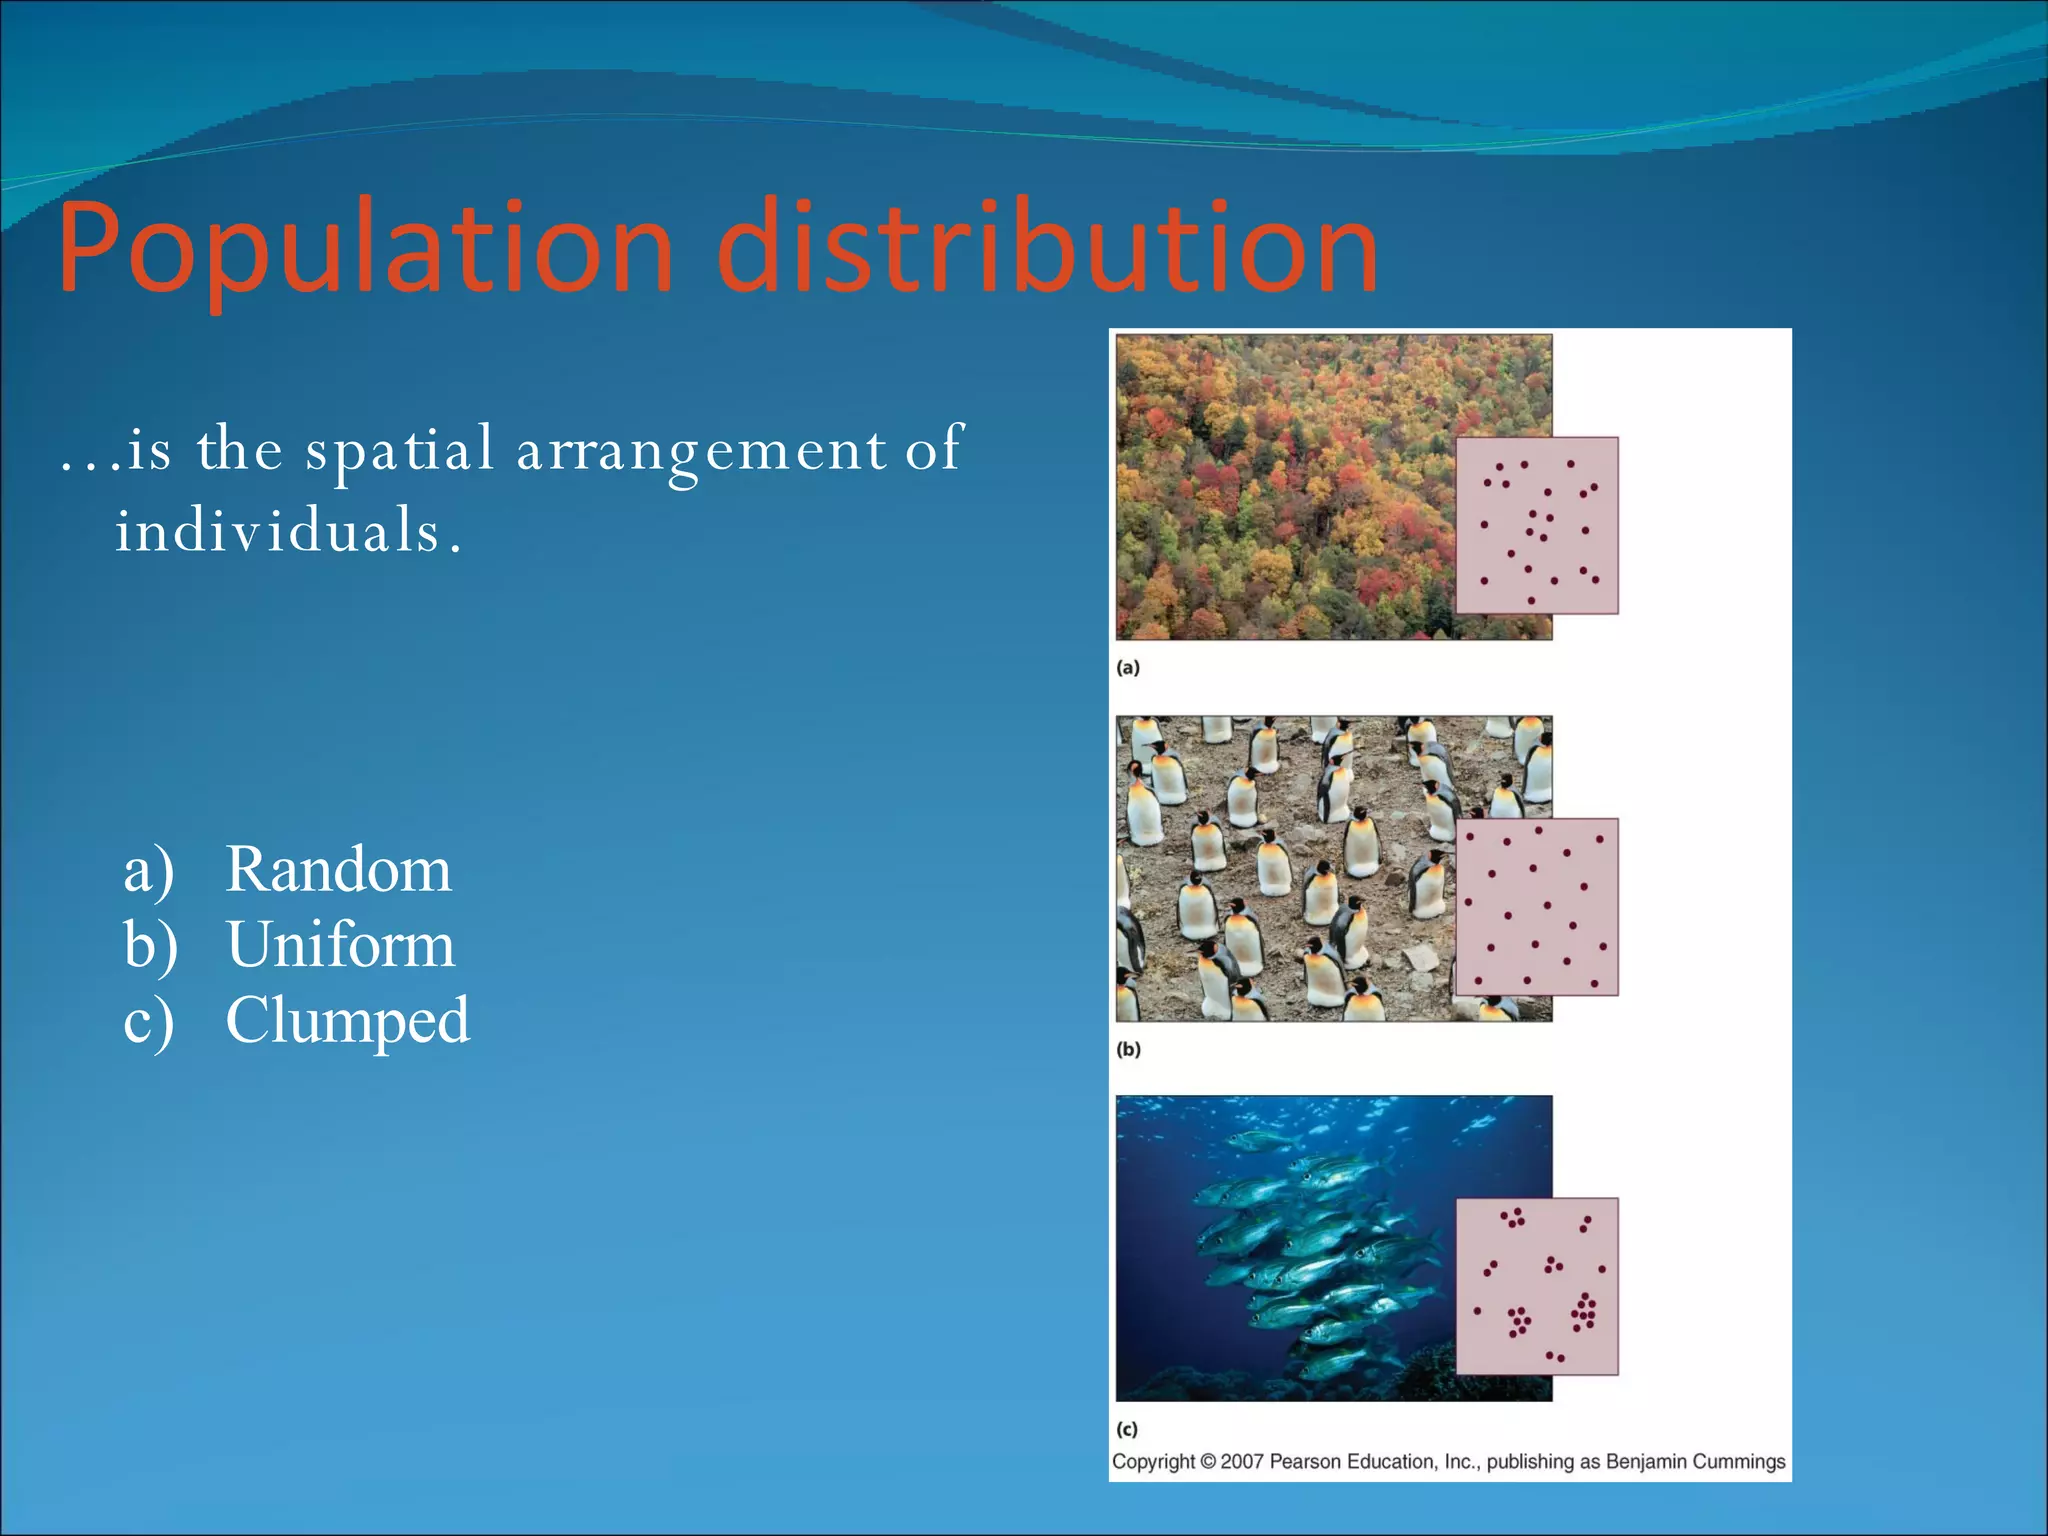
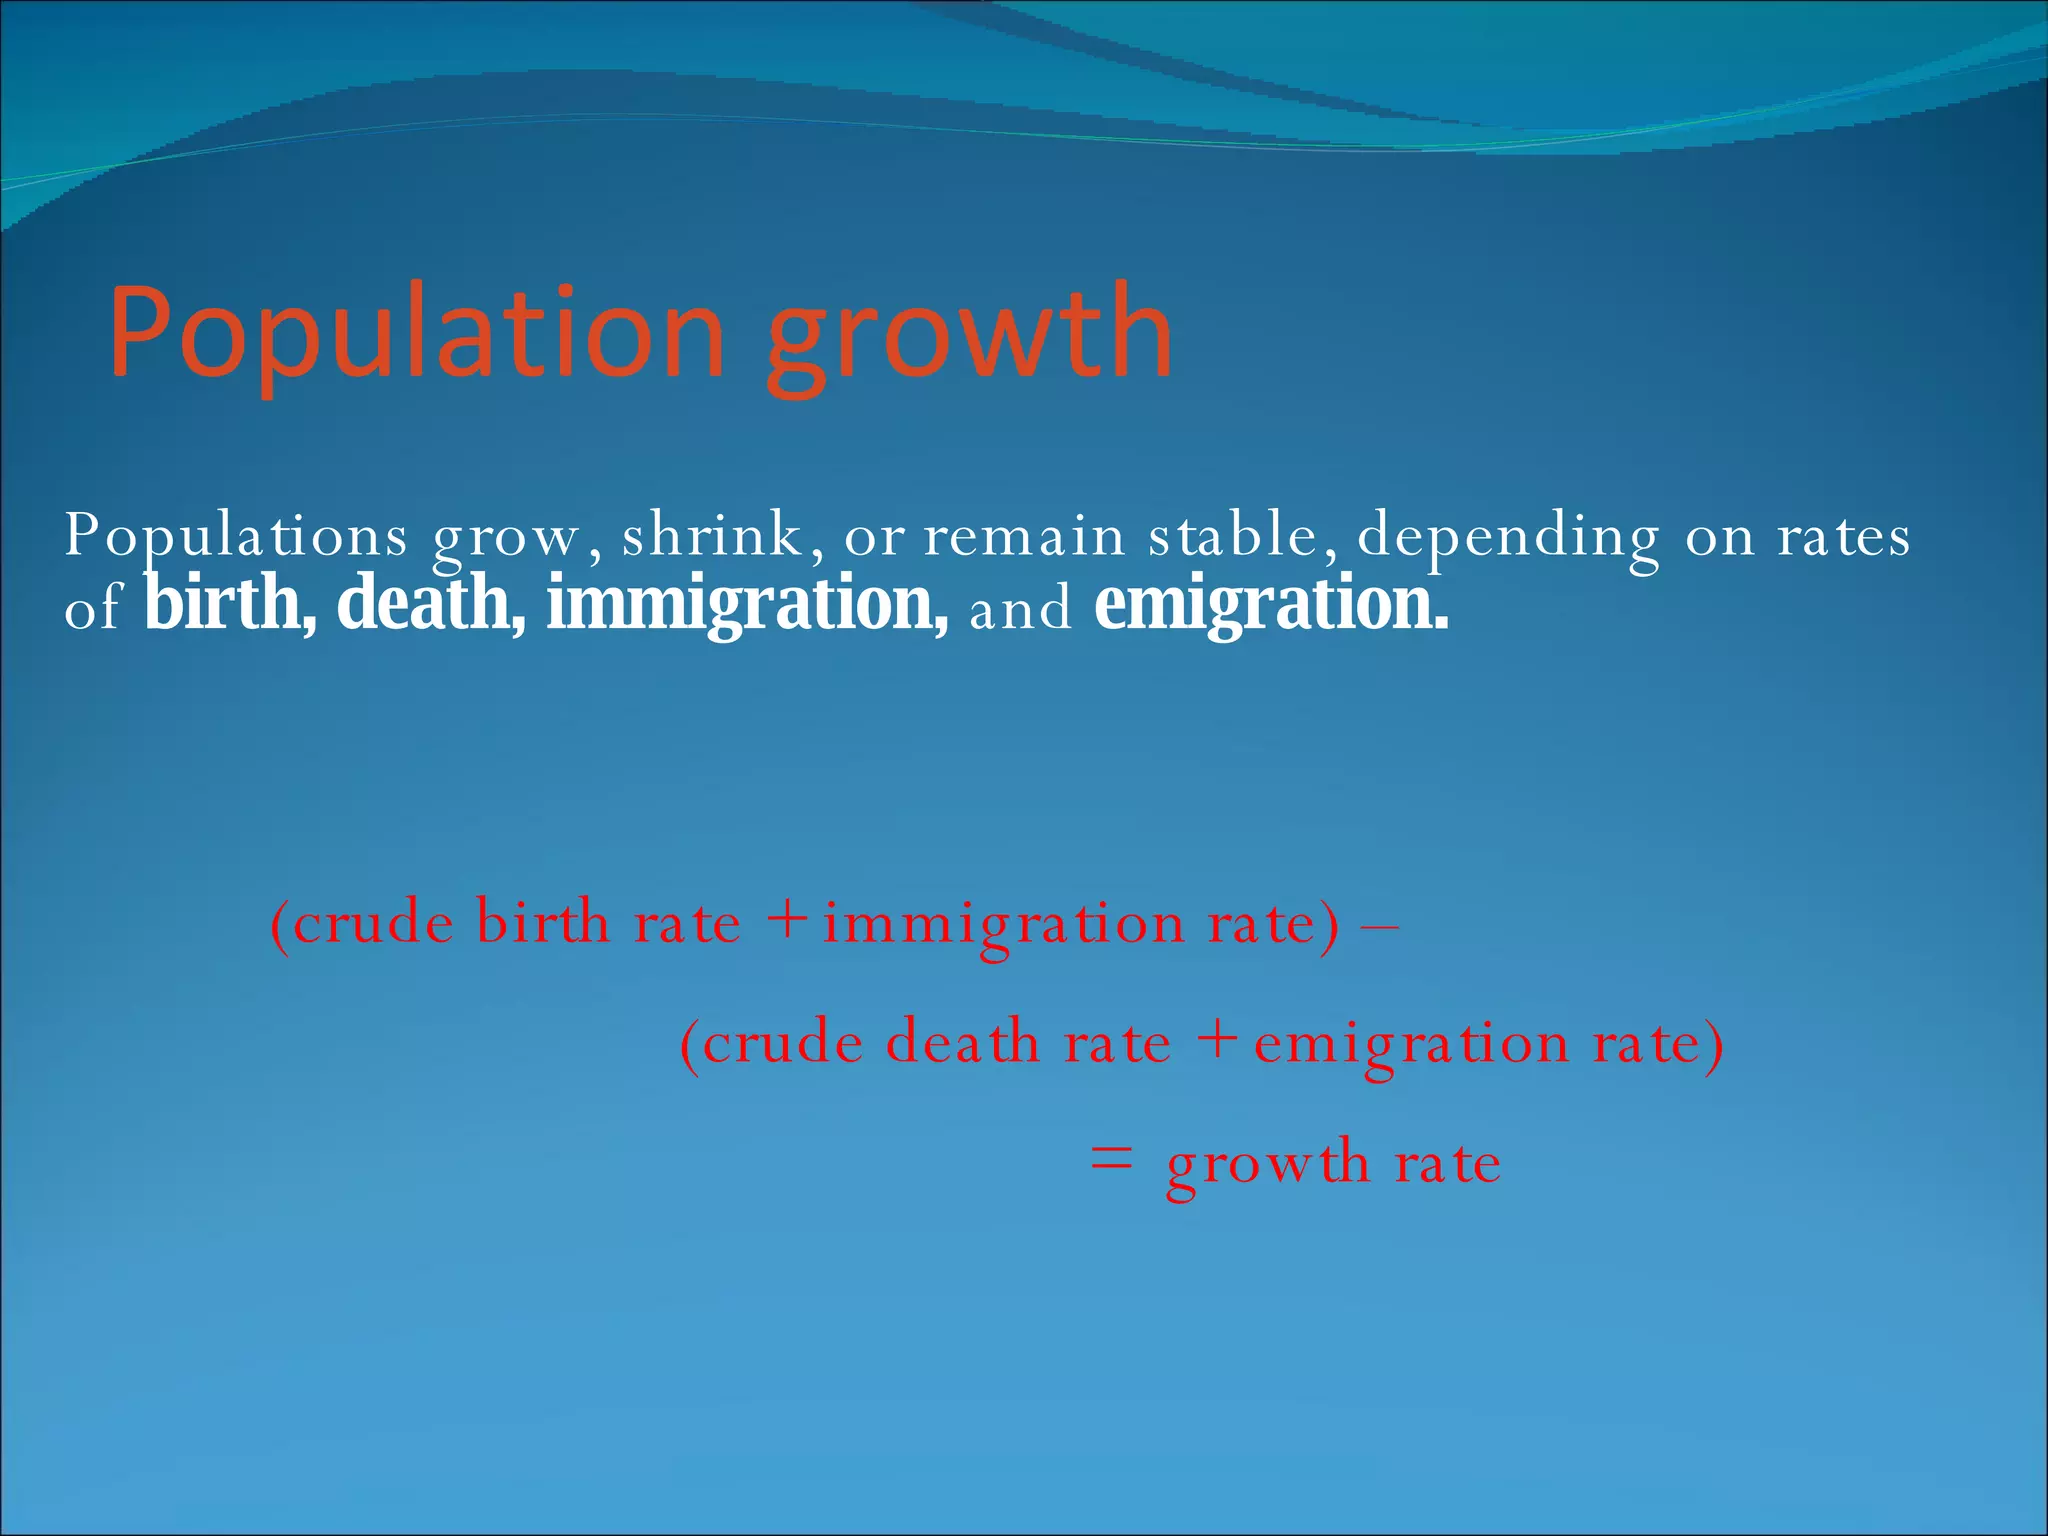
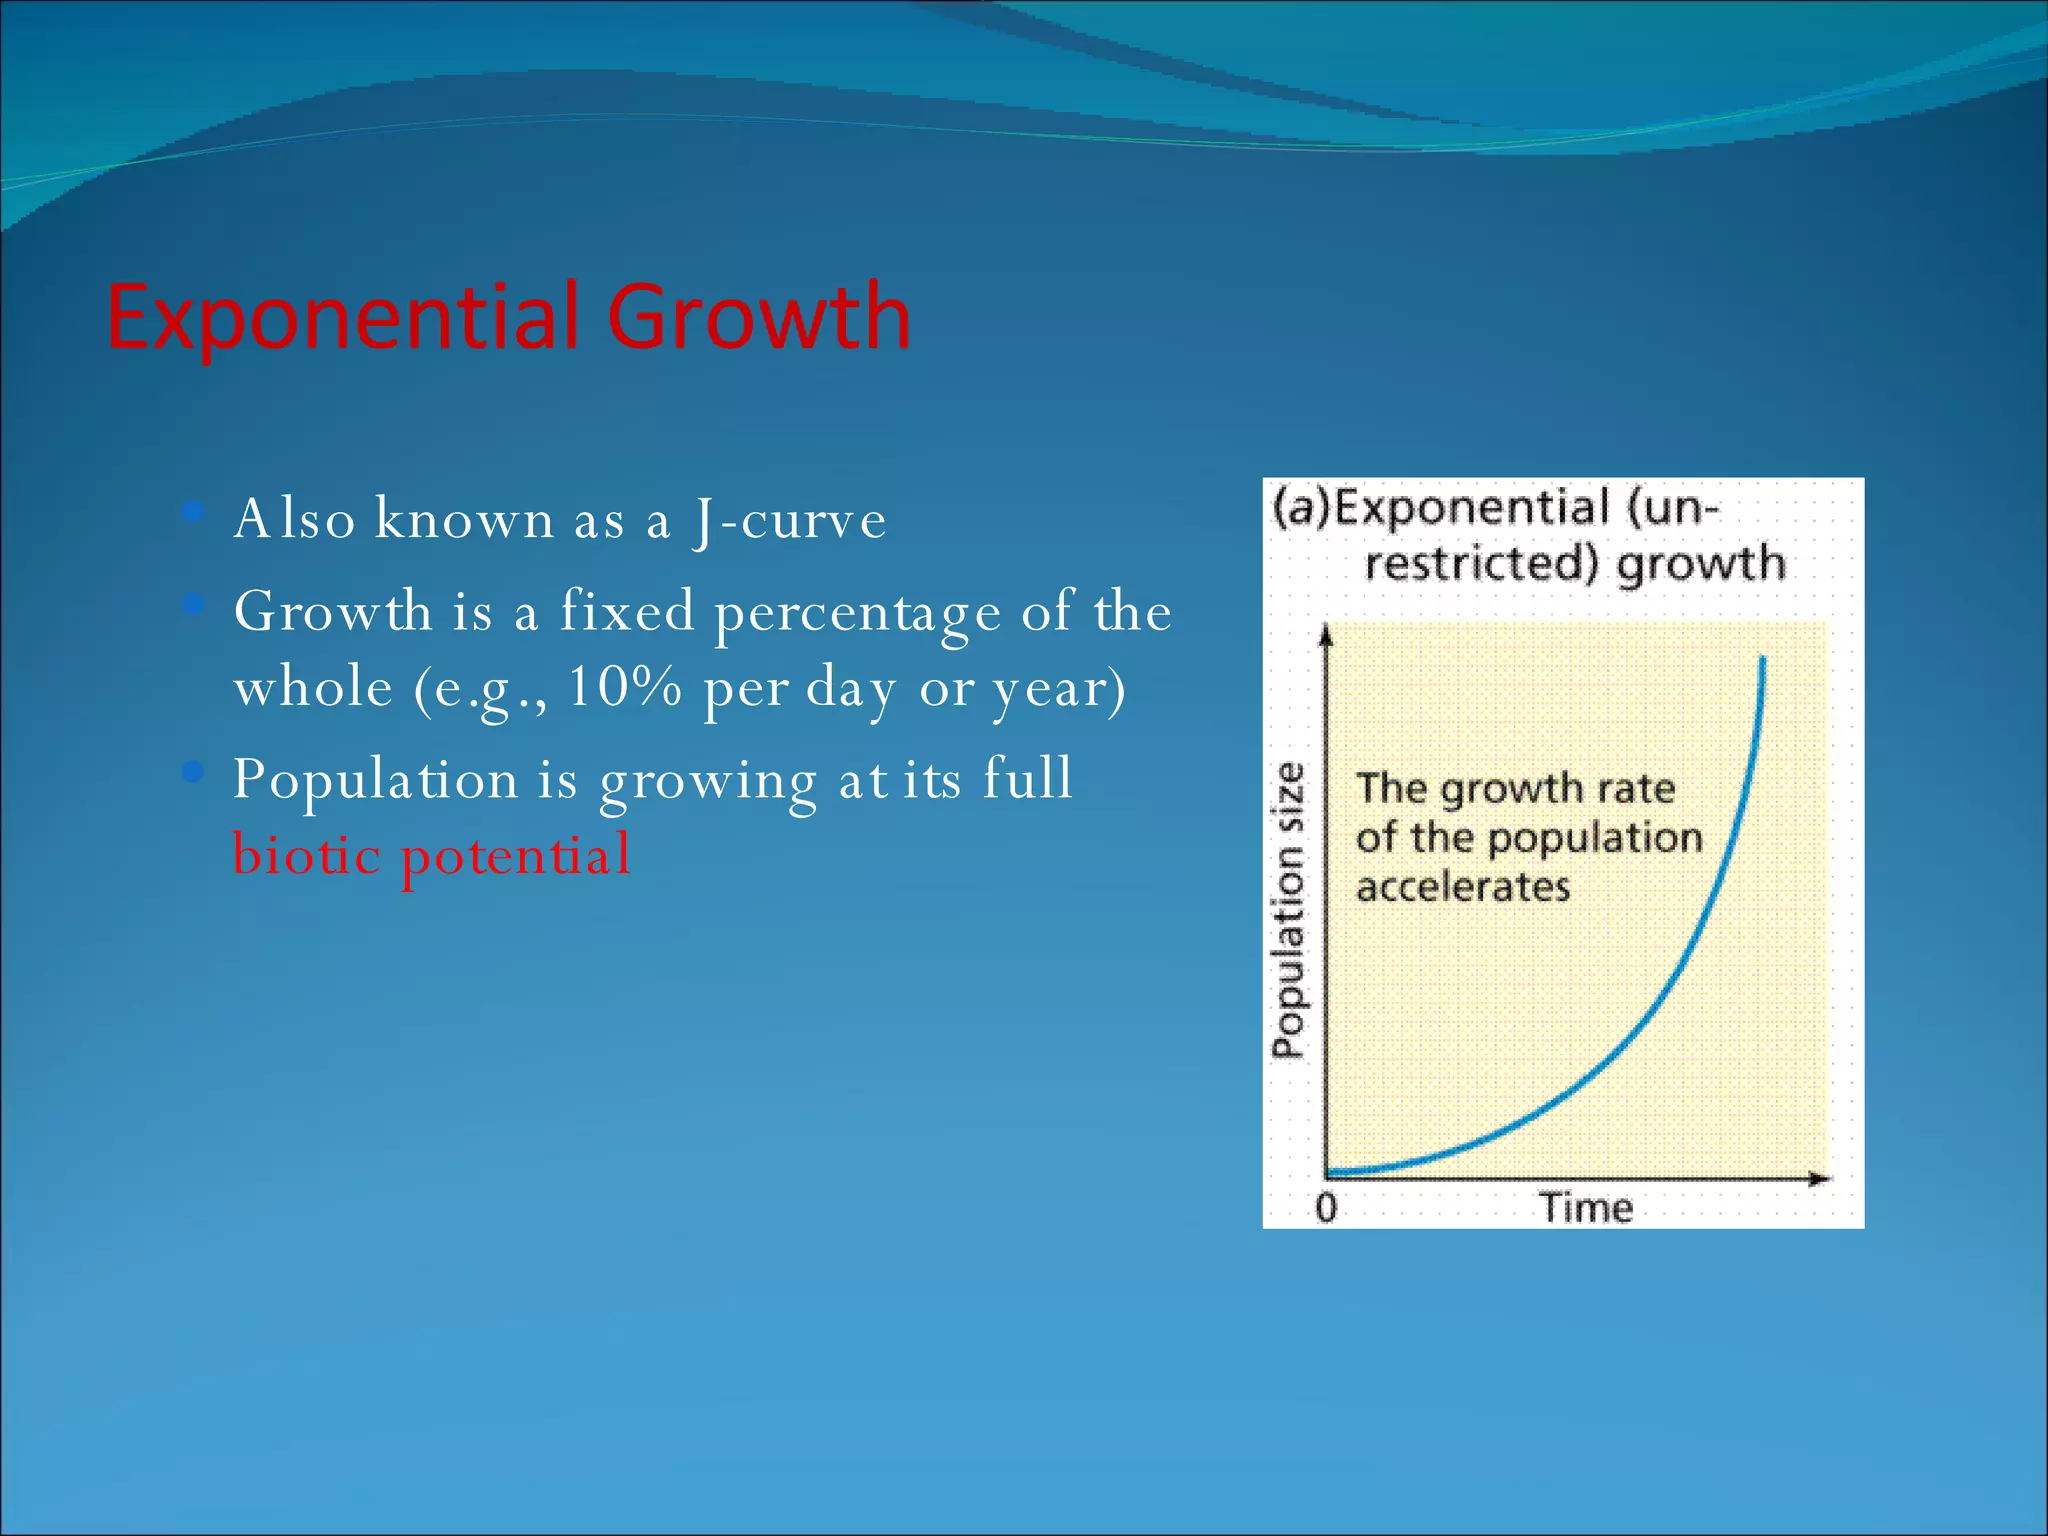
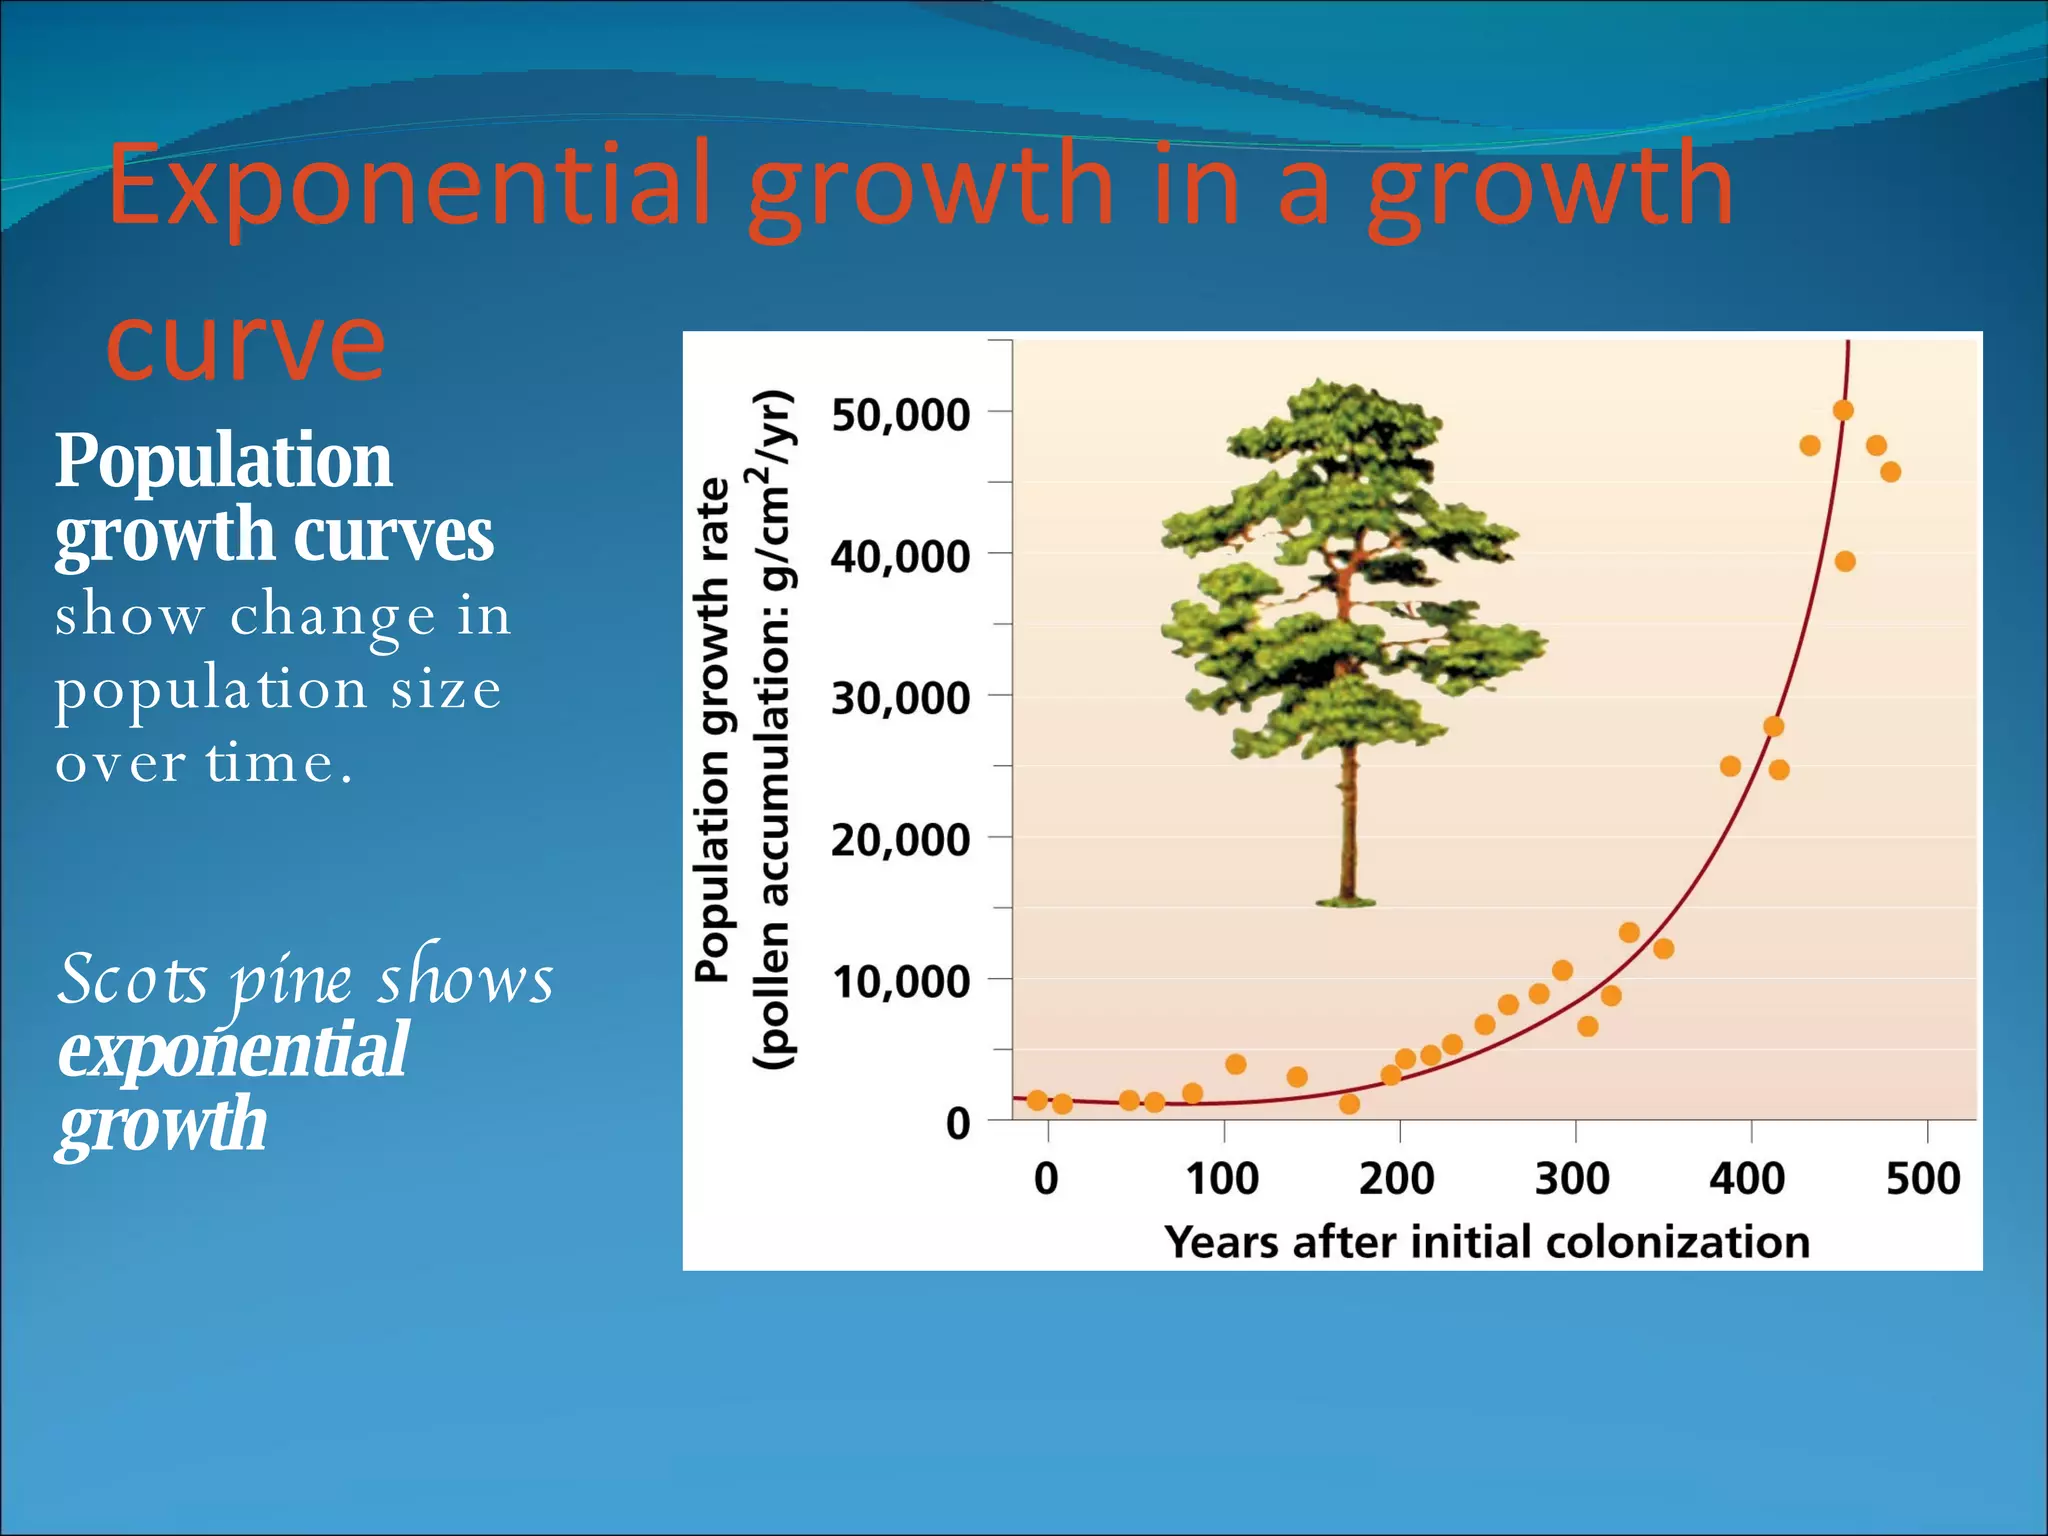
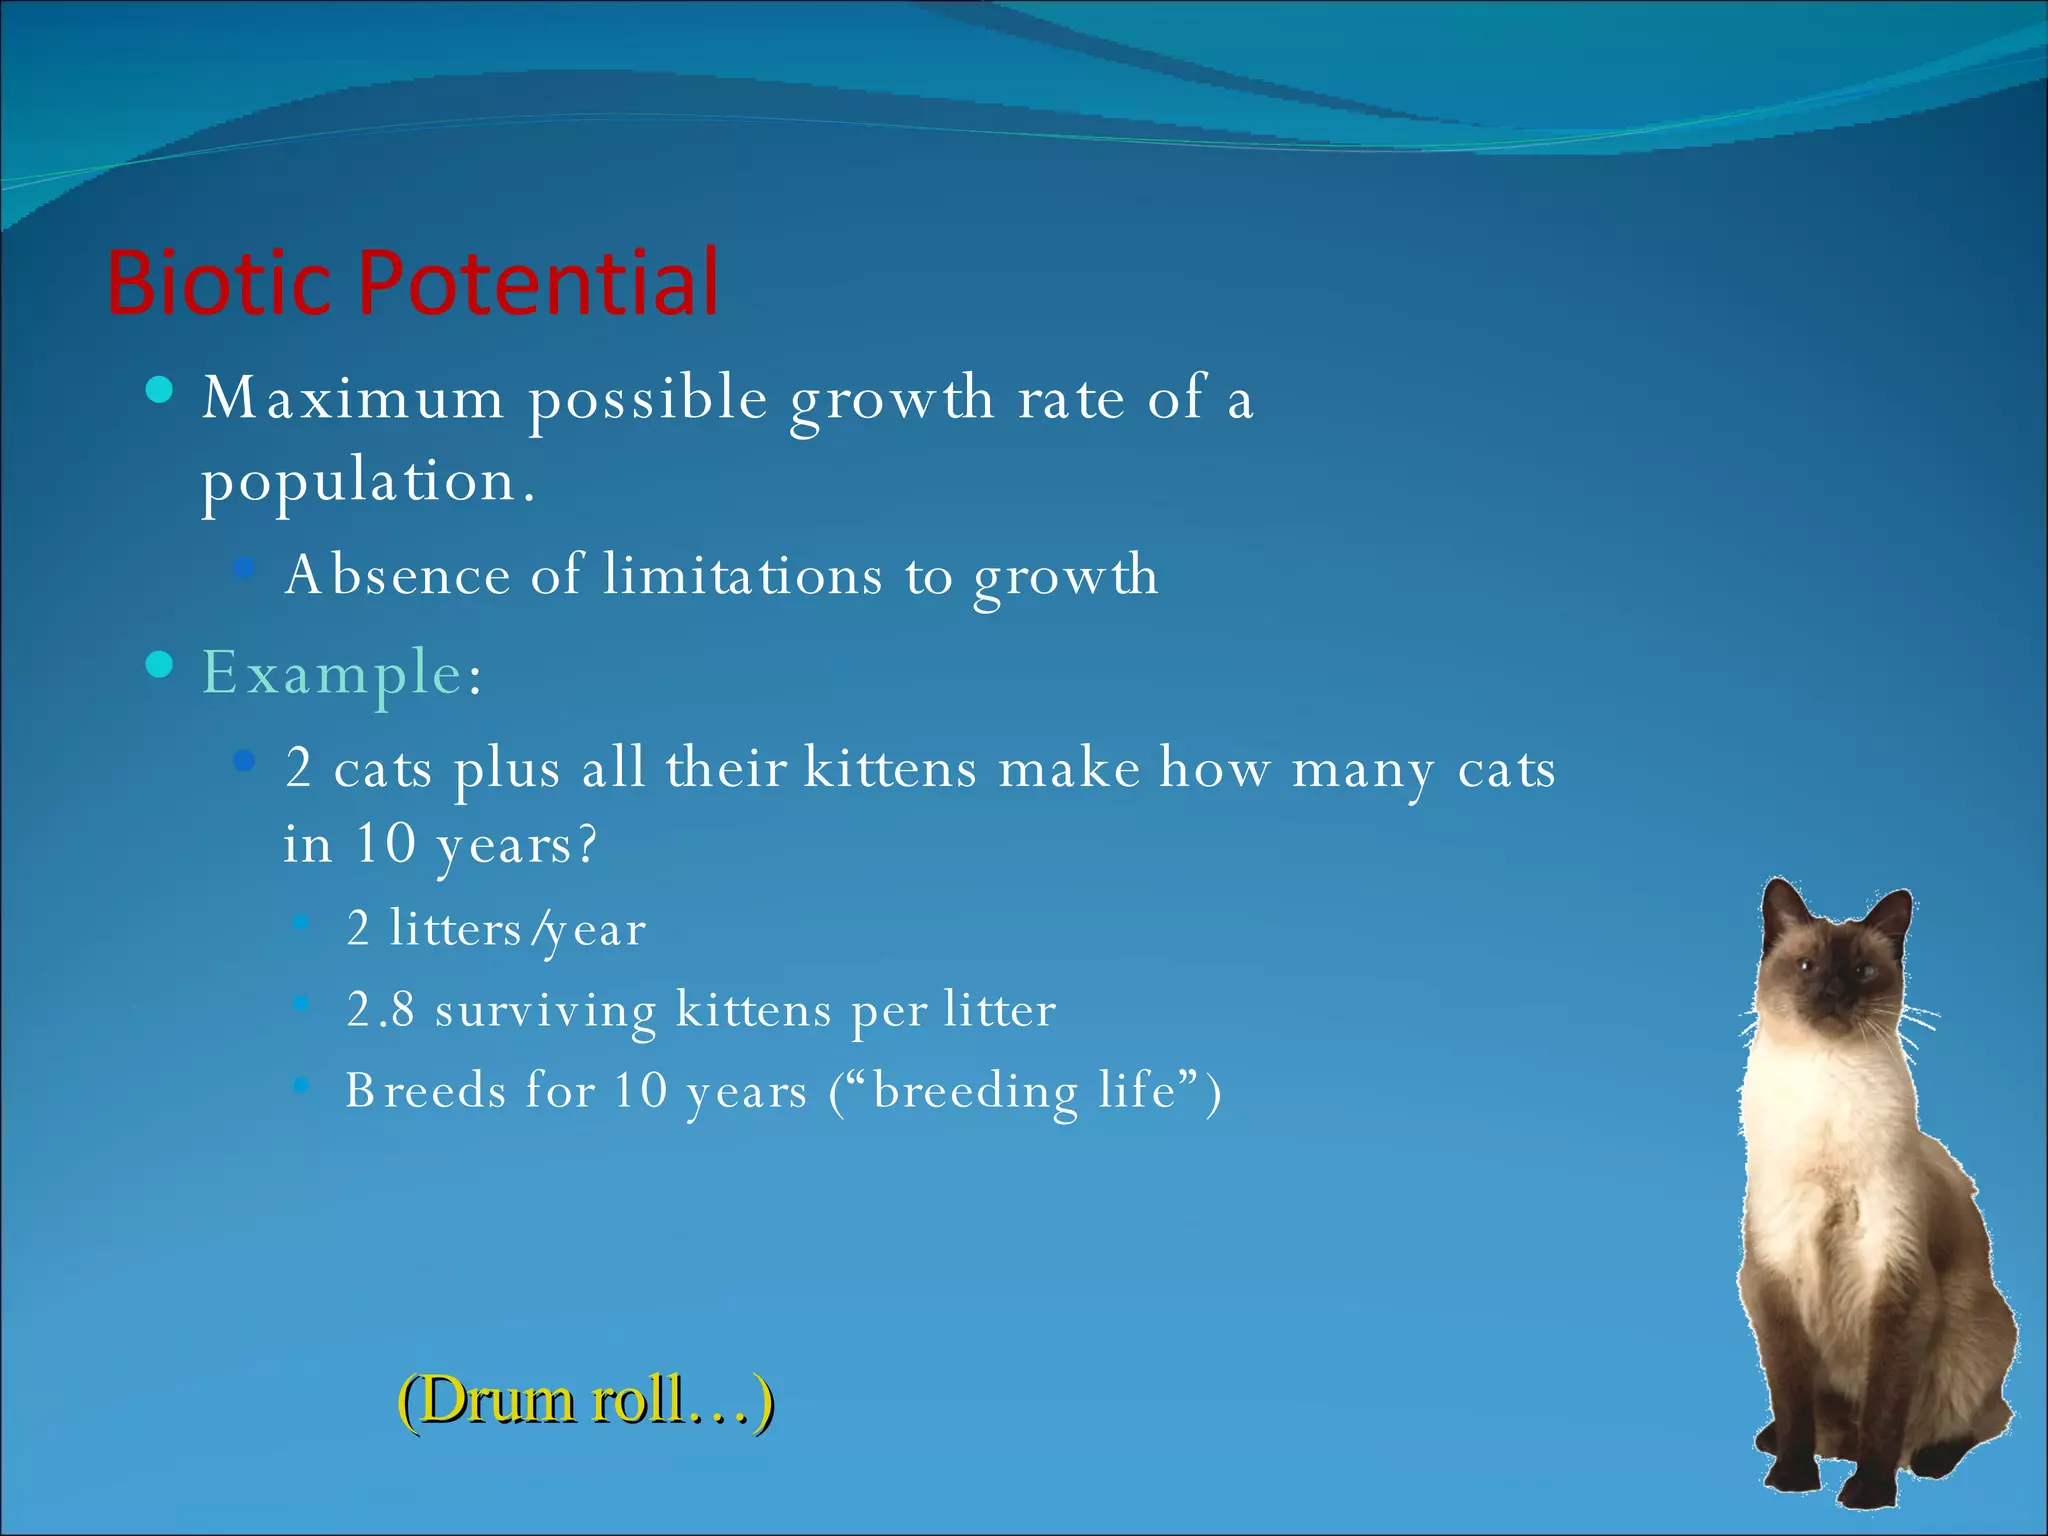
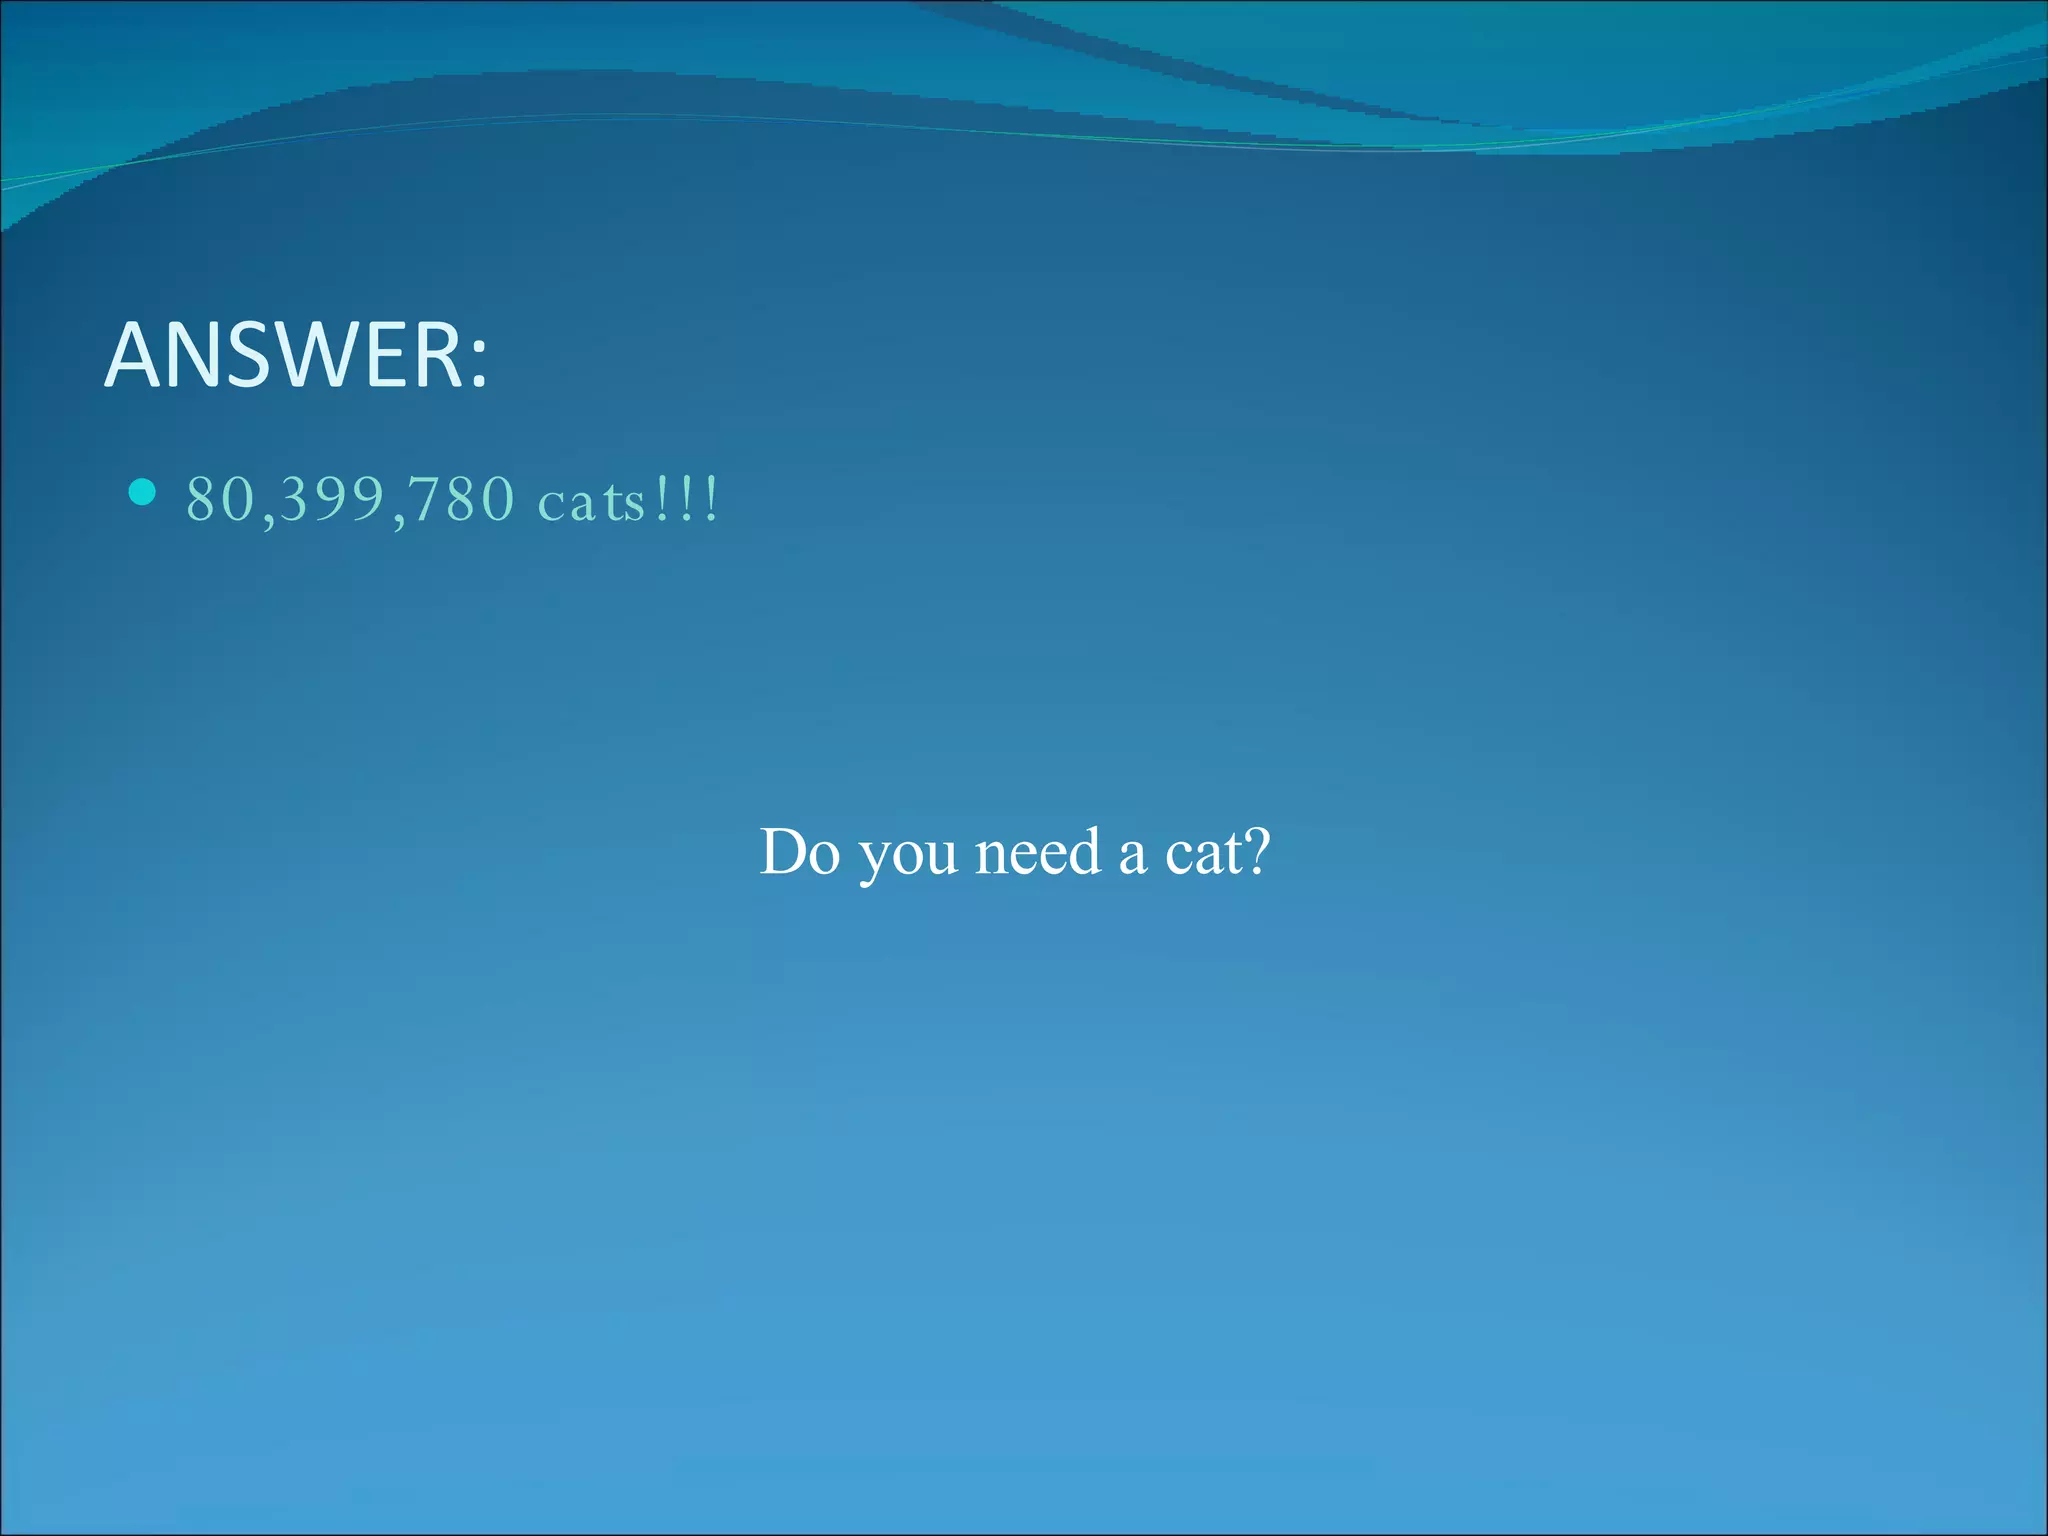
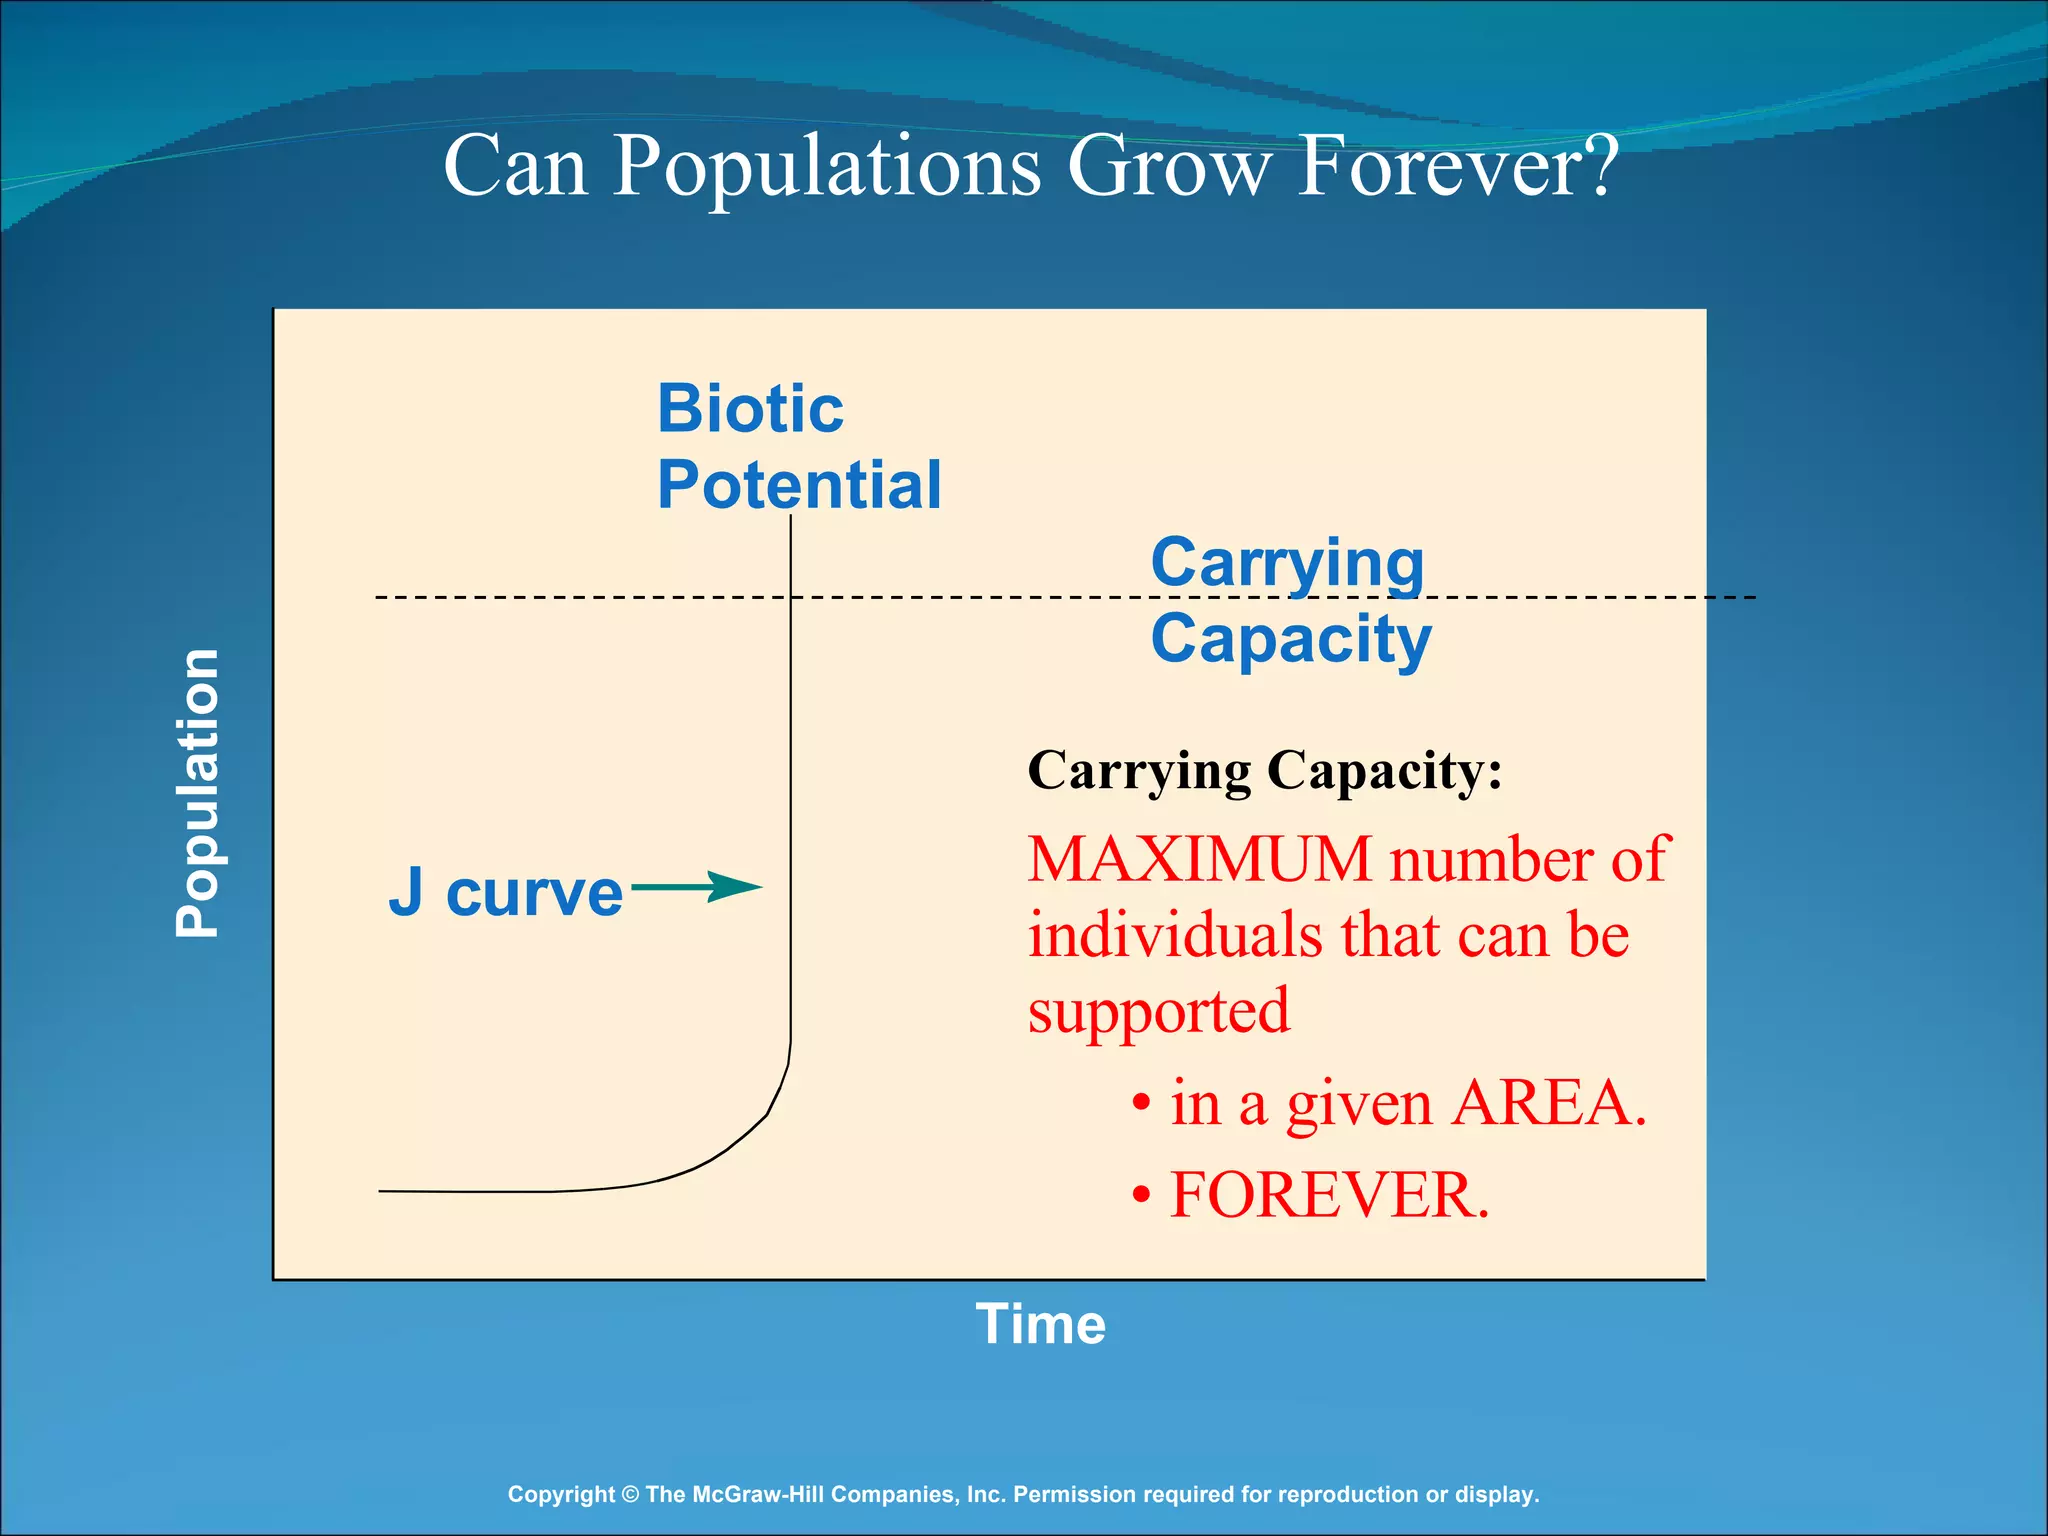
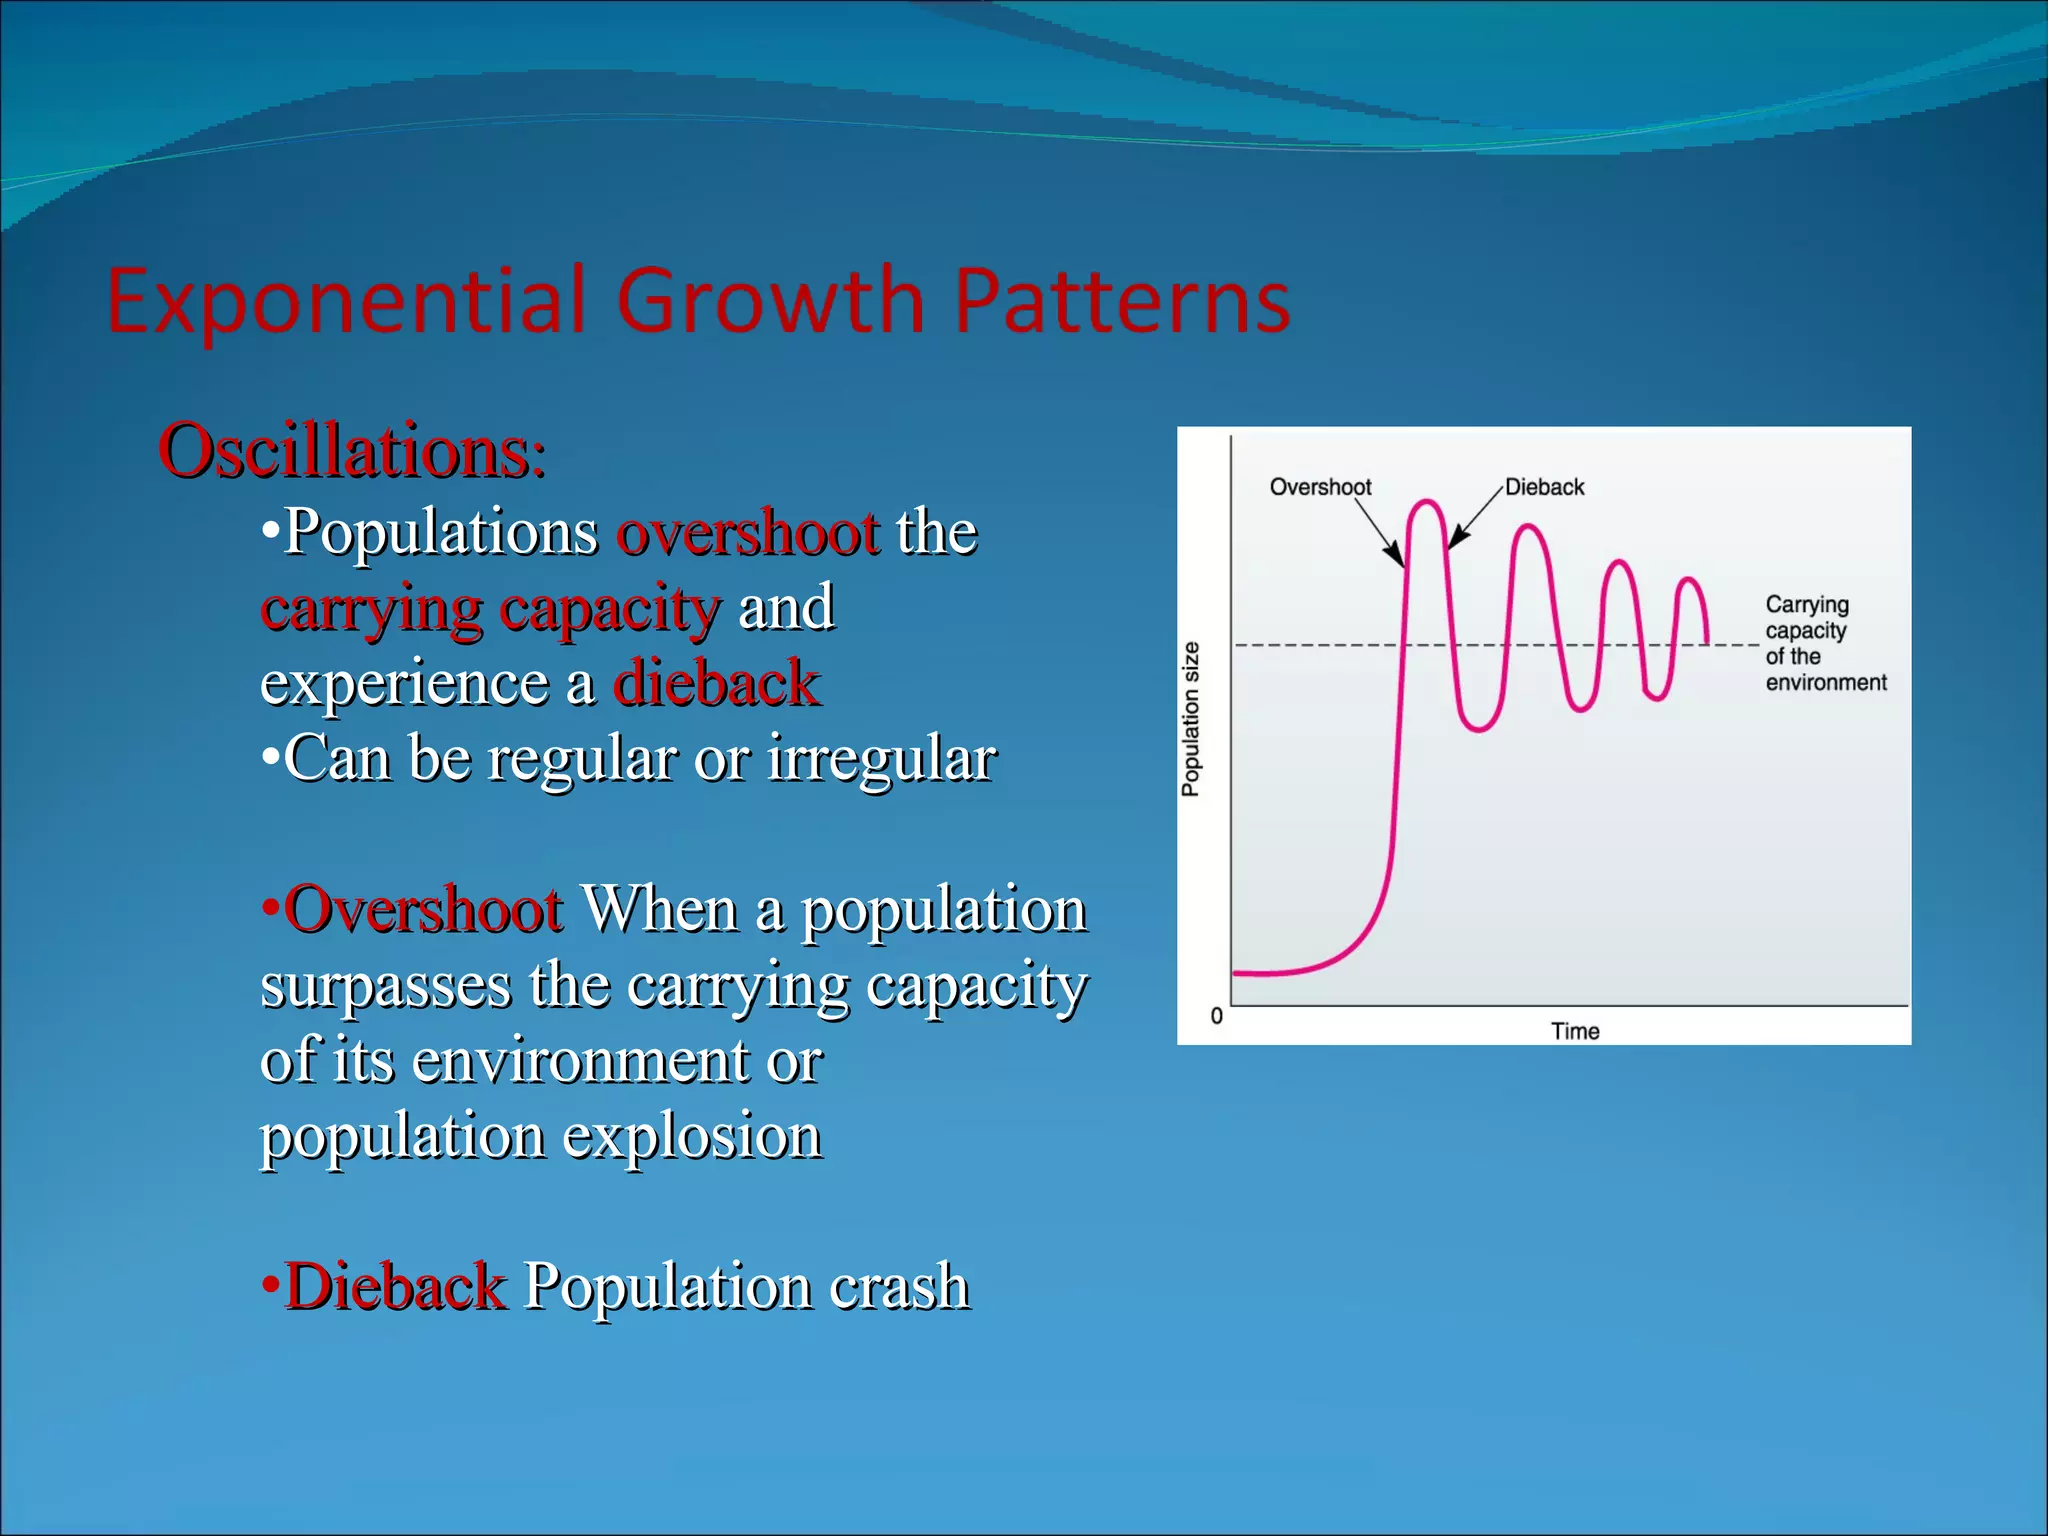
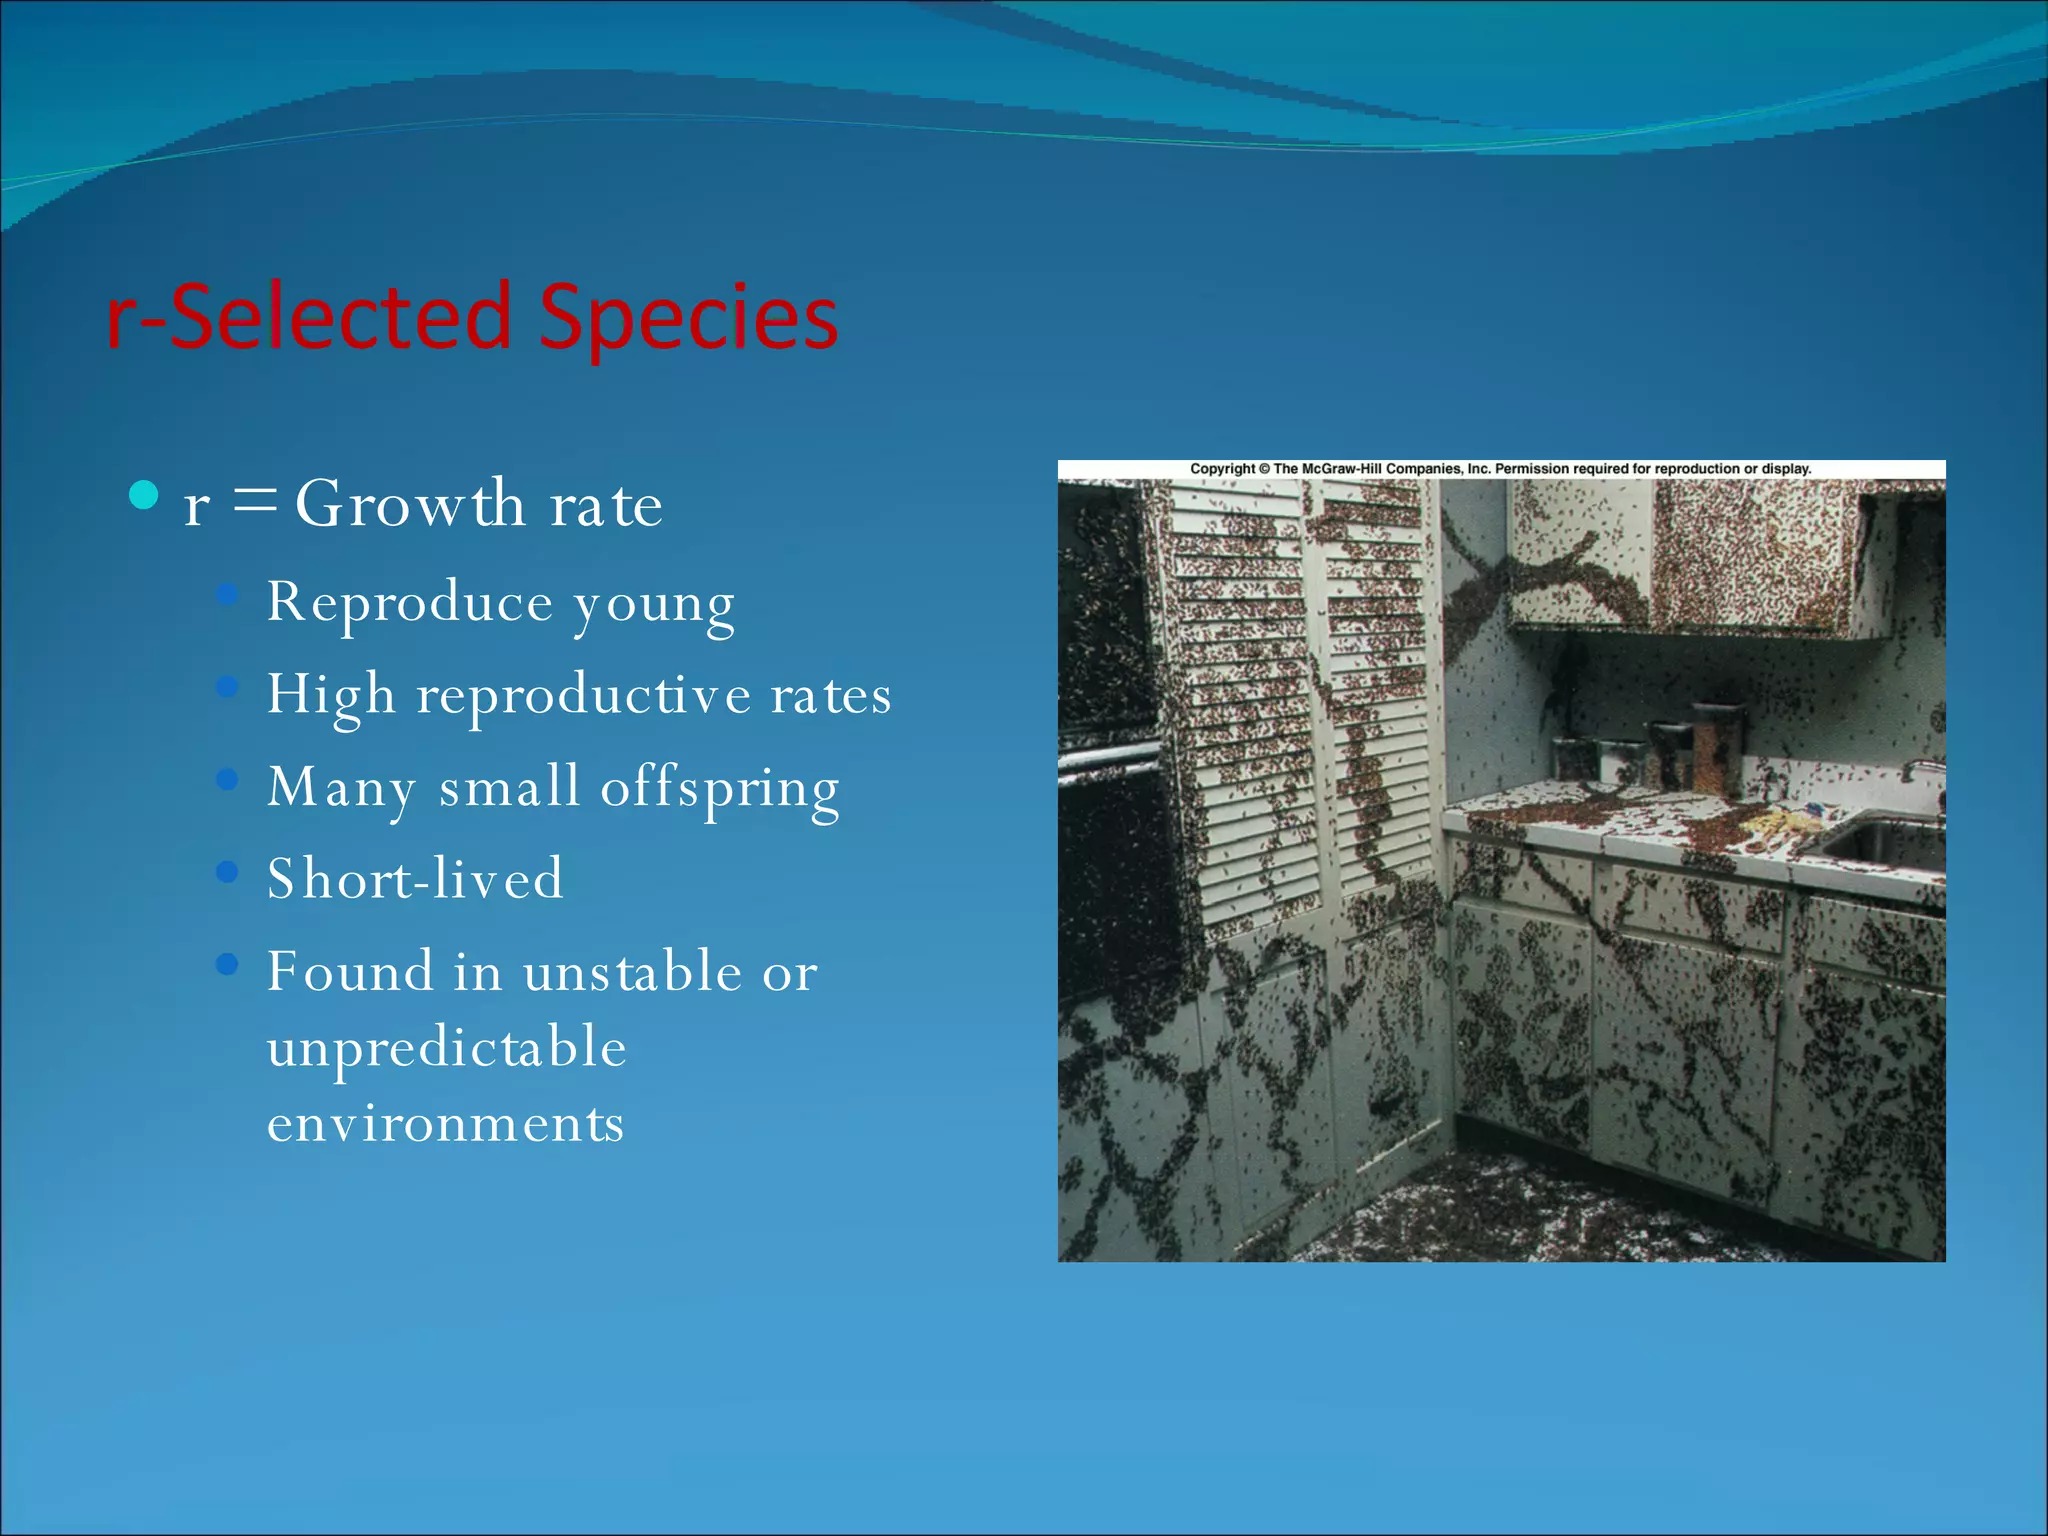
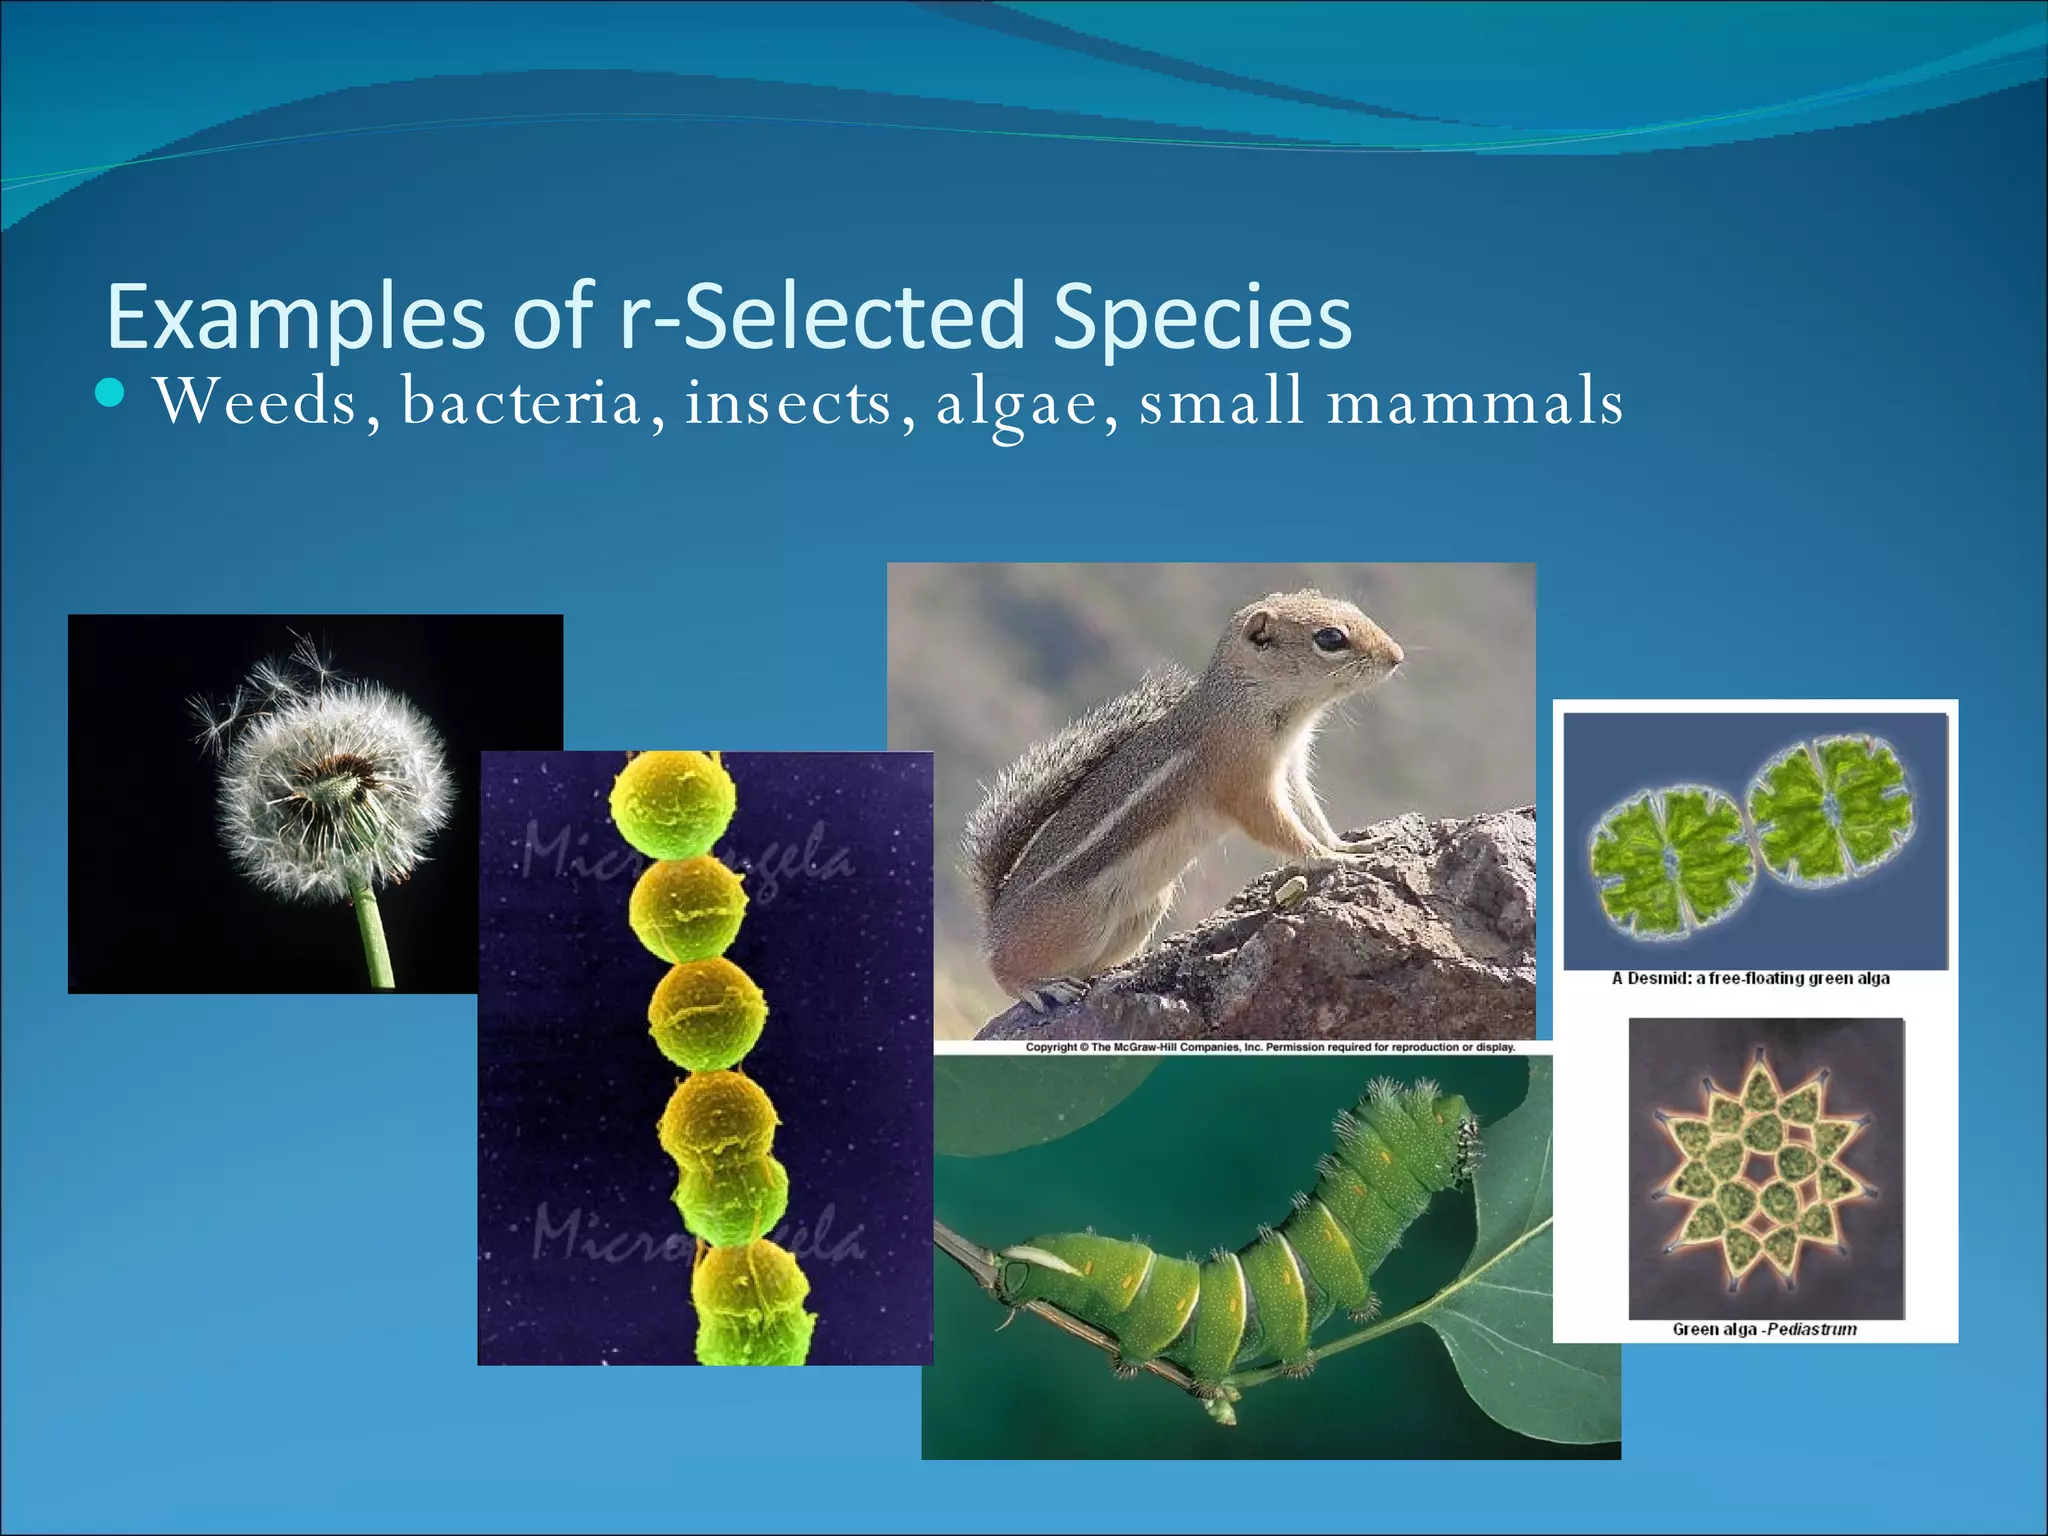
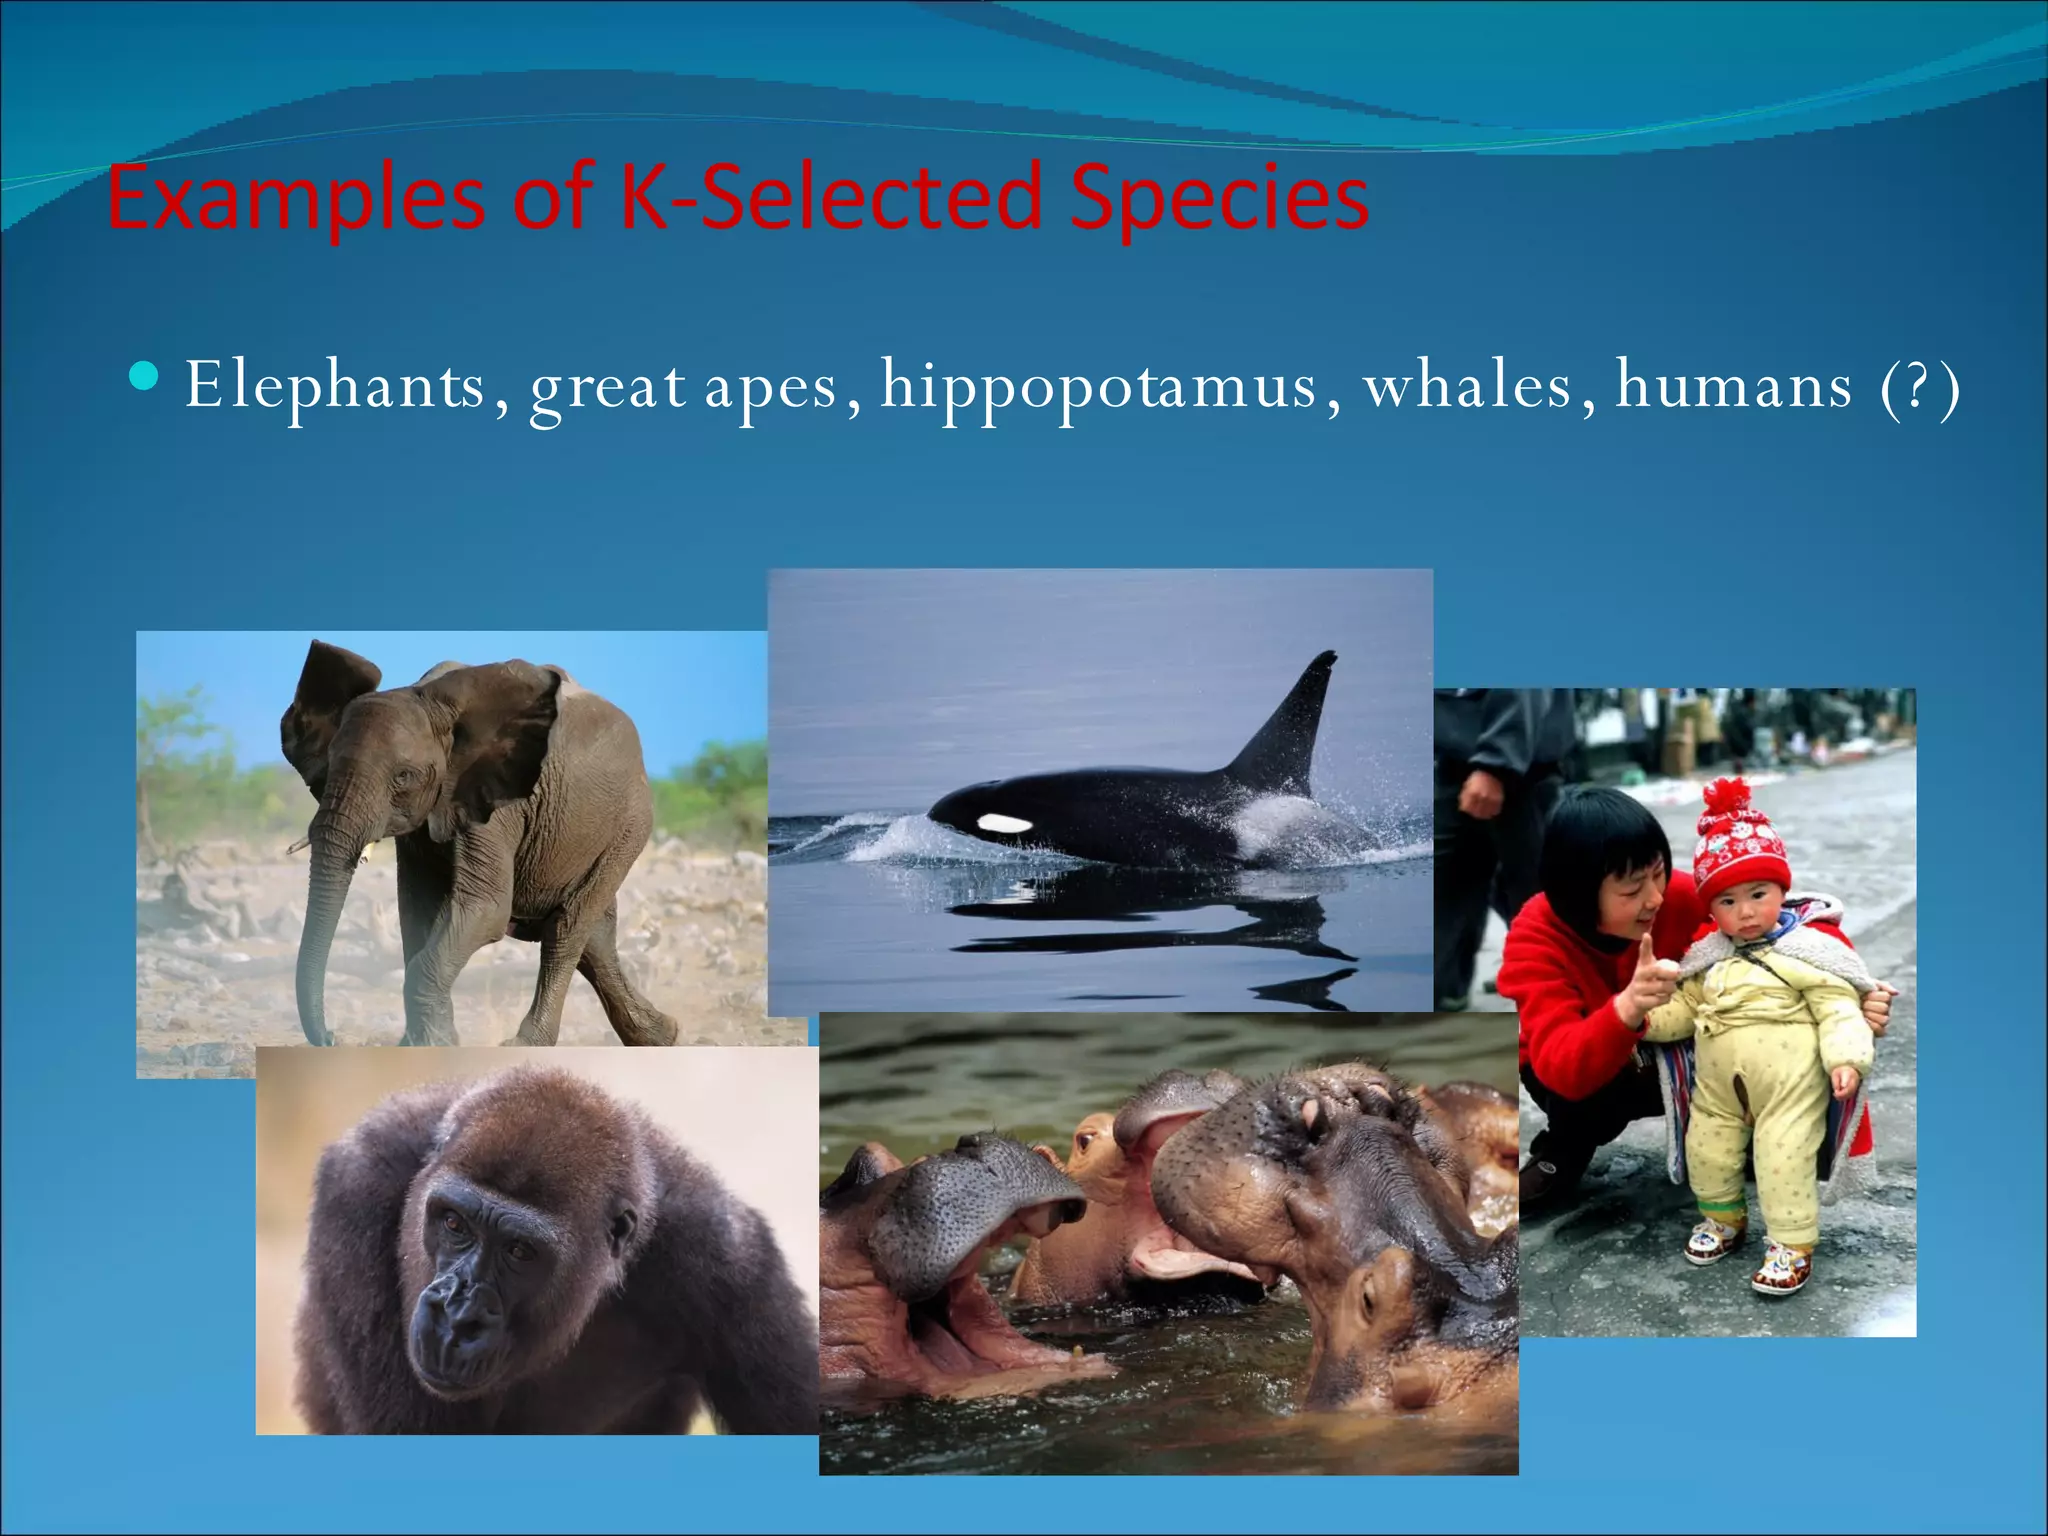
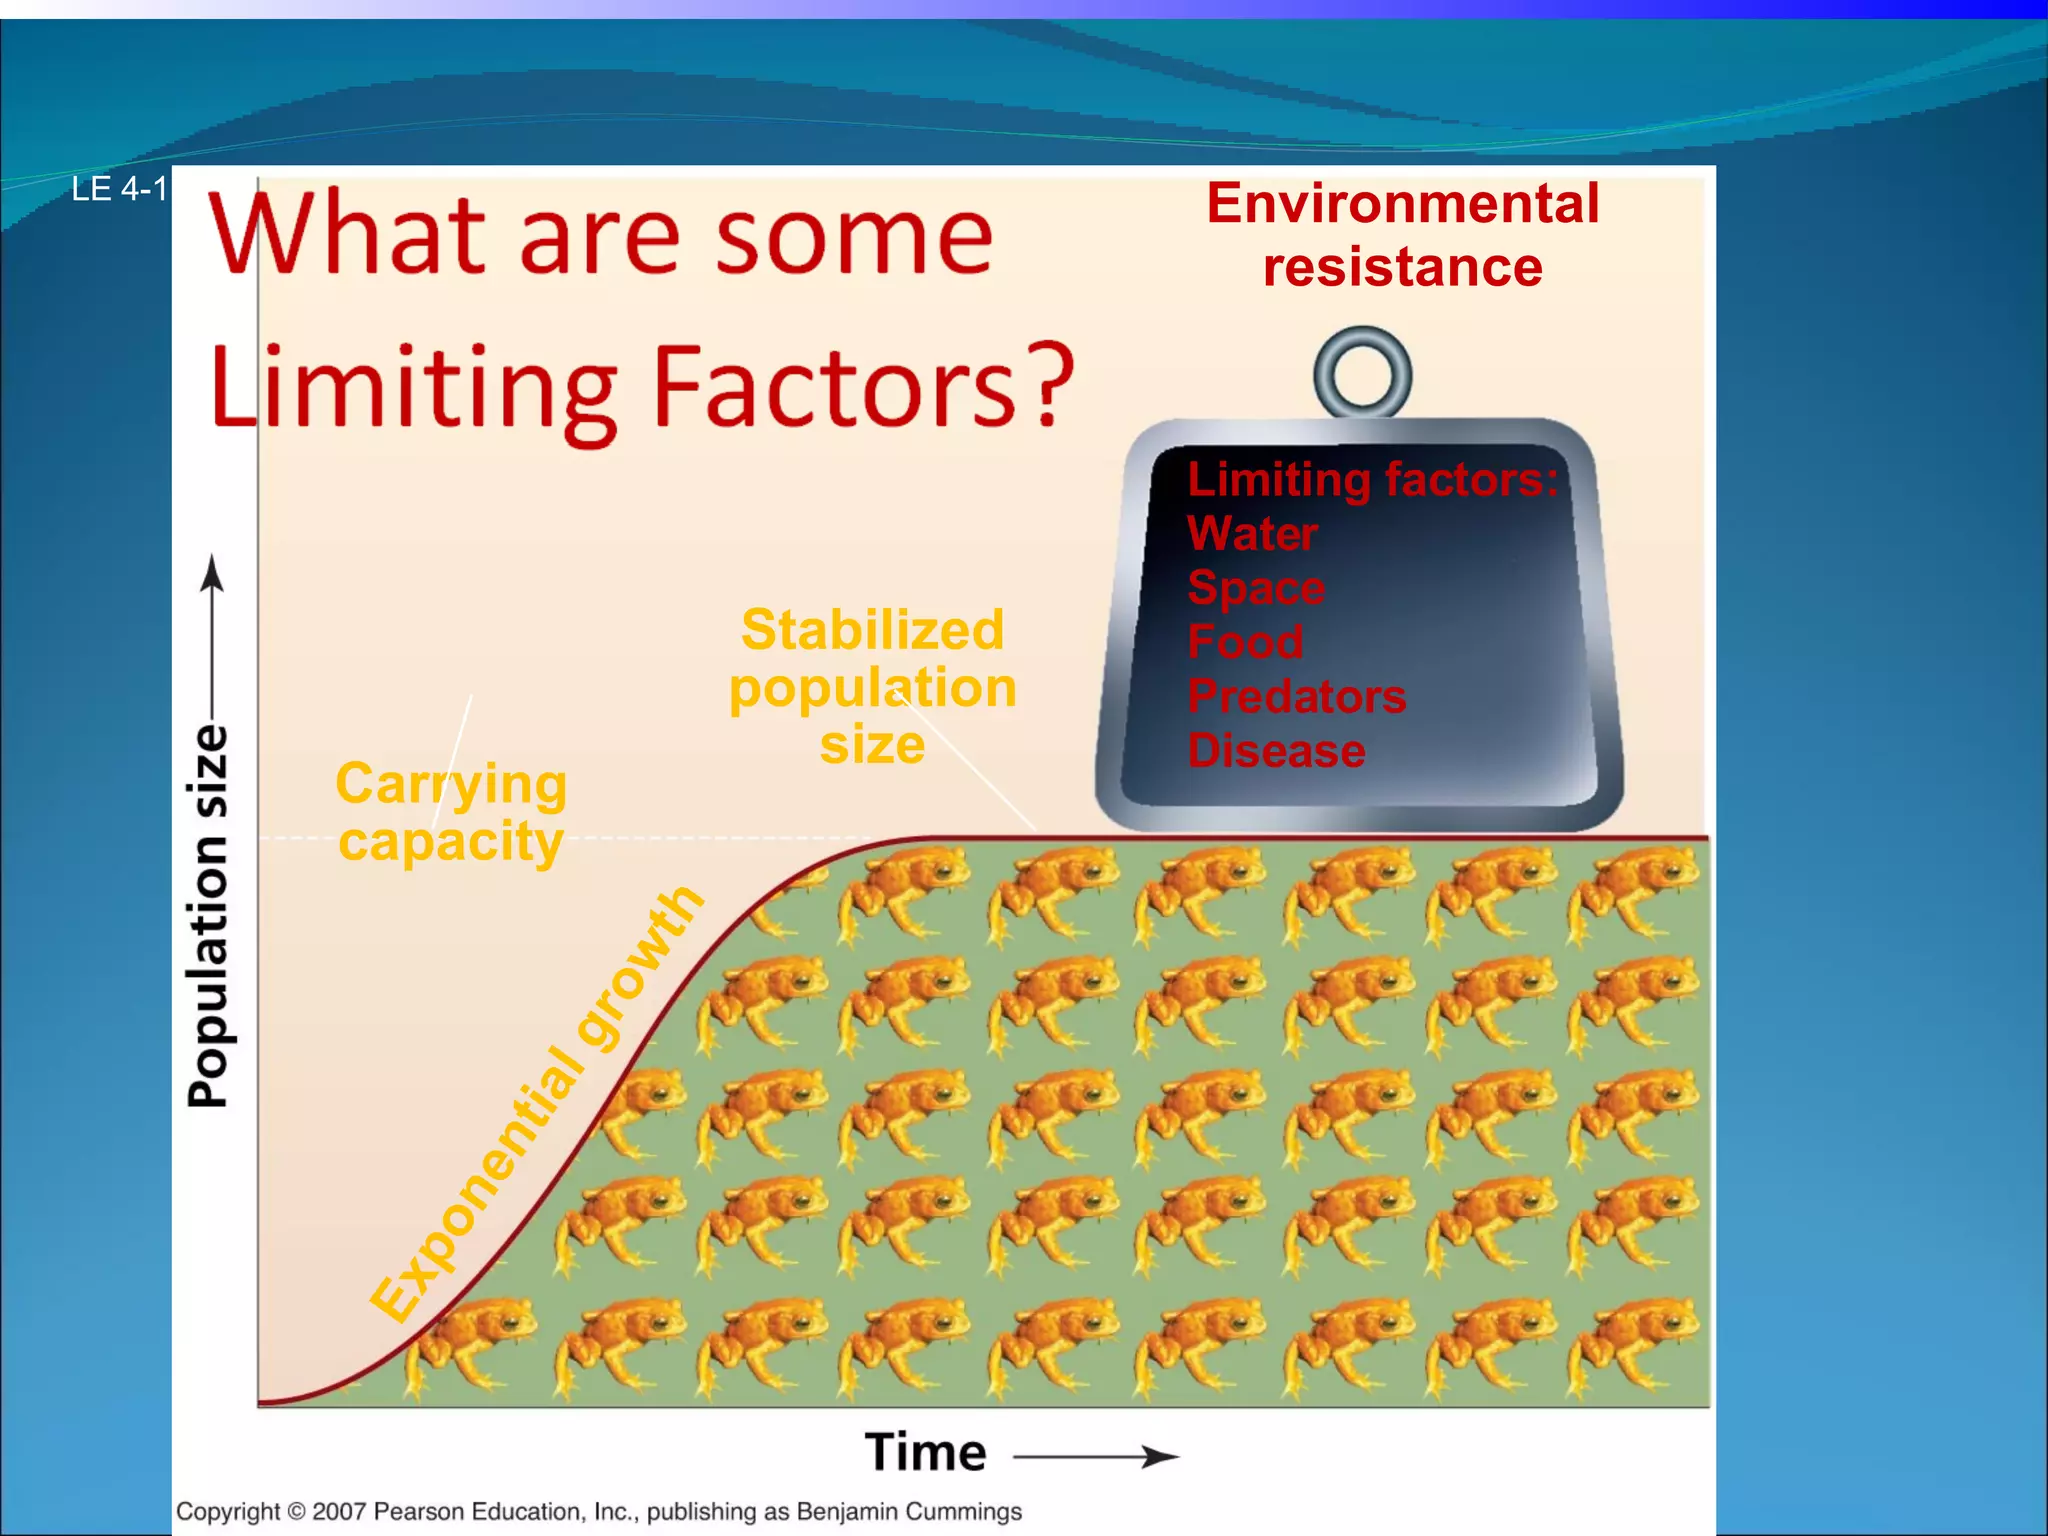
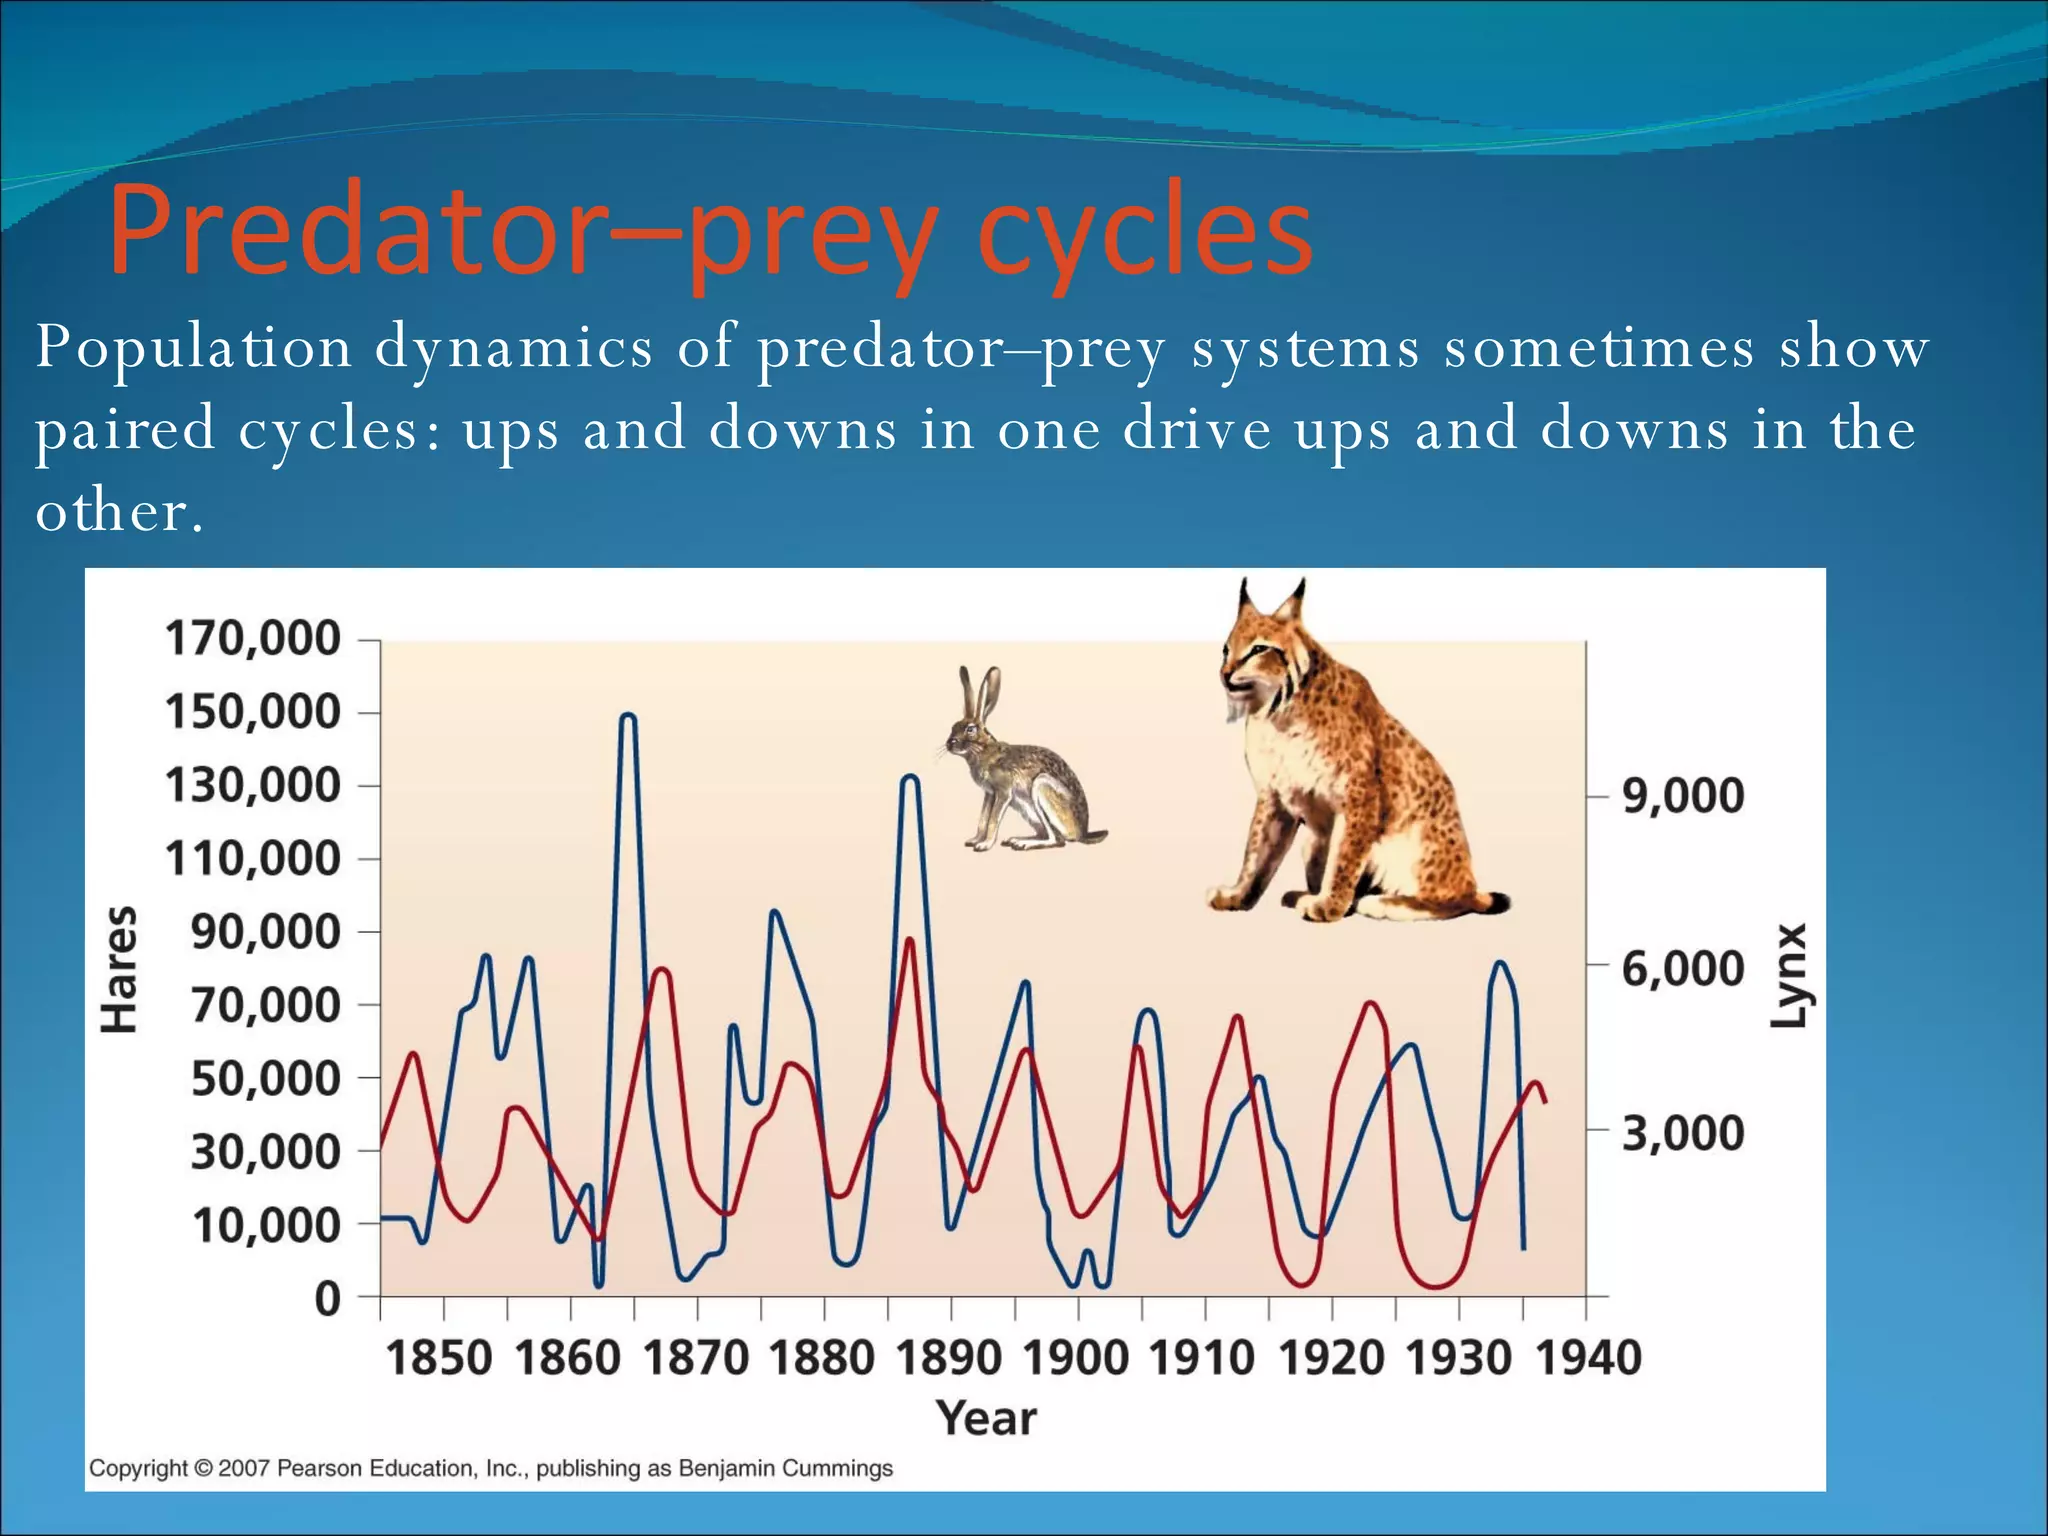
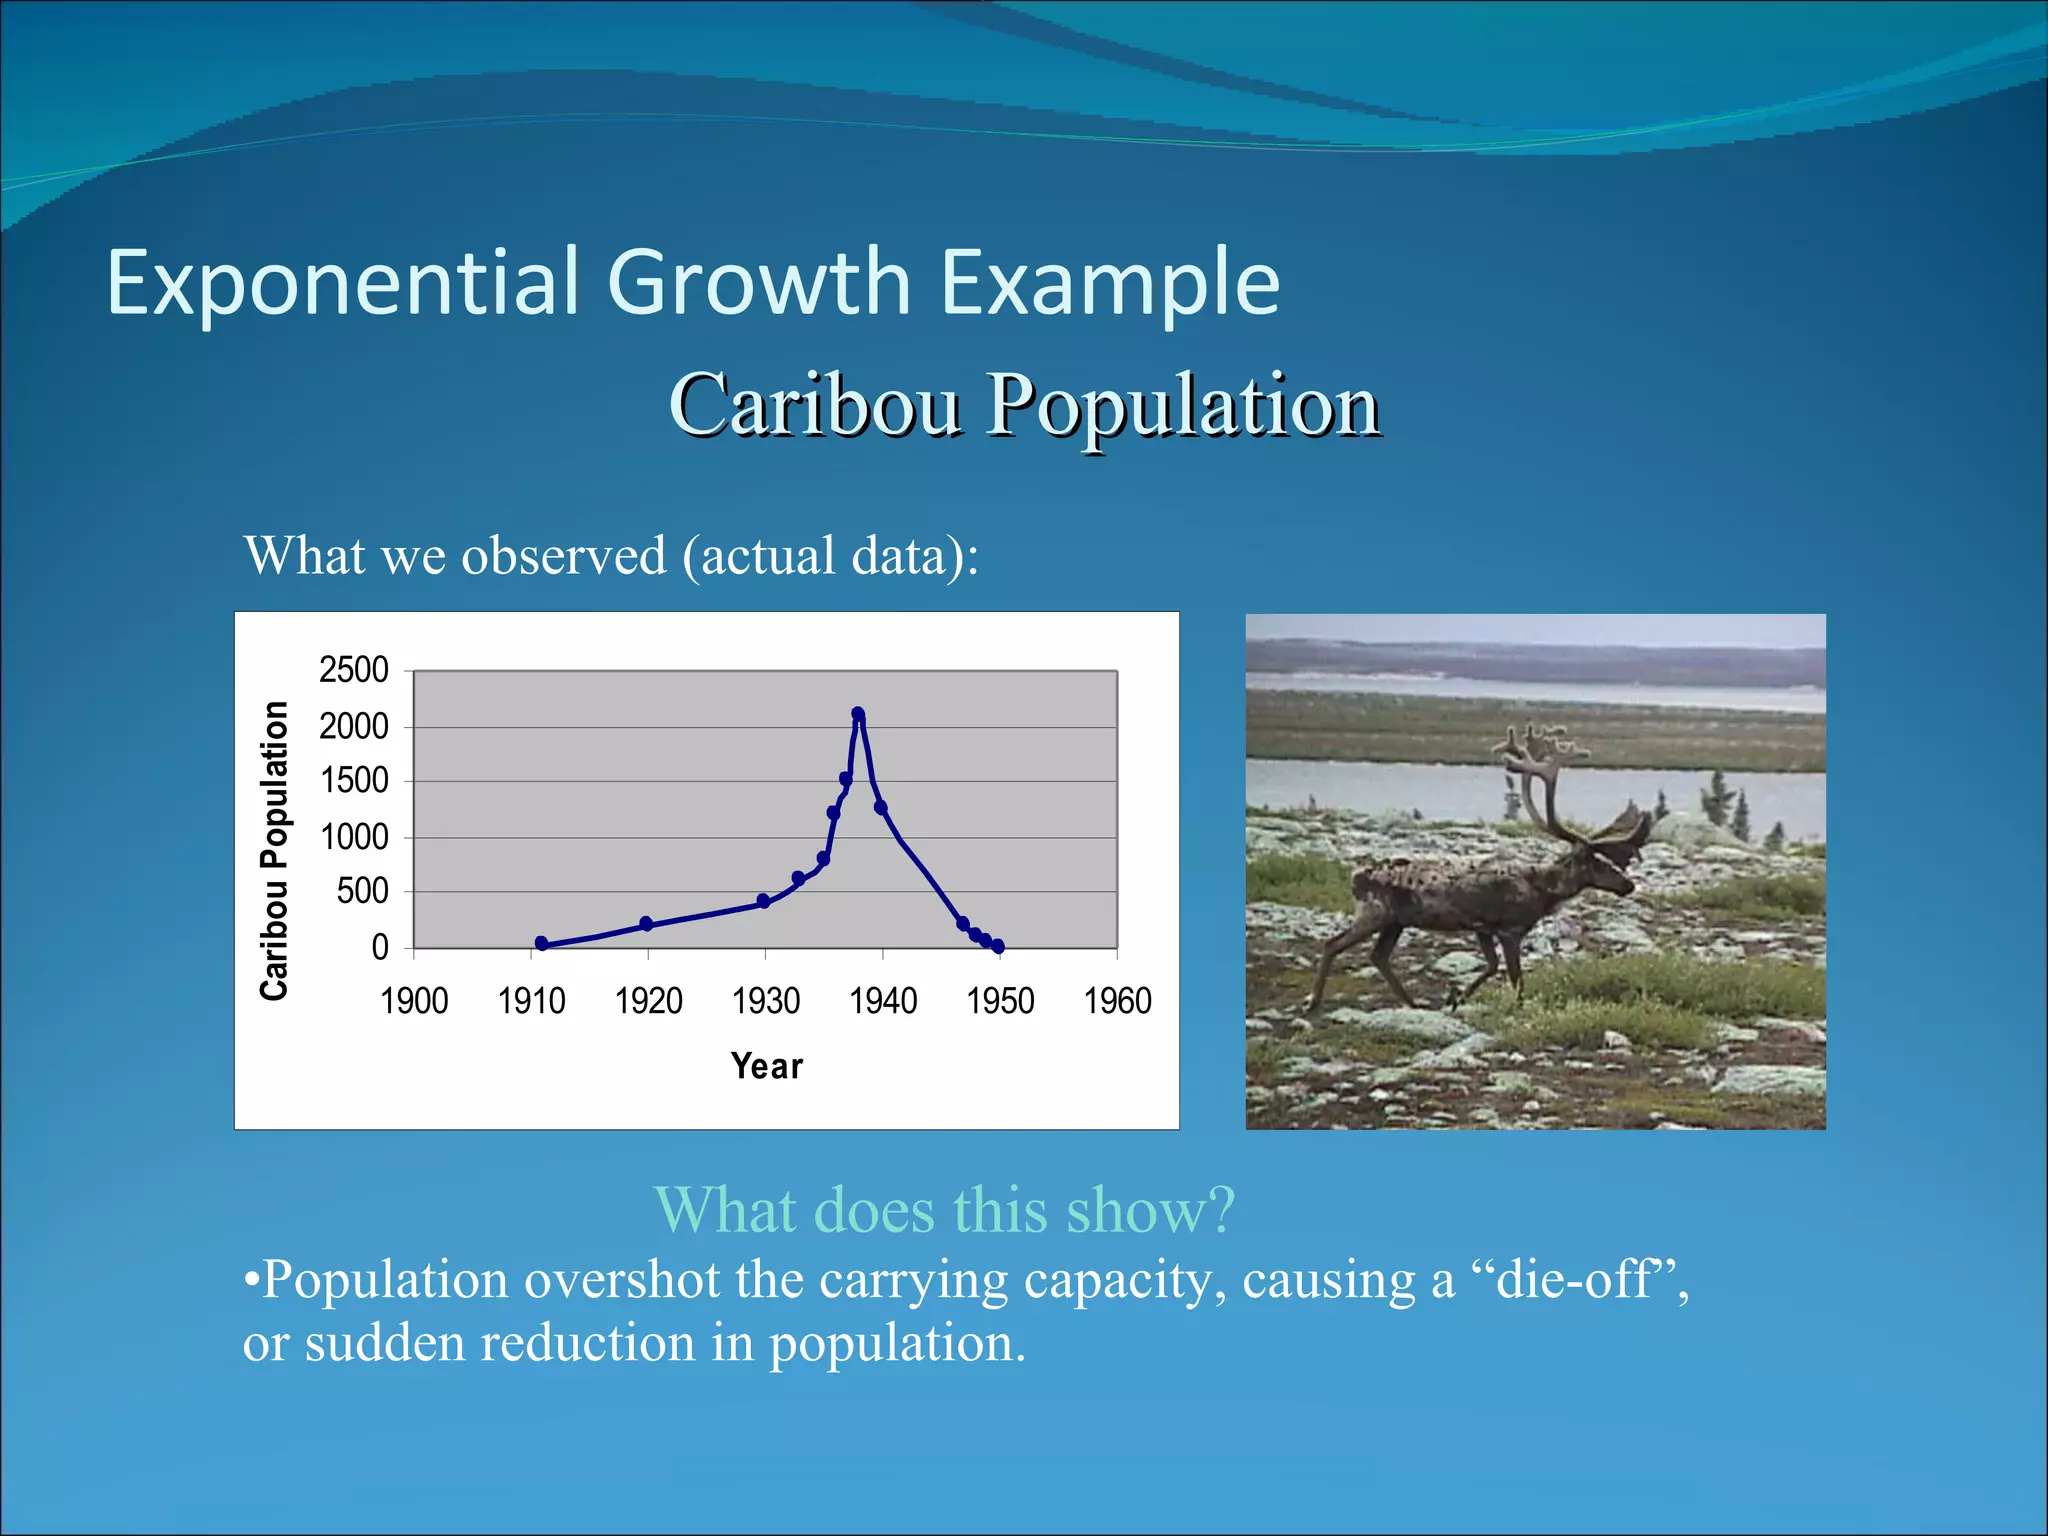
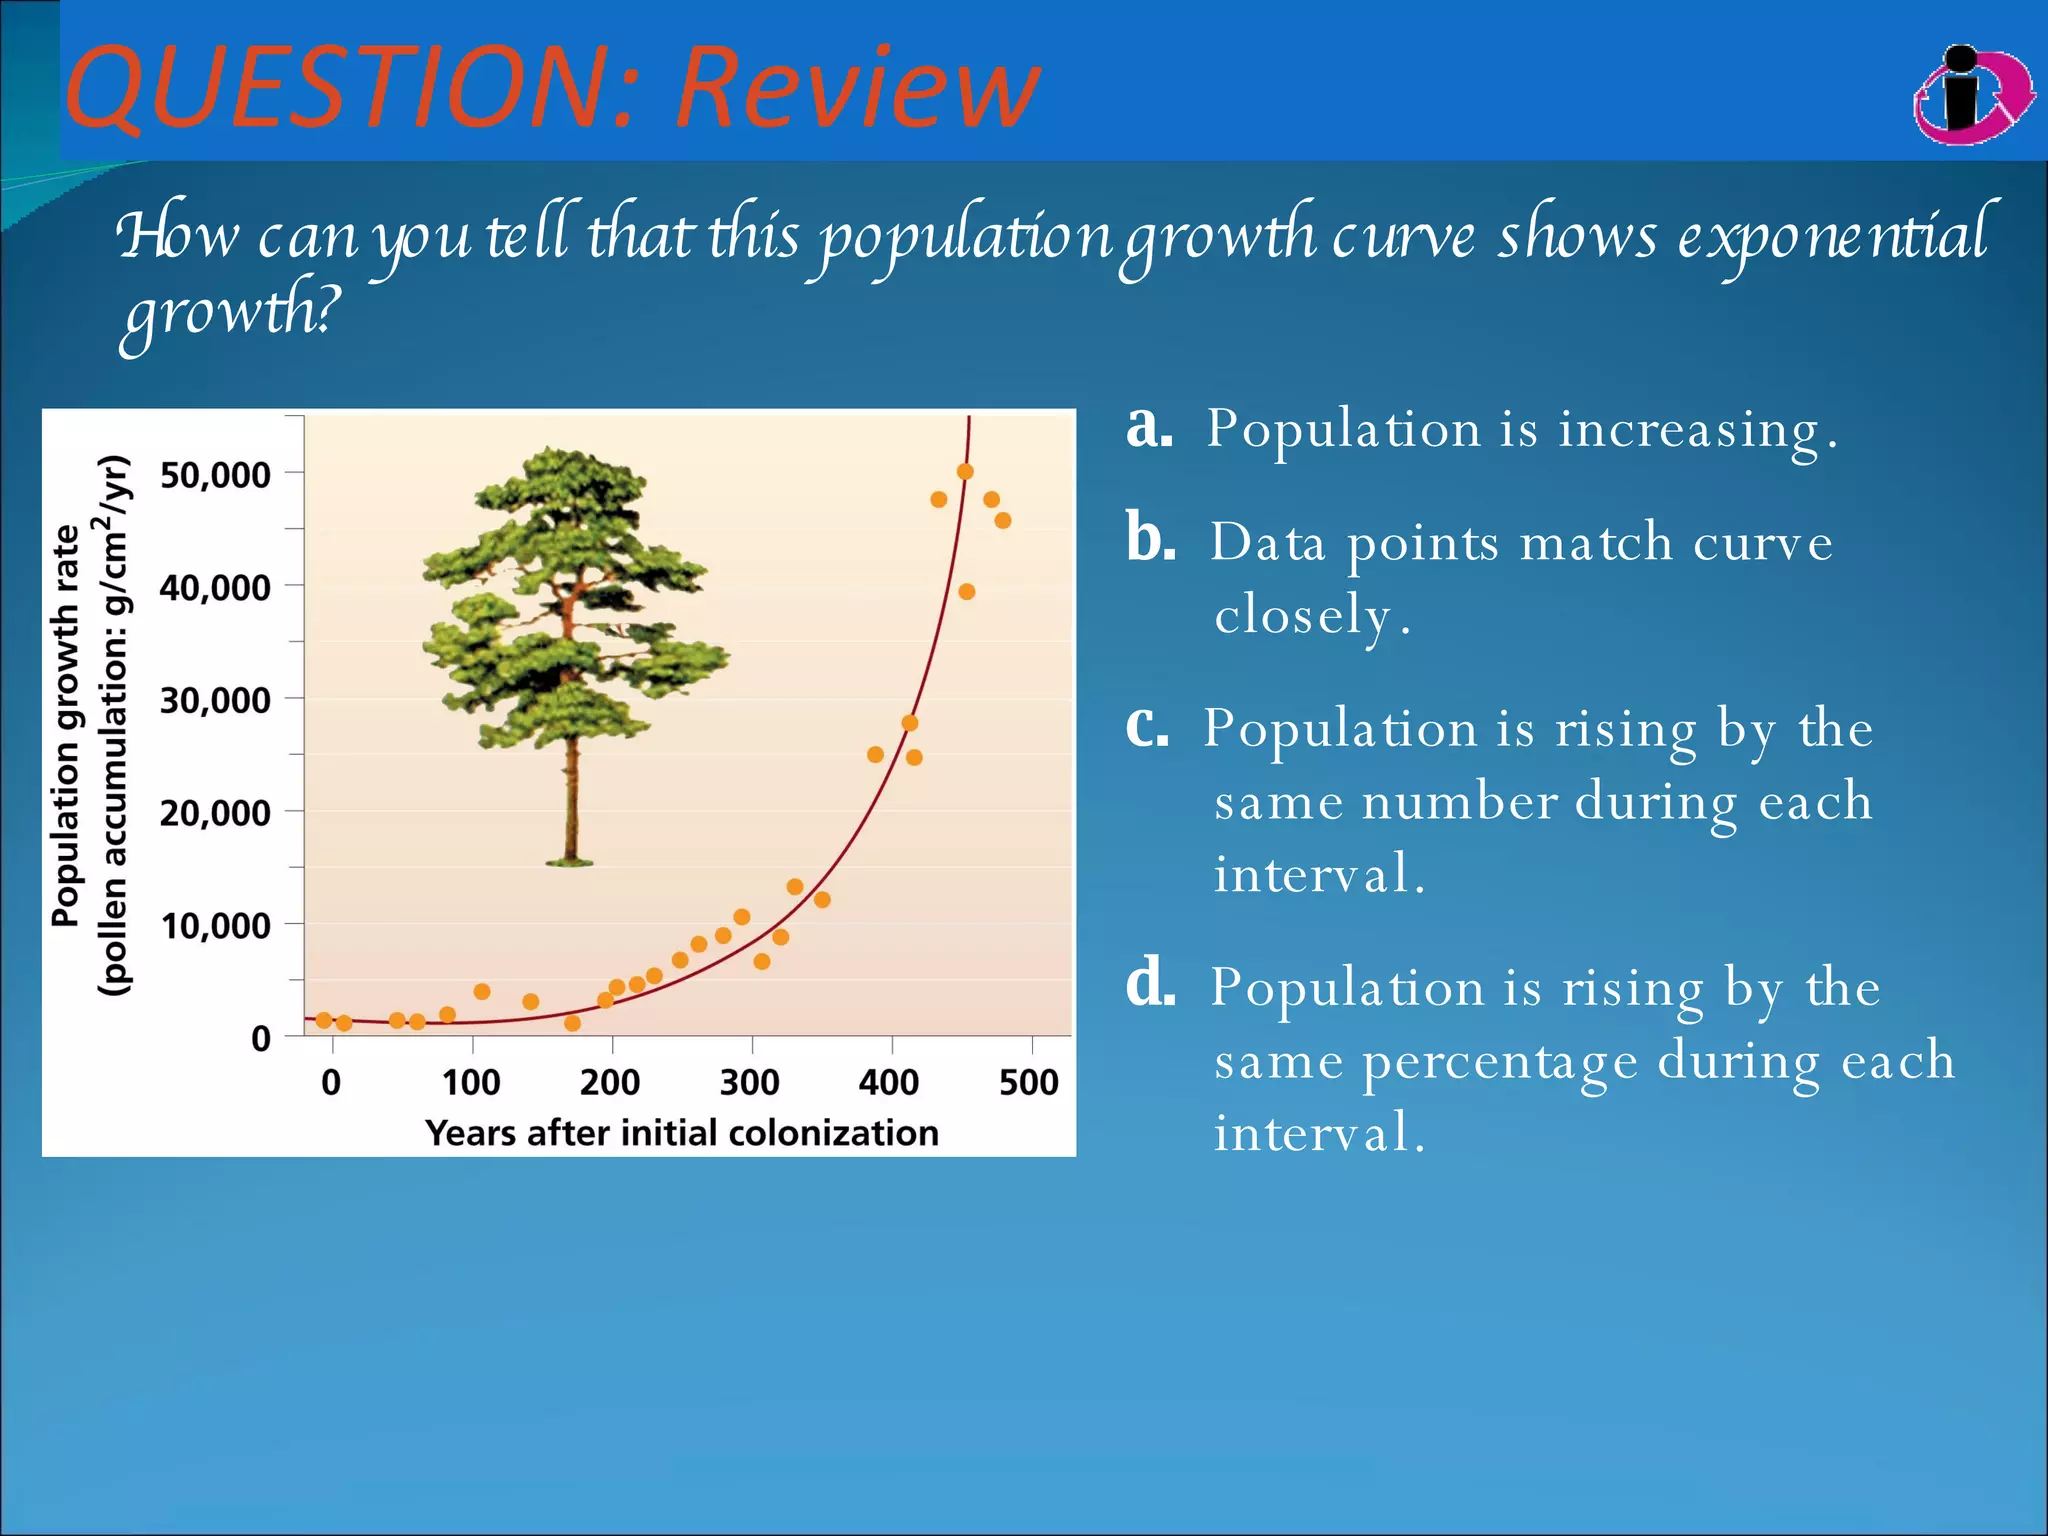
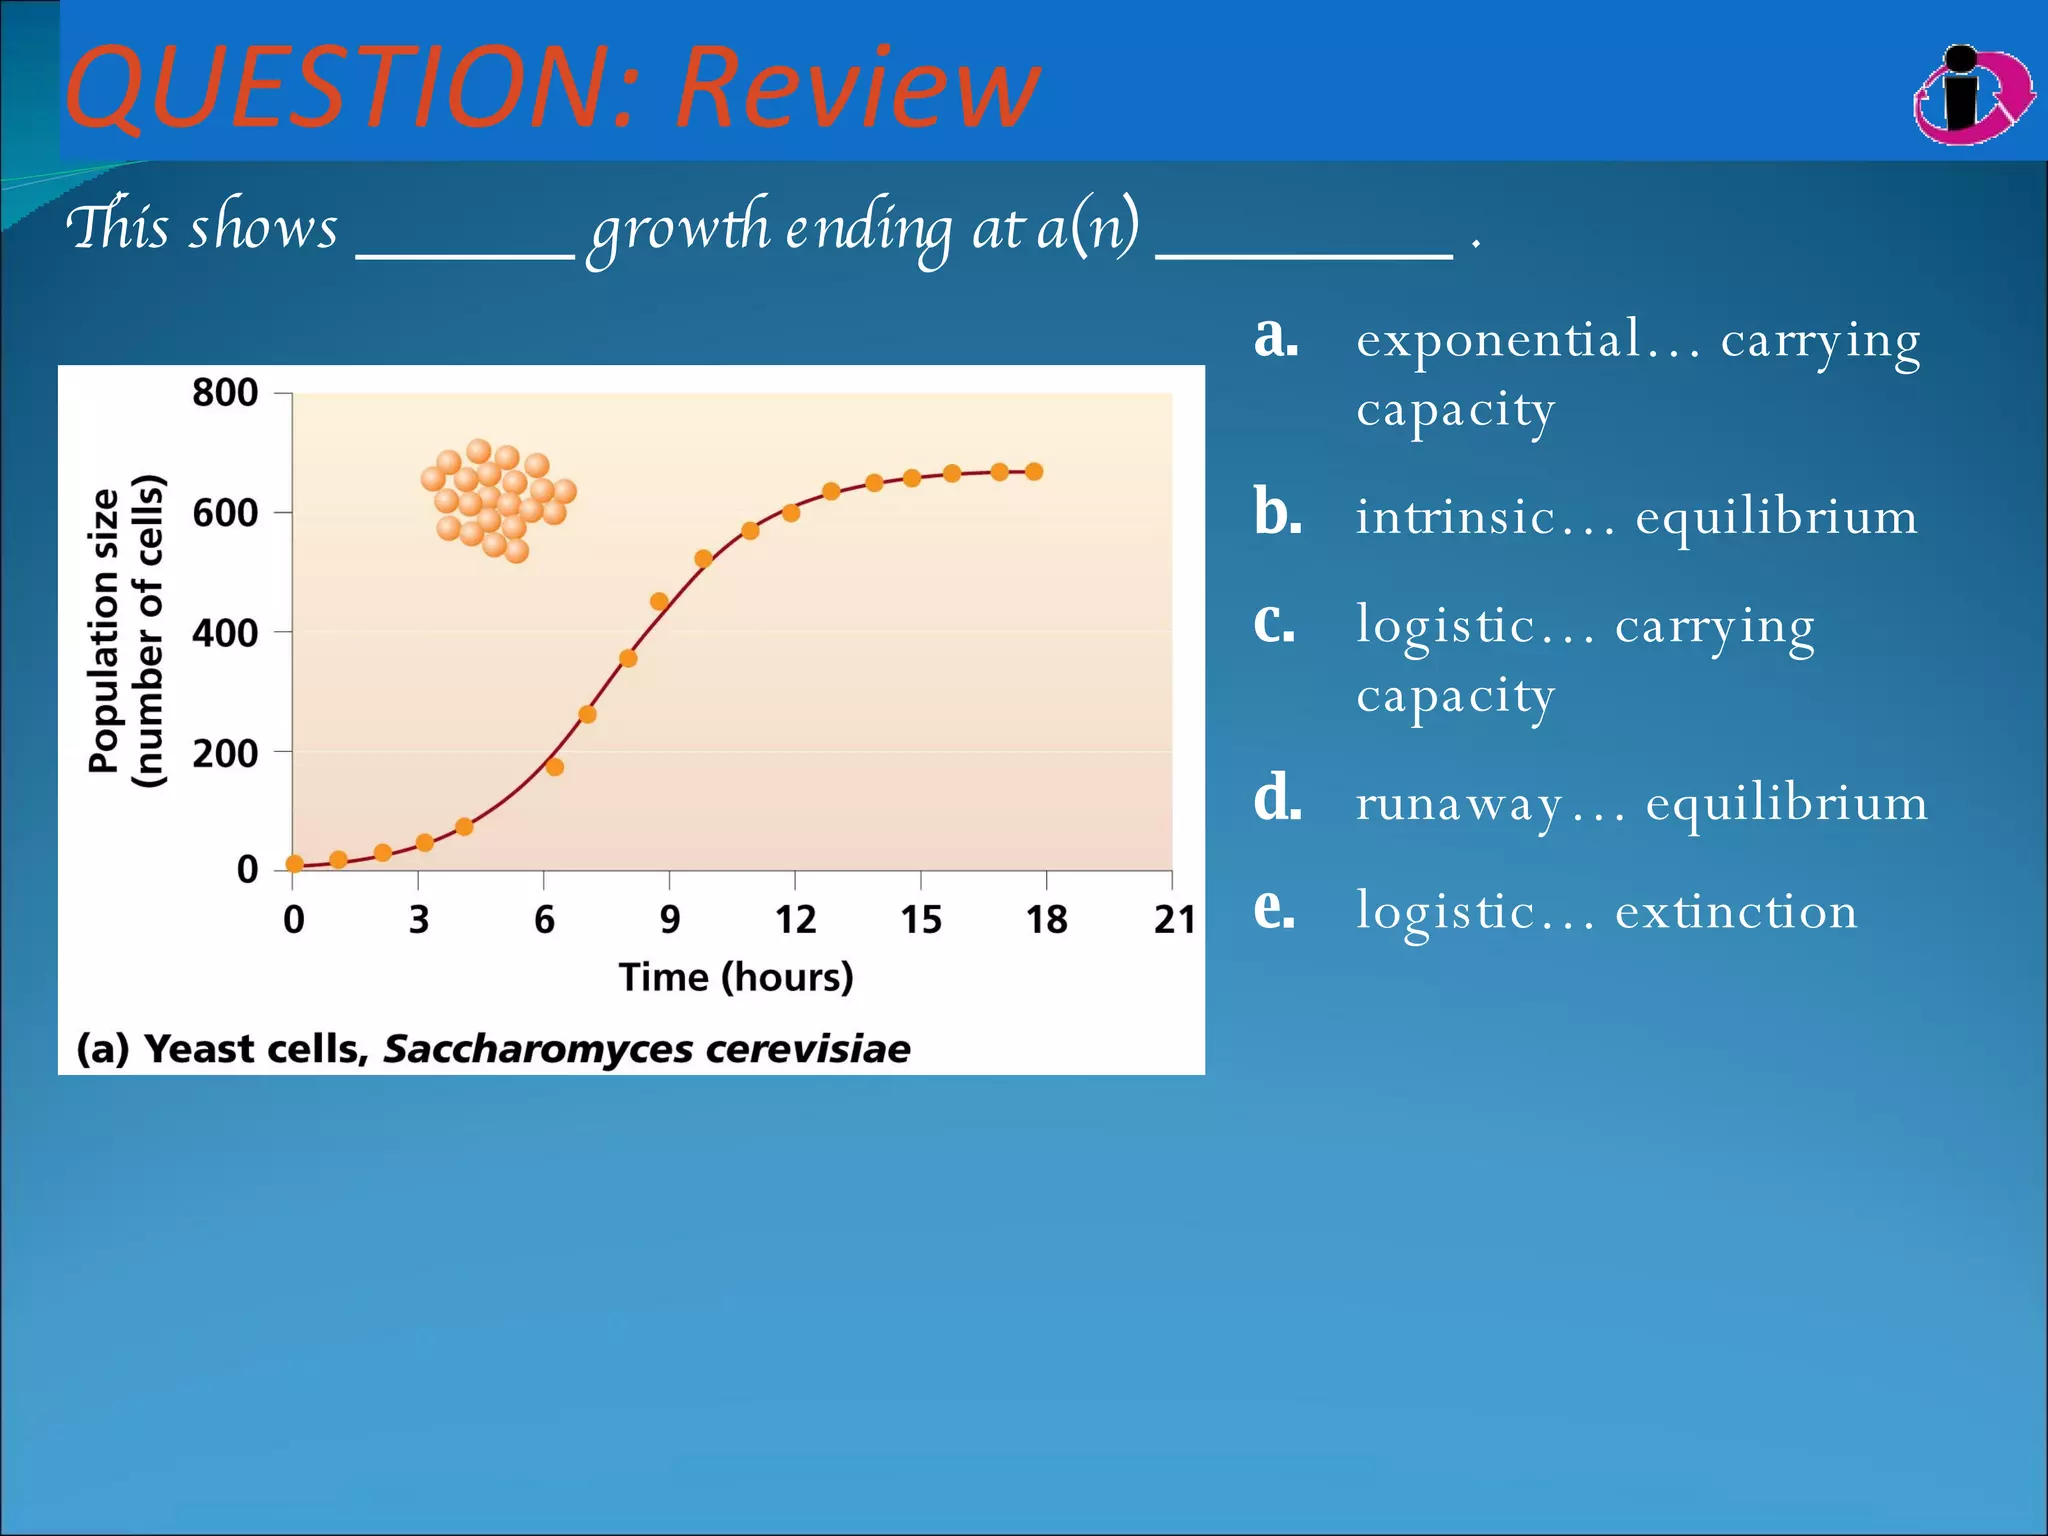
Ecology I Population Ecology
Why is it important?  assessing health of population determining endangered or threatened status predicting population dynamics
Population size …  is the number of individuals present at a given time. The passenger pigeon was once  North America’s most numerous bird, but it is now extinct.
Population density …  is the number of individuals per unit area. In the 19th century, the flocks of passenger pigeons showed high population density.
Population distribution … is the spatial arrangement of individuals. Random Uniform Clumped
Population growth Populations grow, shrink, or remain stable, depending on rates of  birth, death, immigration,  and  emigration. (crude birth rate + immigration rate) – (crude death rate + emigration rate)   =  growth rate
Two Modes of Population Growth Exponential growth Logistic growth Represent two different growth patterns or  Strategies  of populations
Exponential Growth Also known as a J-curve Growth is a fixed percentage of the whole (e.g., 10% per day or year) Population is growing at its full  biotic potential
Exponential growth in a growth curve Population growth curves  show change in population size over time. Scots pine shows  exponential growth
Biotic Potential Maximum possible growth rate of a population. Absence of limitations to growth Example : 2 cats plus all their kittens make how many cats in 10 years? 2 litters/year 2.8 surviving kittens per litter Breeds for 10 years (“breeding life”) (Drum roll…)
ANSWER: 80,399,780 cats!!! Do you need a cat?
Copyright © The McGraw-Hill Companies, Inc. Permission required for reproduction or display. Biotic Potential J curve Time Population Carrying Capacity Carrying Capacity:   MAXIMUM number of individuals that can be supported in a given AREA. FOREVER. Can Populations Grow Forever?
Oscillations : Populations  overshoot  the  carrying capacity  and experience a  dieback  Can be regular or irregular Overshoot  When a population surpasses the carrying capacity of its environment or population explosion Dieback  Population crash
Malthusian Growth Thomas Malthus: 18 th  century economist Believed human populations tend to grow until they exhaust their resources and become subject to famine, disease or war
Population growth: Oscillations Some populations fluctuate continually above and below carrying capacity, as with this mite.
Population growth: Dampening oscillations In some populations, oscillations dampen, as population size settles toward carrying capacity, as with this beetle.
r-Selected Species r = Growth rate Reproduce young High reproductive rates Many small offspring Short-lived Found in unstable or unpredictable environments
Examples of r-Selected Species Weeds, bacteria, insects, algae, small mammals
Logistic Growth Also known as   S-curve Growth slows as the population approaches  Carrying Capacity Populations stabilize at carrying capacity
K-Selected Species K = Carrying Capacity Reproduce later in life Low  reproductive rates Fewer large offspring Long-lived Stable or predictable environments
Examples of K-Selected Species Elephants, great apes, hippopotamus, whales, humans (?)
What Determines Population Size or Carrying Capacity?   Environmental Resistance All the limiting factors that tend to  reduce  population growth rates Balance  between biotic potential & environmental resistance  determines growth rate
Environmental resistance Carrying capacity Stabilized population size Exponential growth Limiting factors: Water Space Food Predators Disease LE 4-11
Predator – prey cycles Population dynamics of predator – prey systems sometimes show paired cycles: ups and downs in one drive ups and downs in the other.
Density dependence Often, survival or reproduction lessens as populations become more dense. Density-dependent   factors that  account for the logistic growth curve Intraspecific competition Interspecific competition Predation Disease Fire (for a population of fire prone plant) Parasitism Other factors occur regardless of density and are  density-independent   factors. Floods Drought Extreme temperatures Pollution Fire Salinity
Exponential Growth Example Caribou Population What does this show? Population overshot the carrying capacity, causing a “die-off”, or sudden reduction in population. What we observed (actual data):
Exponential Growth Example Let’s turn back the clock to the 1930’s… How might wildlife managers  make the curve level-off to a stable population? Hunt them? Add predators? Sterilize them? Move them? Let them starve? Import food?
QUESTION: Review Which is a K-selected species? a. A dragonfly that lays 300 eggs and flies away b. An oak tree that drops its acorns each year c. A bamboo plant that flowers only once every 20 years d. A human who raises three children e. A fish on the second trophic level
QUESTION: Review How can you tell that this population growth curve shows exponential growth? a.   Population is increasing. b.   Data points match curve closely. c.   Population is rising by the same number during each interval. d.   Population is rising by the same percentage during each interval.
QUESTION: Review This shows  growth ending at a(n)  . a. exponential… carrying capacity b. intrinsic… equilibrium c. logistic… carrying capacity d. runaway… equilibrium e. logistic… extinction

Unit2 Ecology Ib Populations Ppt2003

  • 1.
  • 2.
    Why is itimportant? assessing health of population determining endangered or threatened status predicting population dynamics
  • 3.
    Population size … is the number of individuals present at a given time. The passenger pigeon was once North America’s most numerous bird, but it is now extinct.
  • 4.
    Population density … is the number of individuals per unit area. In the 19th century, the flocks of passenger pigeons showed high population density.
  • 5.
    Population distribution …is the spatial arrangement of individuals. Random Uniform Clumped
  • 6.
    Population growth Populationsgrow, shrink, or remain stable, depending on rates of birth, death, immigration, and emigration. (crude birth rate + immigration rate) – (crude death rate + emigration rate) = growth rate
  • 7.
    Two Modes ofPopulation Growth Exponential growth Logistic growth Represent two different growth patterns or Strategies of populations
  • 8.
    Exponential Growth Alsoknown as a J-curve Growth is a fixed percentage of the whole (e.g., 10% per day or year) Population is growing at its full biotic potential
  • 9.
    Exponential growth ina growth curve Population growth curves show change in population size over time. Scots pine shows exponential growth
  • 10.
    Biotic Potential Maximumpossible growth rate of a population. Absence of limitations to growth Example : 2 cats plus all their kittens make how many cats in 10 years? 2 litters/year 2.8 surviving kittens per litter Breeds for 10 years (“breeding life”) (Drum roll…)
  • 11.
    ANSWER: 80,399,780 cats!!!Do you need a cat?
  • 12.
    Copyright © TheMcGraw-Hill Companies, Inc. Permission required for reproduction or display. Biotic Potential J curve Time Population Carrying Capacity Carrying Capacity: MAXIMUM number of individuals that can be supported in a given AREA. FOREVER. Can Populations Grow Forever?
  • 13.
    Oscillations : Populations overshoot the carrying capacity and experience a dieback Can be regular or irregular Overshoot When a population surpasses the carrying capacity of its environment or population explosion Dieback Population crash
  • 14.
    Malthusian Growth ThomasMalthus: 18 th century economist Believed human populations tend to grow until they exhaust their resources and become subject to famine, disease or war
  • 15.
    Population growth: OscillationsSome populations fluctuate continually above and below carrying capacity, as with this mite.
  • 16.
    Population growth: Dampeningoscillations In some populations, oscillations dampen, as population size settles toward carrying capacity, as with this beetle.
  • 17.
    r-Selected Species r= Growth rate Reproduce young High reproductive rates Many small offspring Short-lived Found in unstable or unpredictable environments
  • 18.
    Examples of r-SelectedSpecies Weeds, bacteria, insects, algae, small mammals
  • 19.
    Logistic Growth Alsoknown as S-curve Growth slows as the population approaches Carrying Capacity Populations stabilize at carrying capacity
  • 20.
    K-Selected Species K= Carrying Capacity Reproduce later in life Low reproductive rates Fewer large offspring Long-lived Stable or predictable environments
  • 21.
    Examples of K-SelectedSpecies Elephants, great apes, hippopotamus, whales, humans (?)
  • 22.
    What Determines PopulationSize or Carrying Capacity? Environmental Resistance All the limiting factors that tend to reduce population growth rates Balance between biotic potential & environmental resistance determines growth rate
  • 23.
    Environmental resistance Carryingcapacity Stabilized population size Exponential growth Limiting factors: Water Space Food Predators Disease LE 4-11
  • 24.
    Predator – preycycles Population dynamics of predator – prey systems sometimes show paired cycles: ups and downs in one drive ups and downs in the other.
  • 25.
    Density dependence Often,survival or reproduction lessens as populations become more dense. Density-dependent factors that account for the logistic growth curve Intraspecific competition Interspecific competition Predation Disease Fire (for a population of fire prone plant) Parasitism Other factors occur regardless of density and are density-independent factors. Floods Drought Extreme temperatures Pollution Fire Salinity
  • 26.
    Exponential Growth ExampleCaribou Population What does this show? Population overshot the carrying capacity, causing a “die-off”, or sudden reduction in population. What we observed (actual data):
  • 27.
    Exponential Growth ExampleLet’s turn back the clock to the 1930’s… How might wildlife managers make the curve level-off to a stable population? Hunt them? Add predators? Sterilize them? Move them? Let them starve? Import food?
  • 28.
    QUESTION: Review Whichis a K-selected species? a. A dragonfly that lays 300 eggs and flies away b. An oak tree that drops its acorns each year c. A bamboo plant that flowers only once every 20 years d. A human who raises three children e. A fish on the second trophic level
  • 29.
    QUESTION: Review Howcan you tell that this population growth curve shows exponential growth? a. Population is increasing. b. Data points match curve closely. c. Population is rising by the same number during each interval. d. Population is rising by the same percentage during each interval.
  • 30.
    QUESTION: Review Thisshows growth ending at a(n) . a. exponential… carrying capacity b. intrinsic… equilibrium c. logistic… carrying capacity d. runaway… equilibrium e. logistic… extinction