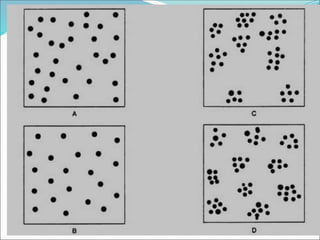
This document discusses key concepts related to population growth and dynamics. It defines what a population is and describes demography as the statistical study of populations. Population size, density, and dispersion are identified as key features of populations. Crude density and ecological density are important indexes used to describe populations. Methods for estimating population densities include mark-recapture and minimum known alive techniques. The concepts of growth rate, sources and sinks, and meta-populations are also introduced. Population dispersion patterns like regular, random, clumped and regular clumped are described. Finally, the document discusses age structure and different types of age pyramids in populations.
Exponential growth: Resource (food and space) availability is
obviously essential for the unimpeded growth of a population.
Ideally, when resources in the habitat are unlimited, each species
has the ability to realise fully its innate potential to grow in number,
as Darwin observed while developing his theory of natural
selection.
Community ecology, study of the organization and functioning of communities, which are assemblages of interacting populations of the species living within a particular area or habitat.
Characteristics of Population PPT covers all the types of Age Distribution Methods,Growth Rates,Population Density,Gender Ratio,Pattern of Distribution ,etc.
This presentation is on carrying capacity of the ecosystem. Here in the presentation we explained about the ecosystem and it's example. It also explained about the the how population and growth pattern takes place in particular a ecosystem and it's effect on carrying capacity.This presentation is taken by Dr. Sachin mandavgane faculty of chemical engineering VNIT Nagpur as a part of our course in sustainable engineering.
It is as per the syllabus of M.Sc. NRM including detailed study of population ecology
It describes the meaning of population with respect to ecology and includes population attributes, dynamics, dispersal, Population growth models, survivorship curves and limitations.
It also entails factors that influence and regulate population growth on the basis of density.
A population is generally a group of particular species occupying a particular area at a specific time. Some of the ecologists however recognize two types of population;
Monospecific population- a population with individuals only one species
Mixed or Polyspecific population- a population of more than one species
However in Ecology, a polyspecific population is considered as a COMMUNITY, and the term POPULATION is used for a group of individuals of any kind of organism.
POPULATION ECOLOGY is the study of individuals of the same species where the processes are aggregation, interdependencies between individuals etc, and the various factors governing such processes are emphasized.
Dynamic biological process influence population density, dispersion a.pdfellanorfelicityri239
Dynamic biological process influence population density, dispersion and demographics
Distinguish between density and dispersion of population. Describe conditions that may result in
clumped dispersion, uniform dispersion, and random dispersion of individuals in a population.
What is a life table and why is it a useful tool for ecologists interested in population ecology?
Distinguish between a life table and a reproductive table. What does a reproductive table tell us?
Describe the characteristics of populations that exhibit Type I, Type II, and Type III survivorship
curves. Could you draw the expected survivorship curve if you were given characteristics of the
population? The exponential model describes population growth in an idealized, unlimited
environment and the elastic model describes how a population grows more slowly as it nears its
carrying capacity. Compare the exponential model of population growth with the logistic model.
What expectations do we have about exponential growth in natural populations? Under what
conditions might we expect to see natural populations increase exponentially? What can
modeling an organism\'s capacity to grow exponentially tell us about it? Explain how an
environment\'s carrying capacity affects the per capita rate of increase of a population. Explain
the meaning of each of the following terms in the logistics model of population growth: dN/dt,
t_max, K N, and (K - N)/K? Distinguish between r-selected populations and K-selected
populations Life history traits are products of natural selection What are life history traits?
What defines an organisms life history? Define and distinguish between semelparity and
iteroparity. Explain what factors may favor the evolution of each life history strategy.
Solution
Density of a population means the number of individuals present in one unit area. Dispersion
means in what manner they are dispersed or spread out in that area whether randomly distributed,
or in groups or evenly dispersed. In clumped dispersion,animals make groups to move and live
together. Often when there is shortage and scarcity of resources in summers, animals tend to
make groups to share resources.These groups can be safeguards for juveniles and can protect
them. Preying skills of few animals can benefit rest of the group in getting the food. In Uniform
dispersion all the animals are evenly distributed on the area and mostly independent to prey and
fight for their own food. They find mate according to their own choice and compatibility and
protect themselves alone. In random dispersion, the population is distributed randomly in the
area where there is mix of all three dispersion patterns. There is enough food in the viscinity,
animals can roam and search freely their food and also can form group. Life table is a table that
has data about death and birth rates of a population under study, that can give ecologists
prediction about probable growth or shrink of a population. It gives them the pattern of .
Ppt is made vailable for public for scientifc use.
Population ecology concept and its characteristics explained by using practical examples in a simple language. data is significant for competitive examinations
Population ecology is the study of how populations — of plants, animals, and other organisms — change over time and space and interact with their environment. Populations are groups of organisms of the same species living in the same area at the same time.
Observation of Io’s Resurfacing via Plume Deposition Using Ground-based Adapt...Sérgio Sacani
Since volcanic activity was first discovered on Io from Voyager images in 1979, changes
on Io’s surface have been monitored from both spacecraft and ground-based telescopes.
Here, we present the highest spatial resolution images of Io ever obtained from a groundbased telescope. These images, acquired by the SHARK-VIS instrument on the Large
Binocular Telescope, show evidence of a major resurfacing event on Io’s trailing hemisphere. When compared to the most recent spacecraft images, the SHARK-VIS images
show that a plume deposit from a powerful eruption at Pillan Patera has covered part
of the long-lived Pele plume deposit. Although this type of resurfacing event may be common on Io, few have been detected due to the rarity of spacecraft visits and the previously low spatial resolution available from Earth-based telescopes. The SHARK-VIS instrument ushers in a new era of high resolution imaging of Io’s surface using adaptive
optics at visible wavelengths.
Introduction:
RNA interference (RNAi) or Post-Transcriptional Gene Silencing (PTGS) is an important biological process for modulating eukaryotic gene expression.
It is highly conserved process of posttranscriptional gene silencing by which double stranded RNA (dsRNA) causes sequence-specific degradation of mRNA sequences.
dsRNA-induced gene silencing (RNAi) is reported in a wide range of eukaryotes ranging from worms, insects, mammals and plants.
This process mediates resistance to both endogenous parasitic and exogenous pathogenic nucleic acids, and regulates the expression of protein-coding genes.
What are small ncRNAs?
micro RNA (miRNA)
short interfering RNA (siRNA)
Properties of small non-coding RNA:
Involved in silencing mRNA transcripts.
Called “small” because they are usually only about 21-24 nucleotides long.
Synthesized by first cutting up longer precursor sequences (like the 61nt one that Lee discovered).
Silence an mRNA by base pairing with some sequence on the mRNA.
Discovery of siRNA?
The first small RNA:
In 1993 Rosalind Lee (Victor Ambros lab) was studying a non- coding gene in C. elegans, lin-4, that was involved in silencing of another gene, lin-14, at the appropriate time in the
development of the worm C. elegans.
Two small transcripts of lin-4 (22nt and 61nt) were found to be complementary to a sequence in the 3' UTR of lin-14.
Because lin-4 encoded no protein, she deduced that it must be these transcripts that are causing the silencing by RNA-RNA interactions.
Types of RNAi ( non coding RNA)
MiRNA
Length (23-25 nt)
Trans acting
Binds with target MRNA in mismatch
Translation inhibition
Si RNA
Length 21 nt.
Cis acting
Bind with target Mrna in perfect complementary sequence
Piwi-RNA
Length ; 25 to 36 nt.
Expressed in Germ Cells
Regulates trnasposomes activity
MECHANISM OF RNAI:
First the double-stranded RNA teams up with a protein complex named Dicer, which cuts the long RNA into short pieces.
Then another protein complex called RISC (RNA-induced silencing complex) discards one of the two RNA strands.
The RISC-docked, single-stranded RNA then pairs with the homologous mRNA and destroys it.
THE RISC COMPLEX:
RISC is large(>500kD) RNA multi- protein Binding complex which triggers MRNA degradation in response to MRNA
Unwinding of double stranded Si RNA by ATP independent Helicase
Active component of RISC is Ago proteins( ENDONUCLEASE) which cleave target MRNA.
DICER: endonuclease (RNase Family III)
Argonaute: Central Component of the RNA-Induced Silencing Complex (RISC)
One strand of the dsRNA produced by Dicer is retained in the RISC complex in association with Argonaute
ARGONAUTE PROTEIN :
1.PAZ(PIWI/Argonaute/ Zwille)- Recognition of target MRNA
2.PIWI (p-element induced wimpy Testis)- breaks Phosphodiester bond of mRNA.)RNAse H activity.
MiRNA:
The Double-stranded RNAs are naturally produced in eukaryotic cells during development, and they have a key role in regulating gene expression .
Slide 1: Title Slide
Extrachromosomal Inheritance
Slide 2: Introduction to Extrachromosomal Inheritance
Definition: Extrachromosomal inheritance refers to the transmission of genetic material that is not found within the nucleus.
Key Components: Involves genes located in mitochondria, chloroplasts, and plasmids.
Slide 3: Mitochondrial Inheritance
Mitochondria: Organelles responsible for energy production.
Mitochondrial DNA (mtDNA): Circular DNA molecule found in mitochondria.
Inheritance Pattern: Maternally inherited, meaning it is passed from mothers to all their offspring.
Diseases: Examples include Leber’s hereditary optic neuropathy (LHON) and mitochondrial myopathy.
Slide 4: Chloroplast Inheritance
Chloroplasts: Organelles responsible for photosynthesis in plants.
Chloroplast DNA (cpDNA): Circular DNA molecule found in chloroplasts.
Inheritance Pattern: Often maternally inherited in most plants, but can vary in some species.
Examples: Variegation in plants, where leaf color patterns are determined by chloroplast DNA.
Slide 5: Plasmid Inheritance
Plasmids: Small, circular DNA molecules found in bacteria and some eukaryotes.
Features: Can carry antibiotic resistance genes and can be transferred between cells through processes like conjugation.
Significance: Important in biotechnology for gene cloning and genetic engineering.
Slide 6: Mechanisms of Extrachromosomal Inheritance
Non-Mendelian Patterns: Do not follow Mendel’s laws of inheritance.
Cytoplasmic Segregation: During cell division, organelles like mitochondria and chloroplasts are randomly distributed to daughter cells.
Heteroplasmy: Presence of more than one type of organellar genome within a cell, leading to variation in expression.
Slide 7: Examples of Extrachromosomal Inheritance
Four O’clock Plant (Mirabilis jalapa): Shows variegated leaves due to different cpDNA in leaf cells.
Petite Mutants in Yeast: Result from mutations in mitochondrial DNA affecting respiration.
Slide 8: Importance of Extrachromosomal Inheritance
Evolution: Provides insight into the evolution of eukaryotic cells.
Medicine: Understanding mitochondrial inheritance helps in diagnosing and treating mitochondrial diseases.
Agriculture: Chloroplast inheritance can be used in plant breeding and genetic modification.
Slide 9: Recent Research and Advances
Gene Editing: Techniques like CRISPR-Cas9 are being used to edit mitochondrial and chloroplast DNA.
Therapies: Development of mitochondrial replacement therapy (MRT) for preventing mitochondrial diseases.
Slide 10: Conclusion
Summary: Extrachromosomal inheritance involves the transmission of genetic material outside the nucleus and plays a crucial role in genetics, medicine, and biotechnology.
Future Directions: Continued research and technological advancements hold promise for new treatments and applications.
Slide 11: Questions and Discussion
Invite Audience: Open the floor for any questions or further discussion on the topic.
(May 29th, 2024) Advancements in Intravital Microscopy- Insights for Preclini...Scintica Instrumentation
Intravital microscopy (IVM) is a powerful tool utilized to study cellular behavior over time and space in vivo. Much of our understanding of cell biology has been accomplished using various in vitro and ex vivo methods; however, these studies do not necessarily reflect the natural dynamics of biological processes. Unlike traditional cell culture or fixed tissue imaging, IVM allows for the ultra-fast high-resolution imaging of cellular processes over time and space and were studied in its natural environment. Real-time visualization of biological processes in the context of an intact organism helps maintain physiological relevance and provide insights into the progression of disease, response to treatments or developmental processes.
In this webinar we give an overview of advanced applications of the IVM system in preclinical research. IVIM technology is a provider of all-in-one intravital microscopy systems and solutions optimized for in vivo imaging of live animal models at sub-micron resolution. The system’s unique features and user-friendly software enables researchers to probe fast dynamic biological processes such as immune cell tracking, cell-cell interaction as well as vascularization and tumor metastasis with exceptional detail. This webinar will also give an overview of IVM being utilized in drug development, offering a view into the intricate interaction between drugs/nanoparticles and tissues in vivo and allows for the evaluation of therapeutic intervention in a variety of tissues and organs. This interdisciplinary collaboration continues to drive the advancements of novel therapeutic strategies.
2. What is a population?
● A group of organism of the same species living in the same
habitat at the same time where they can freely interbreed
Or
● It is a group of individuals of a particular species occupiying a
particular area at a particular time.
Or
● The population that occupies a very small area, is smaller in
size, such a population is called local population.
● A group of such a closely related local population is called
meta-population.
3. What is a Demography?
● It is the statistical study of populations. It is used to
predict how the size of a population will change
5. Describing a population
1.Size and Density
▪Crude density-density per unit total space.
▪Specific density/ecological/economic -density per unit
habitat space.Graph
6.
7. Important Indexes Used:
1. Crude density: It is the number (or biomass) per unit of total space.
2. Ecological density: Ecological density is the number (or biomass) per
unit of habitat space (area or volume available that can be colonised by
the population)
3. Relative abundance: It is used to denote changing (increasing or
decreasing) population and is time relative. For example, the number of
birds seen on a tree per hour.
4. Frequency of occurrence: Frequency of occurrence is the percentage
of sample plots occupied by a species.
5. Importance value: The importance value of each species are formed
by combining density, dominance and frequency during the descriptive
studies of vegetation.
8. Thus local density provides us with:
(1) Information about the interaction of a population with its environment
(2) Changes in density reflect changing local conditions.
➢The factors that regulate population size can be classified as extrinsic
and intrinsic.
● The populations own response to density is said to be intrinsic, while the
interaction with the rest of the community is said to be the extrinsic
factor.
● Intrinsic factors include intraspecific competition, immigration,
emigration and physiological and behavioural changes affecting
reproduction and survival.
● Extrinsic factors are interspecific competition, predation, parasitism and
disease.
9. Methods for Estimating Population Densities:● Mark-recapture method. This method involves capturing
of a fraction of the population and marking with tags,
paint, radio collars etc. and releasing them back into the
population enough time is allowed for the marked
individuals to recover and mingle with the rest of the
population.
● A second sample is taken, after a certain time period, from
the mingled population.
10. ● The ratio of the marked to unmarked is noted and the
estimate of the population size can be calculated by
the following equation:
● X = nM/N
● where x =the number of marked individuals recaptured,
● N = the total number or size of the second sample, =
● M = the number of individuals marked initially (first
sampling), and N is the total size of the population.
● If the above equation is rearranged, then we get
● N = nM/x
11. Thus, the estimate of the total population density is called
Lincoln index.
The validity of the above equation is based upon the factors
listed:
1. The marking technique has no negative effect.
2. The marked individuals were released at the same site of capture
and were allowed to mix with the population, based on their
natural behaviour.
3.Marking technique does not affect the probability of being
recaptured.
4. The markings should be clear and firmly fixed so that they are
not lost or overlooked.
5. There should not be any significant natality or mortality during
the time interval under study.
6. No significant immigration or emigration of marked or unmarked
individuals during the time interval under study.
12. Problem solving
● Example:
● Supposing 100 deers were radio collared and was
allowed to mix with the population. After a certain
time period 38 deers came to a particular site for
licking salts.
● Of these 38 deers, the numbers of radio collared
animals were 8.
● Thus, the density of deer population is that area is
estimated to be ??????????
13. ● Solution :-
● Supposing 100 deers (M) were radio collared and was allowed to mix
with the population. After a certain time period 38 deers (n) came to a
particular site for licking salts. Of these 38 deers, the numbers of
radio collared animals were 8(x). Thus, the density of deer population
is that area is estimated to be
● N = 38(100)/8 = 475
● However, for bigger carnivore animals the estimate of population is
generally done by the pug mark method eg tigers.
● The other methods generally used are minimum known alive
(MKA) total counts, quadrate or transect sampling, removal
sampling, plotless methods etc.
14. Concept of Growth rate
▪ Growth Rate –ΔN/ Δ t
● Where-ΔN= is the change in
number of organisms.
● Δ t = per time
15. Sources, Sinks and Meta-populations:
● When there is abundant
resources in habitats, more
offsprings are produced by
individuals than required to
replace themselves.
● In such cases, the surplus
offspring may disperse to
other areas.
● Such populations are said to be
source populations .
16. ● The reverse occurs in
case of poor habitats.
● Here, few offsprings are
produced locally, to
replace loss due to
mortality.
● Thus, to maintain the
population, individuals
immigrate from other
habitats. These
populations are said to be
sink populations
17. ➢There are populations that exist
as a set of subpopulations
referred to as meta-populations
by Richard Levins (1970).
➢These meta-populations are
more or less isolated but there
exist some exchange of
individuals (and genes) by way
of dispersal.
➢These concepts of sources, sinks
and meta-populations are
important as they serve as a
framework for studying many of
our threatened and endangered
species.
18. ▪2.Dispersion -Dispersion is the spatial pattern of
individuals in a population relative to one another.
▪In nature, due to various biotic interactions and
influence of abiotic factors, the following four basic
population distributions can be observed:-
▪ Regular
▪ Random
▪ Clumped
▪ Regular clumped
19. (a) Regular dispersion- Here the individuals are more or less
spaced at equal distance from one another. This is rare in
nature but in common is cropland.
● Examples:
monoculture crops, orchard or pine plantation, desert
shrubs etc
(b) Random dispersion: Here the position of one individual is
unrelated to the positions of its neighbours. This is also
relatively rare in nature.
Examples:
Lone parasites or predators show a random
distribution as they are often engaged in random searching
behaviour for their host or prey.
20. (c) Clumped dispersion: Most populations exhibit this
dispersion ,individuals aggregated into patches interspersed
with no or few individuals. Such aggregations may result from
social aggregations, such as family groups or may be due to
certain patches of the environment being more favourable for
the population concerned.
● Examples: Salamanders prefer to live in clumps under logs.
Birds travel in large flocks. Trees form clumps of individuals
through vegetative reproduction.
● D) In regular clumped distribution: Individuals are clumped and
are spaced out evenly from other similar clumps.
Examples: Herds of animals or vegetative clones in plants show
either random or are clumped in a regular pattern.
23. To determine the type of spacing and the degree of clumping, several
methods have been suggested of which two are mentioned:
1. To compare the actual frequency of occurrence of different sized
groups obtained in a series of samples. If the occurrence of small sized
and large sized groups is more frequent and the occurrence of mid-
sized groups less frequent than expected, then the distribution is
clumped. The reverse is seen in uniform distribution.
2. The distance between individuals are measured and the square root of
the distance is plotted against frequency. The shape of the resulting
polygon indicates the pattern of distribution. A symmetrical polygon
(bell-shaped) indicates random distribution, a slanted polygon to the
right indicates a uniform distribution, and one slanted to the left
indicates a clumped distribution.
24. The Allee principle:
➢Aggregation will subsequently increase competition .
➢This often is counter-balanced by the increased survival of the
group due to its ability to defend itself, or to find resource, or to
modify microhabitat conditions.
➢Thus, both under-crowding (lack of aggregation) and over-
crowding may be limiting. This view was put forward by W. C.
Allee, a Quaker and V. E. Shelford, and was termed as the Allee
effect or Allee principle of aggregation.
➢Allee effect stresses that any optimal function (faster body growth,
increased reproduction, or longer life) takes place at an intermediate
rather than at minimal density.
➢For instance, at low density, a drop in reproductive rate takes place
as some females may go unmated because they were not found by
males or because of an unbalanced sex ratio.
25. 3. Age structure-
• In most types of populations, individuals are of different age.
• The proportion of individuals in each age group is called age
structure of that population.
• The ratio of the various age groups in a population determines
the current reproductive status of the population, thus
anticipating its future.
• From an ecological view point there are three major ecological
ages in any population.
• These are, pre-reproductive, reproductive and post reproductive.
The relative duration of these age groups in proportion to the
life span varies greatly with different organisms.
26. Age pyramids
▪ Young population (Triangular)-It indicates a
high percentage of young individuals. In rapidly growing
young populations birth rate is high and population growth
may be exponential as in yeasty house fly, Paramecium,
etc
▪ Stable population (Bell)-It indicates a stationary
population having an equal number of young and middle
aged individuals.
▪ Declining population (Urn)-It indicates a low
percentage of young individuals and shows a declining
population
27.
28.
29. Population Growth:
The size of a population for any species is not a
static parameter, it keeps changing with time.
It depends on the following factors:
(i) Food availability
(ii) Predation pressure
(iii) Weather
30. 4. Natality
● It is simply a broader term covering the production of new
individuals by birth, hatching, by fission, etc.
● The natality rate may be expressed as the number of
organisms born per female per unit time.
● In human population, the natality rate is equivalent to the
birth-rate.
● Increases population size
● Each species will have its own maximum birth rate
● Maximum birth rates are seen when conditions are ideal
● This can lead to exponential growth
1. MAXIMUM NATALITY/FECUNDITY
2. ECOLOGICAL NATILITY/FERTILITY RATE
31. (a) Maximum natality:
Also called as absolute or potential or physiological natality, it is
the theoretical maximum production of new individuals under ideal
conditions.
It is a constant for a given population. This is also called fecundity
rate.
(b) Ecological natality:
Also called realized natality or simply natality, it is the
population increase under an actual, existing specific condition.
Thus it takes into account all possible existing environmental
conditions. This is also designated as fertility rate.
32. ● Natality is expressed as
● ∆Nn/∆ t = Absolute Natality rate (B)
● ∆Nn/N ∆ t = Specific natality rate (b) (i.e., natality rate
per unit of population).
● Where N = initial number of organisms.
● n = new individuals in the population.
● t = time.
33. 5. Mortality
● Mortality reduces population growth
● It operates more when conditions are not ideal
● Overcrowding leading to competition, spread of
infectious disease
TYPES
1. MINIMUM /SPECIFIC/POTENTIAL MORTALITY
2. ECOLOGICAL/REALISED MORTALITY
34. ● (a) Minimum mortality:
● Also called specific or potential mortality, it represents the
theoretical minimum loss under ideal or non-limiting
conditions. It is a constant for a population.
● (b) Ecological or realised mortality:
● It is the actual loss of individuals under a given
environmental condition. Ecological mortality is not
constant for a population and varies with population and
environmental conditions, such as predation, disease and
other ecological hazards.
35. Vital index and survivorship curves
● A birth-death ratio (100 x births/deaths) is called vital index.
● For a population, the surviving individuals are more significant
for a population than the dead ones.
● The survival rates are generally expressed by survivorship curves.
● A survivorship curve is a graph of the survival rate of a group
of organisms. In making a survivorship graph, a cohort is
used; in this case, a group of individuals who were born at
roughly the same time.
● This cohort is then graphed with the number of surviving
individuals on the y-axis and the age of the cohort on the x-axis.
● Generally, a species will have one of three types of survivorship
curves.
36. Survivorship
● Survivorship is the percentage of newborn individuals in a
population that can be expected to survive to a given age.
● It is used as another way to predict population trends.
● To predict survivorship, demographers study a group of
people born at the same time and notes when each member
of the group dies.
37. Survivorship
● Wealthy developed countries such
as Japan and Germany currently
have a Type I survivorship curve
because most people live to be
very old.
● Type II populations have a similar
death rate at all ages.
● Type III survivorship is the
pattern in very poor human
populations in which many
children die.
● Both Type I and Type III may
result in populations that remain
the same size or grow slowly.
The results of these studies are then plotted
on a graph and might look like one of the
types of survivorship graphs
38.
39. Age, years (x)
Probability of surviving to age x
(lx)
No. of female offspring born to a
mother of age x (mx)
0 1.000 0.000
1 0.845 0.045
2 0.824 0.391
3 0.795 0.472
4 0.755 0.484
5 0.699 0.546
6 0.626 0.543
7 0.532 0.502
8 0.418 0.468
9 0.289 0.459
10 0.162 0.433
11 0.060 0.421
6. LIFE TABLES- Information on mortality , natality in
different ages and sexes can be combined to form life table.
Example-Consider a sheep population which is censused once a year
immediately after breeding season
40. TYPES OF LIFE TABLES:-
▪Cohort or age-specific or dynamic life tables: -data are
collected by following a cohort throughout its life. This is
rarely possible with natural populations of animals.
▪ Note: a cohort is a group of individuals all born
during the same time interval.
▪Static or time-specific life tables:- age-distribution data
are collected from a cross-section of the population at one
particular time or during a short segment of time, such as
through mortality data.
▪Composite :- data are gathered over a number of years
and generations using cohort or time-specific techniques.
41. Factors that affect density
1. Immigration- movement of individuals into a population
2. Emigration- movement of individuals out of a population
42. The density of a population in a given habitat during a given period, fluctuates due to the four basic
processes:
● (a) Natality refers to the number of
births during a given period in the
population that are added to initial
density.
● (b) Mortality is the number of deaths in
the population during a given period.
● (c) Immigration is the number of
individuals of the same species that have
come into the habitat from elsewhere
during the time period under
consideration.
● (d) Emigration is the number of
individuals of population who left the
habitat and moved elsewhere during a
given period of time.
43. ● Out of these four, natality and immigration contribute an
increase in population density while mortality and emigration
contribute to the decrease in population density.
● So, if N is the population density at time t, then its density at
time t +1 is
● Nt+1 = Nt + [(B + I) – (D + E)]
● Where, N = Population density
● t = Time,
● B = Birth rate,
● I = Immigration,
● D = Death rate,
● E = Emigration
From the above equations, we can see that population
density will increase if, (B + I) is more than (D + E).
45. KEY FEATURES OF POPULATIONS, con’t
Population size is limited by:
density-dependent factors
● Disease
● Competition
● Predators
● Parasites
● Food
● Crowding
● The greater the population,
the greater effect these
factors have.
● Ex. Black plague in the
Middle Ages – more deaths
in cities
density-independent factors
● Volcanic eruptions
● Temperature
● Storms
● Floods
● Drought
● Chemical pesticides
● Major habitat disruption (as
in the New Orleans flooding)
● Most are abiotic factors
46. Other factors that affect population growth
Limiting factor- any biotic or abiotic
factor that restricts the existence of
organisms in a specific
environment.
●EX.- Amount of water
Amount of food
Temperature
47. Phases of population growth
Phase 1: Log or exponential phase
● Unlimited population growth
● The intrinsic rate of increase (r)
● Abundant food, no disease, no predators etc
Phase 2: Decline or transitional phase
● Limiting factors slowing population growth
48. Phase 3
Plateau or stationary phase
● No growth
● The limiting factors balance the population’s capacity
to increase
● The population reaches the Carrying Capacity (K) of
the environment
● Added limiting factors will lower K
● Removing a limiting factor will raise K
51. Carrying Capacity- the maximum
population size that can be
supported by the available
resources
There can only be as many
organisms as the environmental
resources can support
Other factors that affect population growth
54. PREDICTING POPULATION GROWTH
● Model:
● A hypothetical population that has key characteristics of
the real population being studied.
● Used by demographers to predict how a population will
grow.
55. PREDICTING POPULATION GROWTH, con’t
● Nearly all populations will tend to grow exponentially
as long as there are resources available.
● Two of the most basic factors that affect the rate of
population growth are the birth rate, and the death rate.
● r(rate of growth)=birth rate – death rate
56. Growth Models
● Studying about the behaviour and pattern of different
animals can help us to learn a lesson on how to control
the human population growth.
● There are following two models of population growth:
● Exponential Growth:
● Logistic Growth:
57. ● Availability of resources (food and space) is essential for the
growth of population.
● The unlimited availability results in population exponential.
● The increase or decrease in population density (N) at a unit time
period (t) is calculated as (dN/dt)
● Let dN/dt = (b – d) N
● Let (b-d) = r, then, dN/dt = rN
● Where, N is population size,
● b is birth per capita
● d is death per capita,
● t is time period
● r is intrinsic rate of natural increase.
● r, is an important parameter that assess the effects of biotic and
abiotic factors on population growth. It is different for different
organisms.
59. Logistic Growth:
● Practically, no population of any species in nature has
unlimited resources at its disposal. This leads to
competition among the individuals and the survival of
the fittest.
● Therefore, a given habitat has enough resources to
support a maximum possible number, beyond which
no further growth is possible.
● This is called the carrying capacity (K) for that species
in that habitat.
60. When N is plotted in relation to
time t, the logistic growth show
sigmoid curve and is also called
Verhulst-Pearl Logistic Growth
and is calculated as
dN/dt = rN (K – N/K)
Where, N is population density at
time t
K is carrying capacity
r is intrinsic rate of natural increase.
This model is more realistic in
nature because no population
growth can sustain exponential
growth indefinitely as there will
be completion for the basic needs.
Human population growth curve
will become S-shaped, if efforts are
being made throughout the world to
reduce the rate of population growth
and make it stationary.
Although several species may share a habitat they each have their own niche. A niche is a very narrow range where a species fits within a habitat.
Example:
Supposing 10 tigers (M) were radio collared and was allowed to mix with the population. After a certain time period 23 tigers (n) came to a particular site for licking salts. Of these 23 tigers, the numbers of radio collared animals were 4(x). Thus, the density of tiger population is that area is estimated to be
N = 23(10)/4 = 58
However, the estimate of tiger population is generally done by the pug mark method.
Many techniques and methodology for population sampling has been tried. This sampling methodology is itself an important field of research. The other methods generally used are minimum known alive (MKA) total counts, quadrate or transect sampling, removal sampling, plotless methods etc.
TYPES:-
Cohort or age-specific or dynamic life tables: data are collected by following a cohort throughout its life. This is rarely possible with natural populations of animals. Note: a cohort is a group of individuals all born during the same time interval.
Static or time-specific life tables: age-distribution data are collected from a cross-section of the population at one particular time or during a short segment of time, such as through mortality data. Resulting age-specific data are treated as if a cohort was followed through time (i.e., the number of animals alive in age class x must be less than alive in age class x-1). Because of variation caused by small samples, data-smoothing techniques may be required (see Caughley 1977).
Composite - data are gathered over a number of years and generations using cohort or time-specific techniques. This method allows the natural variability in rates of survival to be monitored and assessed (Begon and Mortimer 1986).
Although several species may share a habitat they each have their own niche. A niche is a very narrow range where a species fits within a habitat.