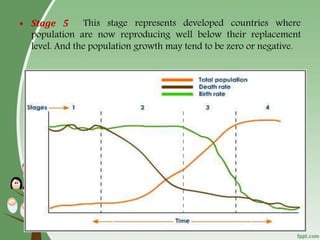
S.S.A.S.I.T, SURAT GTU
Preparedby:-
Miss. Khushbuk. shah
Asst. prof
S.S.A.S.I.T, SURAT
1
Population:-
It is define as a group of organisms of the same species
occupying a particular space.
Population density:-
It is defined as a numbers of individuals per unit area per
unit volume of environment.
2
INTRODUCTION
3
Environmental Factors Governing Settlement
• The environment has considerably affected human being right from
his evolution. The environment effects human in many ways. The
environment has affected humans settlements in many ways. The
main factors which affect the distribution of population and human
settlement are
• 1) Relief of a land
• 2)Climate
• 3) Soils
• 4) Mineral Deposits
• 5) Water Supply
• Environment plays an Important role in deciding population
distribution, density, settlement type and patterns.
Over Population
4
• Over population is a condition when an organism number
exceeds the carrying capacity of its habitat.
• Over population is not a function of size or density it is
determined using the ratio of population to available
resources.
5
Reasons for over population
1. Increase In Birth Rate
2. Decline In Mortality Rate Due To Medical Advance
3. Increase In Immigration
4. Illiteracy
6
Increase in birth rate: Birth rate is the
no of child born /1000 people/year. With
the advent of better medical facility,
economic prosperity, social beliefs the
birth rate increases which causes increase
in population.
Decline In Mortality Rate Due To
Medical Advance: Death rate is
expressed in units of deaths/ 1000
persons/year. The development of
technologies has resulted in decrease in
death rate. Good and clean atmosphere,
sufficient nutrients, better medial facility
has provided longer and healthy life. New
inventions of medicines, awareness
towards better health and control of
various diseases like TB, Small pox,
cancer, has resulted in increase of
population.
7
• Increase Immigration: The
countries like USA where the
development had brought good
environment for citizens to stay, earn ,
and enjoy had resulted in increase in
immigration.
• Illiteracy: Due to some social
beliefs, lack of knowledge towards
family planning, desire for male
child are some of the factors which
causes increase in population.
If the human population increases rapidly ,it is termed as
population explosion.
If the human population decreases suddenly ,it is termed as
population crash.
India at present is passing through the stage of population
explosion.
The population of India around 350 million in 1947 has now
crossed one billion after 2003. It is estimated to reach 1.45 billion
by 2025 and 1.80 billions by 2050 to become number one over
taking china.
8
Population explosion
Effects of population explosion
1) Overstress of natural resources:
 population explosion causes depletion of natural resources like
water,land,forest etc.
 The encroachment of land for human needs like roads, industrial
area,houses,will decrease the fertile land available for crop
production.
2) Increase on demand of food ,Water and services:
 Population explosion causes scarcity of food and water.
 Shortage in agriculture land and water may also cause starvation
in some parts.
 Population explosion creates problems like rush in transportation
facilities education facilities, medical facilities,etc.
9
3) Generation of huge quantity of waste:
Population explosion results in excessive generation of domestic
wastewater, industrial effluents and solid waste.
This creates disposal problems resulting in water, air and land
pollution.
4) Other effects:
 Decrease in agricultural land
 Reduction in living standard of people
 Increase in migration rate
 Increase in unemployment
 Low per capita income
 Energy crisis
 High crime rate
 Development of slump areas
 Deterioration in the quality of environment
 Increase in poverty
10
1111
 Population Explosion
The enormous increase in population due to low death
rate and high birth rate is termed as population
explosion. The human population is not increasing at a
uniform rate in all parts of the world.
Population Growth
• Population growth is the change in population overtime and
can be quantified as the change in number of individuals in a
population per unit time of measurement.
• According to population clock every second on an average 4-5
children's are born, and 2 persons die, thus resulting increase
is of 2.5 persons every second. That means every hour there is
a growth of 9000 persons and in one day population increase
is of the order of 2,14,000
Current Population of India in 2012 - 1,170,938,000
(1.17,938 billion)
12
=> Population Growth rate is the fractional rate at which
the number of individuals in a population increases.
=> Population Growth Rate = ( Population at the end
of period - Population at
the beginning of the
period)
------------------------
Population at the
beginning of period
13
Human Population History
14
15
16
17
The Exponential Growth
• In case of Exponential growth, the rate of change of population
is directly proportional to the size of population at that time.
• If in a specified time ‘t’ the population size be Nt the population
growth or rate of change of population can be expressed as
18
19
20
Theories for population growth
There are two very important theories on population growth:-
1. Malthusian theory
2. Marxian theory
•English economist and demographer Dr. Robert Malthus gave this
theory, according to this theory.
• In his first Proposition Population if unchecked, increases at a faster
geometric rate (i.e. 1,2,4,8,16…) whereas the food supply grow at an
arithmetic rate (i.e. 1,2,4,6,8…) . The necessary effect of these two
different rate of increase will be striking as after sometime the
population will outgrow the food supply and people will starve and
undergo misery.
21
22
• In the second preposition Malthus suggests that the food is essential
for the survival of the man and that the size of population is
determined by availability of the food. Greater is the production of
food larger the size of population which can be sustained, this
result Less production per capita. This will ultimately lead to a
situation where the number of people will out weight the food
production and the population will plunge into starvation &
misery.
• In the third proposition, Malthus concludes that the tendency of
the population to indefinite increase may be controlled by two
types of checks viz.
• Preventive checks: reduce birth rate
• Positive checks: Increase death rate
• Preventive checks:
• The preventive checks are moral restrained adopted by the people
voluntarily. Such checks includes marrying late or not at all. It
reduces the birth rate.
23
• The positive checks are more and are natural. If people do not
act on their own, the nature acts in the form of famines, wars,
outbreak of diseases. They increase in death rate.
24
Population grows in quick
geometric progression
(2,4,8,16,32)
Food supply grows in
slow arithmetic
progression
(2,4,6,8,10)
Imbalance between population and food supply
Corrective measure of imbalance
Positive
checks
Preventive
checks
Malthusian Theory of population
Malthus Theory of “Overpopulation”
25
•This is the modern theory of population, propagated by modern
economist such as Side wide, Cannon, Dalton, and Robbins.
•Optimum means the best or the ideal. Optimum population means
the ideal population or the ideal number of population the nation
should have relative to the natural resources, stock of capital
investment and state of technology. In other words, optimum
population is that size of population at which the per capita output
is the highest.
26
27
• A country is said to be under-populated if the population is less
than the optimum and over-populated if it is more than the
optimum. Initially population is small relative to availability of
resources hence due to specialization and efficient use of resources
per-capita output/ income increases to a maximum. This size of
population is the optimum population.
• Beyond this point, if population increases, the country will become
over populated and per capita output will start decreasing.
Overpopulation leads to low living standards, frustration and
unemployment.
• Both under and overpopulation have short comings . It is the
optimum population which is best suited for a country. The
optimum population is not static number as it keep on changing
with discovery of new resources and technological developments.
28
29
Population Forecasting
• To Design various infrastructures facilities like water supply
scheme, sewage disposal unit, the basic record of current
population and future population is must.
• Therefore an estimate of future population is necessary for
designing this facilities.
30
Various Population Forecasting
1. Arithmetic Increase method
2. Geometric Increase method
3. Incremental Increase method
4. Decrease rate of growth method
5. Graphical extension method
6. Graphical Comparison Method
7. Zoning method
8. Ratio and correlation method
9. Growth composition analysis method
31
Arithmetic Increase Method
• This method is based on the assumption that population increase at a
constant rate.
• Thus future population is given as
• Pn= P+ n I
• Where,
• P n= Future population
• P = Population at present
• n= No of decades between now and future
• I= average increment for a decade
• This method of population forecasting is used for large cities which
have reached their saturation population.
32
Geometric Increase Method
In this method per decade percentage increase or
growth rate is assumed to be constant and the increase
is compounded over the existing population every
decade.
Where,
• Pn= Future Population
• Po= Initial Population
• r= rate of growth
• N= no of decades
33
Incremental Increase Method
• In this method per decade growth rate is not assumed to be
constant as in the arithmetic or geometric increase method but it is
progressively increased or decreased depending on past data
• P n= P+ n I +
• P n= Future Population
• P = Initial Population
• I= Average increase in population
• Y= Average of Incremental Increase
• n= no of decades
34
The Demographic Transition theory
• This Method is used to represent the process of shift from
high birth rates and death rates to low birth rates and
death rates as a part of the economical development of a
country from a pre-industrial to an industrialized
economy. It is based on an interpretation begun in 1929
by American demographer Warren Thomson who
observed changes in birth and death rates in industrialized
society over the past 200 years.
35
• This method represents that there is a relationship between the
population change and industrial growth with time.
• Stage 1 In pre-industrial society , death rates and birth rates
were both high and fluctuated rapidly accordingly to natural
events, such as droughts, and diseases, to produce a relatively
constant and young population.
• Stage 2 In developing countries the death rate drops rapidly
due to improvement in food supply and sanitation, which
increases life span and reduces diseases, basic health care units
and the countries in this stage experiences great increase in
population.
• Stage 3 In this stage birth rate falls due to increase in status
and education of women, increase in parental investments.
Population growth begins to level off.
• Stage 4 There are both low birth rates and low death rates.
Birth rate has dropped due to change and life style and due to
medical advances and death rate has dropped too. As a result
total population is high and stable.
36
• Stage 5 This stage represents developed countries where
population are now reproducing well below their replacement
level. And the population growth may tend to be zero or negative.
37
1. Birth Rate- Number of babies produced per 1000 People per year
2. Mortality- Death rate per 1000 people.
3.Infant mortality rate-
•It is an important parameter affecting future growth of a
population.
•It is the percentage of infants died out of those born in a year.
•Although this rate has declined in the last 50 years, but the
pattern differs widely in developed and developing countries.
Population structure features
38
4. Total Fertility rates (TFR)
•It is one of the key measures of a nation’s population growth.
•TFR is defined as the average number of children that would be born to
a woman in her lifetime if the age specific birth rates remain constant.
•The value of TFR varies from 1.9 in developed nations to 4.7 in
developing nations.
5. Age and sex structure-
•Age structure is the graphical representation of data indicating either
number of people .
•We get 3 types of age pyramids in different countries.
• pyramid shaped
• bell shaped
• urn shaped
•Sex ratio is the no. of females per 1000 males.
39
Age Structure
Pyramid shaped (India) Bell shaped (France) Urn shaped
(Germany)
Education
incentives
Government benefits
Publicity
40
Control of Population Growth
41
• Education: Literacy plays a major role
in checking population growth.
Improving the literacy rate particularly
in woman, can help in population
control.
• Incentives: Certain Incentives in the
form of government benefits,
scholarships, to children, subsidies,
exemptions from tax, promotion In
jobs, should be offered.
42
• Government Benefits: The government benefits should be
allowed only for those having smaller families.
• Publicity: The Importance of birth control methods for family
planning, the significance of small families and related
information should be published through various media,
schools, books, and other sources.
43
Urbanization
•Growth in the proportion of a population living in urban areas
is called urbanization.
•In 1950, 29 % people lived in urban areas.
•By 2000 47% people lived in urban areas.
•By 2030 estimates show that this will grows to 61%.
44
Environmental and socio economic problems due to Urbanization
1. Demand For Dwelling Place
2. Overcrowding
3. Pressure On Medical And Other Services
4. Increase Crime
5. Air Pollution
6. Exploitation Of Ground And Surface
Resources
7. Generation Of Solid And Liquid Wastes
45

Human population and environment

  • 1.
    S.S.A.S.I.T, SURAT GTU Preparedby:- Miss.Khushbuk. shah Asst. prof S.S.A.S.I.T, SURAT 1
  • 2.
    Population:- It is defineas a group of organisms of the same species occupying a particular space. Population density:- It is defined as a numbers of individuals per unit area per unit volume of environment. 2 INTRODUCTION
  • 3.
    3 Environmental Factors GoverningSettlement • The environment has considerably affected human being right from his evolution. The environment effects human in many ways. The environment has affected humans settlements in many ways. The main factors which affect the distribution of population and human settlement are • 1) Relief of a land • 2)Climate • 3) Soils • 4) Mineral Deposits • 5) Water Supply • Environment plays an Important role in deciding population distribution, density, settlement type and patterns.
  • 4.
    Over Population 4 • Overpopulation is a condition when an organism number exceeds the carrying capacity of its habitat. • Over population is not a function of size or density it is determined using the ratio of population to available resources.
  • 5.
    5 Reasons for overpopulation 1. Increase In Birth Rate 2. Decline In Mortality Rate Due To Medical Advance 3. Increase In Immigration 4. Illiteracy
  • 6.
    6 Increase in birthrate: Birth rate is the no of child born /1000 people/year. With the advent of better medical facility, economic prosperity, social beliefs the birth rate increases which causes increase in population. Decline In Mortality Rate Due To Medical Advance: Death rate is expressed in units of deaths/ 1000 persons/year. The development of technologies has resulted in decrease in death rate. Good and clean atmosphere, sufficient nutrients, better medial facility has provided longer and healthy life. New inventions of medicines, awareness towards better health and control of various diseases like TB, Small pox, cancer, has resulted in increase of population.
  • 7.
    7 • Increase Immigration:The countries like USA where the development had brought good environment for citizens to stay, earn , and enjoy had resulted in increase in immigration. • Illiteracy: Due to some social beliefs, lack of knowledge towards family planning, desire for male child are some of the factors which causes increase in population.
  • 8.
    If the humanpopulation increases rapidly ,it is termed as population explosion. If the human population decreases suddenly ,it is termed as population crash. India at present is passing through the stage of population explosion. The population of India around 350 million in 1947 has now crossed one billion after 2003. It is estimated to reach 1.45 billion by 2025 and 1.80 billions by 2050 to become number one over taking china. 8 Population explosion
  • 9.
    Effects of populationexplosion 1) Overstress of natural resources:  population explosion causes depletion of natural resources like water,land,forest etc.  The encroachment of land for human needs like roads, industrial area,houses,will decrease the fertile land available for crop production. 2) Increase on demand of food ,Water and services:  Population explosion causes scarcity of food and water.  Shortage in agriculture land and water may also cause starvation in some parts.  Population explosion creates problems like rush in transportation facilities education facilities, medical facilities,etc. 9
  • 10.
    3) Generation ofhuge quantity of waste: Population explosion results in excessive generation of domestic wastewater, industrial effluents and solid waste. This creates disposal problems resulting in water, air and land pollution. 4) Other effects:  Decrease in agricultural land  Reduction in living standard of people  Increase in migration rate  Increase in unemployment  Low per capita income  Energy crisis  High crime rate  Development of slump areas  Deterioration in the quality of environment  Increase in poverty 10
  • 11.
    1111  Population Explosion Theenormous increase in population due to low death rate and high birth rate is termed as population explosion. The human population is not increasing at a uniform rate in all parts of the world.
  • 12.
    Population Growth • Populationgrowth is the change in population overtime and can be quantified as the change in number of individuals in a population per unit time of measurement. • According to population clock every second on an average 4-5 children's are born, and 2 persons die, thus resulting increase is of 2.5 persons every second. That means every hour there is a growth of 9000 persons and in one day population increase is of the order of 2,14,000 Current Population of India in 2012 - 1,170,938,000 (1.17,938 billion) 12
  • 13.
    => Population Growthrate is the fractional rate at which the number of individuals in a population increases. => Population Growth Rate = ( Population at the end of period - Population at the beginning of the period) ------------------------ Population at the beginning of period 13
  • 14.
  • 15.
  • 16.
  • 17.
    17 The Exponential Growth •In case of Exponential growth, the rate of change of population is directly proportional to the size of population at that time. • If in a specified time ‘t’ the population size be Nt the population growth or rate of change of population can be expressed as
  • 18.
  • 19.
  • 20.
    20 Theories for populationgrowth There are two very important theories on population growth:- 1. Malthusian theory 2. Marxian theory
  • 21.
    •English economist anddemographer Dr. Robert Malthus gave this theory, according to this theory. • In his first Proposition Population if unchecked, increases at a faster geometric rate (i.e. 1,2,4,8,16…) whereas the food supply grow at an arithmetic rate (i.e. 1,2,4,6,8…) . The necessary effect of these two different rate of increase will be striking as after sometime the population will outgrow the food supply and people will starve and undergo misery. 21
  • 22.
    22 • In thesecond preposition Malthus suggests that the food is essential for the survival of the man and that the size of population is determined by availability of the food. Greater is the production of food larger the size of population which can be sustained, this result Less production per capita. This will ultimately lead to a situation where the number of people will out weight the food production and the population will plunge into starvation & misery. • In the third proposition, Malthus concludes that the tendency of the population to indefinite increase may be controlled by two types of checks viz. • Preventive checks: reduce birth rate • Positive checks: Increase death rate • Preventive checks: • The preventive checks are moral restrained adopted by the people voluntarily. Such checks includes marrying late or not at all. It reduces the birth rate.
  • 23.
    23 • The positivechecks are more and are natural. If people do not act on their own, the nature acts in the form of famines, wars, outbreak of diseases. They increase in death rate.
  • 24.
    24 Population grows inquick geometric progression (2,4,8,16,32) Food supply grows in slow arithmetic progression (2,4,6,8,10) Imbalance between population and food supply Corrective measure of imbalance Positive checks Preventive checks Malthusian Theory of population
  • 25.
    Malthus Theory of“Overpopulation” 25
  • 26.
    •This is themodern theory of population, propagated by modern economist such as Side wide, Cannon, Dalton, and Robbins. •Optimum means the best or the ideal. Optimum population means the ideal population or the ideal number of population the nation should have relative to the natural resources, stock of capital investment and state of technology. In other words, optimum population is that size of population at which the per capita output is the highest. 26
  • 27.
    27 • A countryis said to be under-populated if the population is less than the optimum and over-populated if it is more than the optimum. Initially population is small relative to availability of resources hence due to specialization and efficient use of resources per-capita output/ income increases to a maximum. This size of population is the optimum population. • Beyond this point, if population increases, the country will become over populated and per capita output will start decreasing. Overpopulation leads to low living standards, frustration and unemployment. • Both under and overpopulation have short comings . It is the optimum population which is best suited for a country. The optimum population is not static number as it keep on changing with discovery of new resources and technological developments.
  • 28.
  • 29.
    29 Population Forecasting • ToDesign various infrastructures facilities like water supply scheme, sewage disposal unit, the basic record of current population and future population is must. • Therefore an estimate of future population is necessary for designing this facilities.
  • 30.
    30 Various Population Forecasting 1.Arithmetic Increase method 2. Geometric Increase method 3. Incremental Increase method 4. Decrease rate of growth method 5. Graphical extension method 6. Graphical Comparison Method 7. Zoning method 8. Ratio and correlation method 9. Growth composition analysis method
  • 31.
    31 Arithmetic Increase Method •This method is based on the assumption that population increase at a constant rate. • Thus future population is given as • Pn= P+ n I • Where, • P n= Future population • P = Population at present • n= No of decades between now and future • I= average increment for a decade • This method of population forecasting is used for large cities which have reached their saturation population.
  • 32.
    32 Geometric Increase Method Inthis method per decade percentage increase or growth rate is assumed to be constant and the increase is compounded over the existing population every decade. Where, • Pn= Future Population • Po= Initial Population • r= rate of growth • N= no of decades
  • 33.
    33 Incremental Increase Method •In this method per decade growth rate is not assumed to be constant as in the arithmetic or geometric increase method but it is progressively increased or decreased depending on past data • P n= P+ n I + • P n= Future Population • P = Initial Population • I= Average increase in population • Y= Average of Incremental Increase • n= no of decades
  • 34.
    34 The Demographic Transitiontheory • This Method is used to represent the process of shift from high birth rates and death rates to low birth rates and death rates as a part of the economical development of a country from a pre-industrial to an industrialized economy. It is based on an interpretation begun in 1929 by American demographer Warren Thomson who observed changes in birth and death rates in industrialized society over the past 200 years.
  • 35.
    35 • This methodrepresents that there is a relationship between the population change and industrial growth with time. • Stage 1 In pre-industrial society , death rates and birth rates were both high and fluctuated rapidly accordingly to natural events, such as droughts, and diseases, to produce a relatively constant and young population. • Stage 2 In developing countries the death rate drops rapidly due to improvement in food supply and sanitation, which increases life span and reduces diseases, basic health care units and the countries in this stage experiences great increase in population. • Stage 3 In this stage birth rate falls due to increase in status and education of women, increase in parental investments. Population growth begins to level off. • Stage 4 There are both low birth rates and low death rates. Birth rate has dropped due to change and life style and due to medical advances and death rate has dropped too. As a result total population is high and stable.
  • 36.
    36 • Stage 5This stage represents developed countries where population are now reproducing well below their replacement level. And the population growth may tend to be zero or negative.
  • 37.
    37 1. Birth Rate-Number of babies produced per 1000 People per year 2. Mortality- Death rate per 1000 people. 3.Infant mortality rate- •It is an important parameter affecting future growth of a population. •It is the percentage of infants died out of those born in a year. •Although this rate has declined in the last 50 years, but the pattern differs widely in developed and developing countries. Population structure features
  • 38.
    38 4. Total Fertilityrates (TFR) •It is one of the key measures of a nation’s population growth. •TFR is defined as the average number of children that would be born to a woman in her lifetime if the age specific birth rates remain constant. •The value of TFR varies from 1.9 in developed nations to 4.7 in developing nations. 5. Age and sex structure- •Age structure is the graphical representation of data indicating either number of people . •We get 3 types of age pyramids in different countries. • pyramid shaped • bell shaped • urn shaped •Sex ratio is the no. of females per 1000 males.
  • 39.
    39 Age Structure Pyramid shaped(India) Bell shaped (France) Urn shaped (Germany)
  • 40.
  • 41.
    41 • Education: Literacyplays a major role in checking population growth. Improving the literacy rate particularly in woman, can help in population control. • Incentives: Certain Incentives in the form of government benefits, scholarships, to children, subsidies, exemptions from tax, promotion In jobs, should be offered.
  • 42.
    42 • Government Benefits:The government benefits should be allowed only for those having smaller families. • Publicity: The Importance of birth control methods for family planning, the significance of small families and related information should be published through various media, schools, books, and other sources.
  • 43.
    43 Urbanization •Growth in theproportion of a population living in urban areas is called urbanization. •In 1950, 29 % people lived in urban areas. •By 2000 47% people lived in urban areas. •By 2030 estimates show that this will grows to 61%.
  • 44.
    44 Environmental and socioeconomic problems due to Urbanization 1. Demand For Dwelling Place 2. Overcrowding 3. Pressure On Medical And Other Services 4. Increase Crime 5. Air Pollution 6. Exploitation Of Ground And Surface Resources 7. Generation Of Solid And Liquid Wastes
  • 45.