The document discusses various topics related to population dynamics, including:
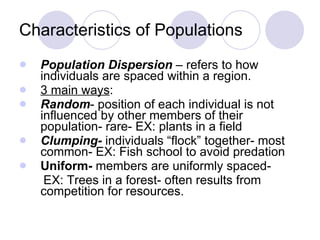
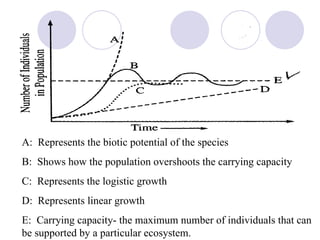
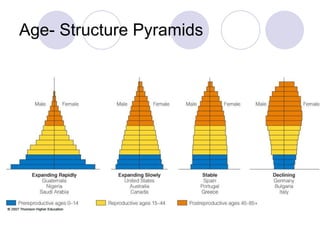
1. Characteristics of populations such as population density, dispersion, growth, and carrying capacity.
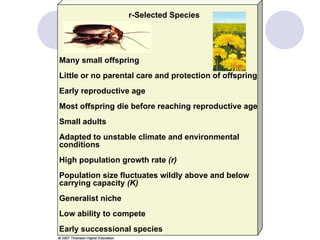
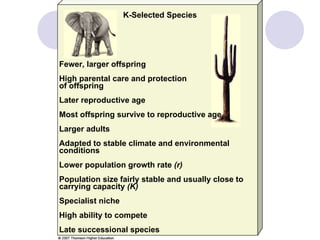
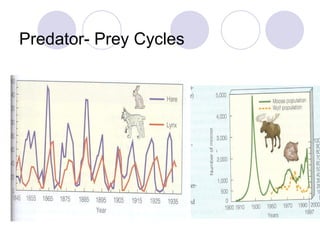
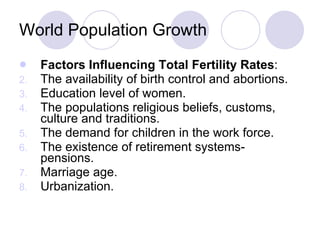
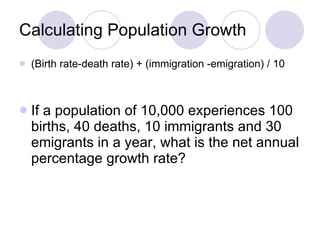
2. Factors that influence population growth such as resources, reproductive strategies, and population cycles.
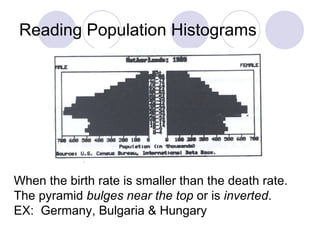
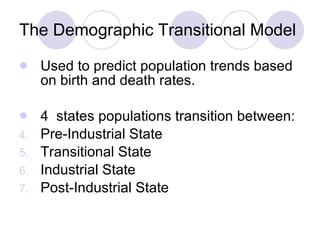
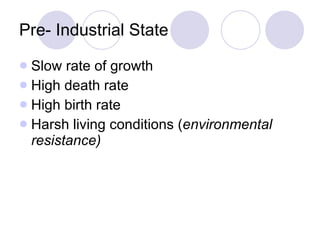
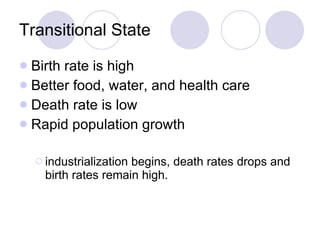
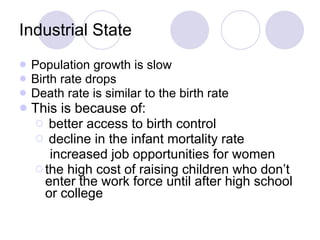
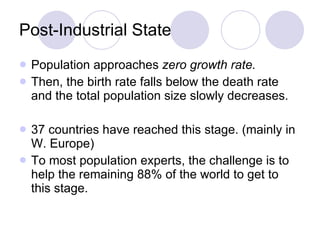
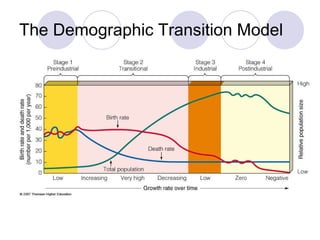
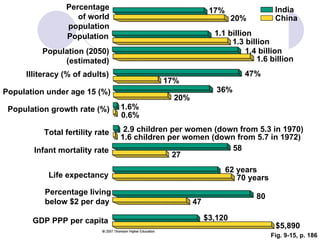
3. Models of human population growth including the demographic transition model.
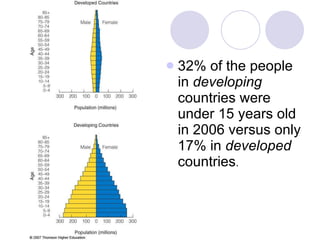
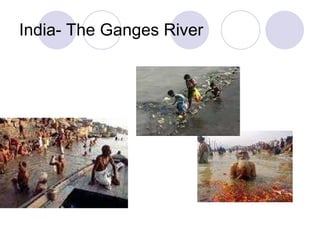
4. Challenges facing developing countries in slowing population growth.