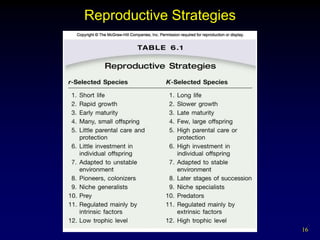
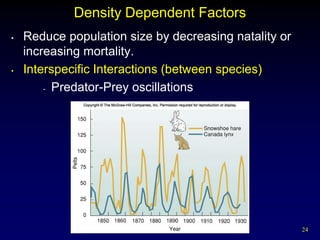
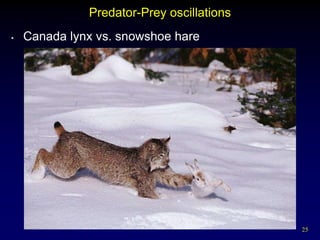
Population
 Biology:
 IB TOPIC 5.3


                1
Biotic Potential
•   Biotic potential refers to unrestrained biological
    reproduction. Biological organisms can produce
    enormous numbers of offspring if their reproduction
    is unrestrained.

•   Constraints include:
     Scarcity of resources

     Competition

     Predation

     Disease


                                                      4
Dynamics of Population Growth
•   Population - all the members of a single species
    living in a specific area at the same time

•   Exponential Growth - growth at a constant rate of
    increase per unit time (geometric) ; has no limit


                    dN/dt = rN
    The change in the number of individuals (dN) per
    change in time (dt) equals the rate of growth (r)
    times the number of individuals in the population
    (N). r is often called the intrinsic capacity for
    increase.
                                                        6
7
Exponential Growth
•   Number of individuals added to a population at the
    beginning of exponential growth is relatively small.
    But numbers increase quickly because a %
    increase leads to a much larger increase as the
    population grows.

•   J curve when the equation
•    is graphed

•   Exponential growth is a simple, idealized model. In
    the real world there are limits to growth.

                                                           8
Carrying Capacity
•   Carrying capacity (K) - limit of sustainability that an
    environment has in relation to the size of a species
    population
•   Overshoot - population exceeds the carrying
    capacity of the environment and death rates rise as
    resources become scarce
•   Population crash - growth becomes negative and
    the population decreases suddenly
•   Boom and bust - population undergoes repeated
    cycles of overshooting followed by crashing

                                                          9
10
Growth to a Stable Population
•   Logistic Growth - growth rates regulated by internal
    and external factors until coming into equilibrium
    with environmental resources
      dN/dt = r N (1 - N/K)

      Terms have the same definitions as previous

       slide, with K added to indicate carrying capacity.
      Growth rate slows as population approaches

       carrying capacity.
      Sigmoid (S-shaped) growth curve when the

       equation is graphed

                                                        11
Sigmoid Growth Curve or S Curve


                                  12
Factors Affecting Population Growth

•   External factors include habitat quality, food
    availability and interaction with other organisms.
•   Internal factors include physiological stress due to
    overcrowding, maturity, body size, and hormonal
    status.
•   These factors are density-dependent, meaning as
    population size increases the effect intensifies.
•   Density independent effects (drought, an early
    frost, flooding, landslides, etc.) also may decrease
    population size.

                                                           14
r and K Selected Species

•   r selected species rely upon
    a high reproductive rate to
    overcome the high mortality of
    offspring with little or no
    parental care. Example: A
    clam releases a million eggs in
    a lifetime.


•   K selected species have few
    offspring but more parental
    care. Example: An elephant
    reproduces every 4 or 5 years.

                                      15
Reproductive Strategies


                          16
Factors that Increase Population
•   Natality - production of new individuals
     Fecundity - physical ability to reproduce

     Fertility - measure of actual number of offspring
      produced

•   Immigration - organisms introduced into new
    ecosystems
      Dispersal of organisms by wind or water currents
       over long distances. Sometimes carried by
       animals or on rafts of drifting vegetation.


                                                          17
Factors that Decrease Population
•   Mortality - death rate
     Survivorship - percentage of cohort surviving

      to a certain age
     Life expectancy - probable number of years of

      survival for an individual of a given age
       - Increases as humans age. By older age, most

         individuals destined to die early have already
         done so.
       - Has risen in nations/areas with good

         nutrition, sanitation and medical care
       - Women live longer than men.

                                                     18
Life Span
•   Life span - longest period of life reached by a given
    type of organism
      Bristlecone pine lives 4,600 years.

      Human maximum lifespan is 120 years.

      Microbes may live a few hours.


•   Differences in relative longevity among species are
    shown as survivorship curves.


                                                        19
Survivorship Curves
•   Four general patterns:
      Full physiological life span if organism survives

       childhood
        -  Example: Humans in the U.S.
      Probability of death unrelated to age

        - Example: Sea gull

      Mortality peaks both early and late in life.

        - Example: Deer

      Mortality peaks early in life. Example: Tree


                                                           20
Survivorship Curves


                      21
Factors that Decrease Population


•   The last factor in our list of factors that decrease
    population is emigration, the movement of
    members out of a population.
      Many organisms have specific mechanisms to

       facilitate migration into new areas.


                                                           22
Factors that Regulate Population Growth

•   Intrinsic factors - operate within or between
    individual organisms in the same species
•   Extrinsic factors - imposed from outside the
    population
•   Biotic factors - Caused by living organisms. Tend to
    be density dependent.
•   Abiotic factors - Caused by non-living
    environmental components. Tend to be density
    independent, and do not really regulate population
    although they may be important in increasing or
    decreasing numbers. Example: Rainfall, storms

                                                       23
Density Dependent Factors
•   Reduce population size by decreasing natality or
    increasing mortality.
•   Interspecific Interactions (between species)
        - Predator-Prey oscillations


                                                       24
Predator-Prey oscillations
•   Canada lynx vs. snowshoe hare


                                           25
Density Dependent Factors Continued
•   Intraspecific Interactions - competition for resources
    by individuals within a population
      As population density approaches the carrying

       capacity, one or more resources becomes
       limiting.
•   Control of access to resources by territoriality;
    owners of territory defend it and its resources
    against rivals.
•   Stress-related diseases occur in some species
    when conditions become overcrowded.
      become overcrowded.

                                                        26
Density Dependent Factors: A Case Study
•   Desert Locust (Schistocerca gregarius) – Usually
    solitary creatures, like grasshoppers
•   Desert storms (~once every 10 years) cause
    vegetation to flourish – increases locust
    reproduction
•   Stress and high population causes physiological
    and behavioral changes
      Stop reproducing

      Grow longer wings

      Group together in swarms


                                                       27
Density Dependent Factors: A Case Study
•   Desert Locust (Schistocerca gregarius)


                                              28
Density Dependent Factors: A Case Study
•   Desert Locust (Schistocerca gregarius)
     Clouds of locusts travel as much as 100km per

      day
     A single locust can consume its own body weight

      in a day
     Swarm can cover 1,200 km2 and contain 50-100

      billion individuals
       - Strip pastures, denude trees, and destroy

          crops
       - Consume as much food in a day as 500,000

          people need in a year
                                                    29
Density Dependent Factors: A Case Study


                                          30
Conservation Biology
•   Critical question in conservation biology is the
    minimum population size of a species required for
    long term viability.

•   Special case of islands
     Island biogeography - small islands far from a
      mainland have fewer terrestrial species than
      larger, closer islands
     MacArthur and Wilson proposed that species
      diversity is a balance between colonization and
      extinction rates.

                                                        31
Conservation Genetics
•   In a large population, genetic diversity tends to be
    preserved. A loss/gain of a few individuals has little
    effect on the total gene pool.
•   However, in small populations small events can
    have large effects on the gene pool.
•   Genetic Drift
      Change in gene frequency due to a random

       event
•   Founder Effect
      Few individuals start a new population.


                                                        32
Conservation Genetics
•   Demographic bottleneck - just a few members of a
    species survive a catastrophic event such as a
    natural disaster

•   Founder effects and demographic bottlenecks
    reduce genetic diversity. There also may be
    inbreeding due to small population size.
    Inbreeding may lead to the expression of
    recessive genes that have a deleterious effect
    on the population.


                                                       33
34
Genetic Drift


                35
Population Viability Analysis
•   Minimum Viable Population is the minimum
    population size required for long-term survival of a
    species.
      The number of grizzly bears in North America
       dropped from 100,000 in 1800 to 1,200 now.
       The animal’s range is just 1% of what is once
       was and the population is fragmented into 6
       separate groups.
      Biologists need to know how small the bear
       groups can be and still be viable in order to save
       the grizzly.


                                                        36
37
Metapopulations
•   Metapopulation - a collection of populations that
    have regular or intermittent gene flow between
    geographically separate units
      Source habitat - Birth rates are higher than death

       rates. Surplus individuals can migrate to new
       locations.
      Sink habitat - Birth rates are less than death

       rates and the species would disappear if not
       replenished from a source.


                                                       38
Metapopulation


                 39

Population biology

  • 1.
  • 2.
    Biotic Potential • Biotic potential refers to unrestrained biological reproduction. Biological organisms can produce enormous numbers of offspring if their reproduction is unrestrained. • Constraints include:  Scarcity of resources  Competition  Predation  Disease 4
  • 3.
    Dynamics of PopulationGrowth • Population - all the members of a single species living in a specific area at the same time • Exponential Growth - growth at a constant rate of increase per unit time (geometric) ; has no limit dN/dt = rN The change in the number of individuals (dN) per change in time (dt) equals the rate of growth (r) times the number of individuals in the population (N). r is often called the intrinsic capacity for increase. 6
  • 4.
  • 5.
    Exponential Growth • Number of individuals added to a population at the beginning of exponential growth is relatively small. But numbers increase quickly because a % increase leads to a much larger increase as the population grows. • J curve when the equation • is graphed • Exponential growth is a simple, idealized model. In the real world there are limits to growth. 8
  • 6.
    Carrying Capacity • Carrying capacity (K) - limit of sustainability that an environment has in relation to the size of a species population • Overshoot - population exceeds the carrying capacity of the environment and death rates rise as resources become scarce • Population crash - growth becomes negative and the population decreases suddenly • Boom and bust - population undergoes repeated cycles of overshooting followed by crashing 9
  • 7.
  • 8.
    Growth to aStable Population • Logistic Growth - growth rates regulated by internal and external factors until coming into equilibrium with environmental resources  dN/dt = r N (1 - N/K)  Terms have the same definitions as previous slide, with K added to indicate carrying capacity.  Growth rate slows as population approaches carrying capacity.  Sigmoid (S-shaped) growth curve when the equation is graphed 11
  • 9.
    Sigmoid Growth Curveor S Curve 12
  • 10.
    Factors Affecting PopulationGrowth • External factors include habitat quality, food availability and interaction with other organisms. • Internal factors include physiological stress due to overcrowding, maturity, body size, and hormonal status. • These factors are density-dependent, meaning as population size increases the effect intensifies. • Density independent effects (drought, an early frost, flooding, landslides, etc.) also may decrease population size. 14
  • 11.
    r and KSelected Species • r selected species rely upon a high reproductive rate to overcome the high mortality of offspring with little or no parental care. Example: A clam releases a million eggs in a lifetime. • K selected species have few offspring but more parental care. Example: An elephant reproduces every 4 or 5 years. 15
  • 12.
  • 13.
    Factors that IncreasePopulation • Natality - production of new individuals  Fecundity - physical ability to reproduce  Fertility - measure of actual number of offspring produced • Immigration - organisms introduced into new ecosystems  Dispersal of organisms by wind or water currents over long distances. Sometimes carried by animals or on rafts of drifting vegetation. 17
  • 14.
    Factors that DecreasePopulation • Mortality - death rate  Survivorship - percentage of cohort surviving to a certain age  Life expectancy - probable number of years of survival for an individual of a given age - Increases as humans age. By older age, most individuals destined to die early have already done so. - Has risen in nations/areas with good nutrition, sanitation and medical care - Women live longer than men. 18
  • 15.
    Life Span • Life span - longest period of life reached by a given type of organism  Bristlecone pine lives 4,600 years.  Human maximum lifespan is 120 years.  Microbes may live a few hours. • Differences in relative longevity among species are shown as survivorship curves. 19
  • 16.
    Survivorship Curves • Four general patterns:  Full physiological life span if organism survives childhood - Example: Humans in the U.S.  Probability of death unrelated to age - Example: Sea gull  Mortality peaks both early and late in life. - Example: Deer  Mortality peaks early in life. Example: Tree 20
  • 17.
  • 18.
    Factors that DecreasePopulation • The last factor in our list of factors that decrease population is emigration, the movement of members out of a population.  Many organisms have specific mechanisms to facilitate migration into new areas. 22
  • 19.
    Factors that RegulatePopulation Growth • Intrinsic factors - operate within or between individual organisms in the same species • Extrinsic factors - imposed from outside the population • Biotic factors - Caused by living organisms. Tend to be density dependent. • Abiotic factors - Caused by non-living environmental components. Tend to be density independent, and do not really regulate population although they may be important in increasing or decreasing numbers. Example: Rainfall, storms 23
  • 20.
    Density Dependent Factors • Reduce population size by decreasing natality or increasing mortality. • Interspecific Interactions (between species) - Predator-Prey oscillations 24
  • 21.
    Predator-Prey oscillations • Canada lynx vs. snowshoe hare 25
  • 22.
    Density Dependent FactorsContinued • Intraspecific Interactions - competition for resources by individuals within a population  As population density approaches the carrying capacity, one or more resources becomes limiting. • Control of access to resources by territoriality; owners of territory defend it and its resources against rivals. • Stress-related diseases occur in some species when conditions become overcrowded.  become overcrowded. 26
  • 23.
    Density Dependent Factors:A Case Study • Desert Locust (Schistocerca gregarius) – Usually solitary creatures, like grasshoppers • Desert storms (~once every 10 years) cause vegetation to flourish – increases locust reproduction • Stress and high population causes physiological and behavioral changes  Stop reproducing  Grow longer wings  Group together in swarms 27
  • 24.
    Density Dependent Factors:A Case Study • Desert Locust (Schistocerca gregarius) 28
  • 25.
    Density Dependent Factors:A Case Study • Desert Locust (Schistocerca gregarius)  Clouds of locusts travel as much as 100km per day  A single locust can consume its own body weight in a day  Swarm can cover 1,200 km2 and contain 50-100 billion individuals - Strip pastures, denude trees, and destroy crops - Consume as much food in a day as 500,000 people need in a year 29
  • 26.
  • 27.
    Conservation Biology • Critical question in conservation biology is the minimum population size of a species required for long term viability. • Special case of islands  Island biogeography - small islands far from a mainland have fewer terrestrial species than larger, closer islands  MacArthur and Wilson proposed that species diversity is a balance between colonization and extinction rates. 31
  • 28.
    Conservation Genetics • In a large population, genetic diversity tends to be preserved. A loss/gain of a few individuals has little effect on the total gene pool. • However, in small populations small events can have large effects on the gene pool. • Genetic Drift  Change in gene frequency due to a random event • Founder Effect  Few individuals start a new population. 32
  • 29.
    Conservation Genetics • Demographic bottleneck - just a few members of a species survive a catastrophic event such as a natural disaster • Founder effects and demographic bottlenecks reduce genetic diversity. There also may be inbreeding due to small population size. Inbreeding may lead to the expression of recessive genes that have a deleterious effect on the population. 33
  • 30.
  • 31.
  • 32.
    Population Viability Analysis • Minimum Viable Population is the minimum population size required for long-term survival of a species.  The number of grizzly bears in North America dropped from 100,000 in 1800 to 1,200 now. The animal’s range is just 1% of what is once was and the population is fragmented into 6 separate groups.  Biologists need to know how small the bear groups can be and still be viable in order to save the grizzly. 36
  • 33.
  • 34.
    Metapopulations • Metapopulation - a collection of populations that have regular or intermittent gene flow between geographically separate units  Source habitat - Birth rates are higher than death rates. Surplus individuals can migrate to new locations.  Sink habitat - Birth rates are less than death rates and the species would disappear if not replenished from a source. 38
  • 35.