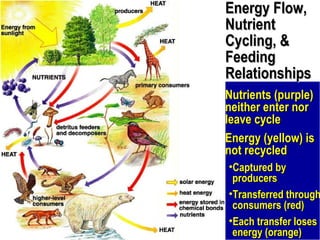
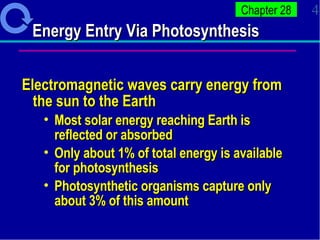
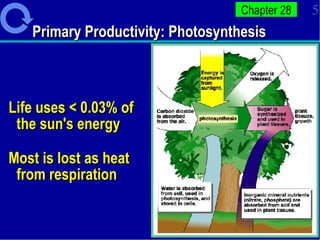
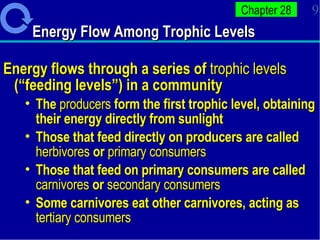
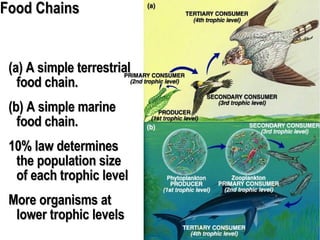
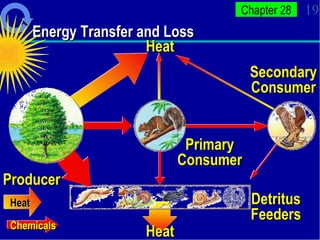
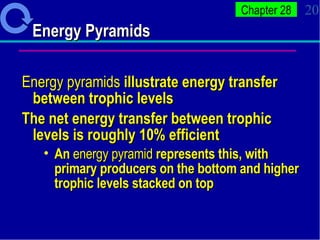
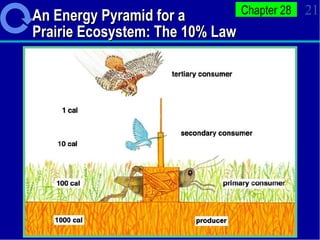
1. Energy from the sun enters ecosystems through photosynthesis by producers and flows through food chains and webs to consumers, with only about 10% being transferred between trophic levels as heat and inefficiencies.
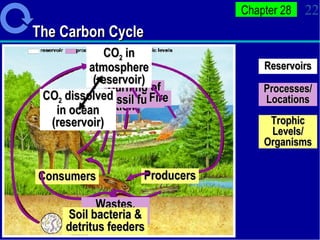
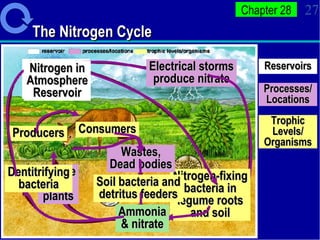
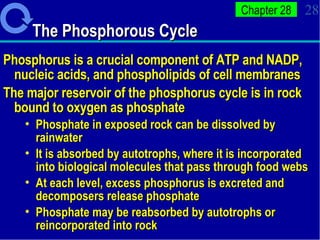
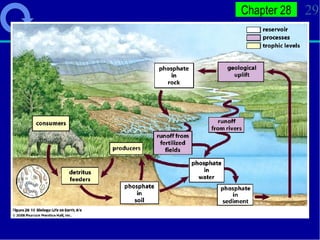
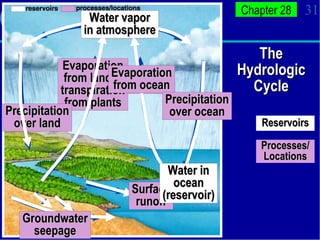
2. Nutrients cycle through ecosystems, moving between living and nonliving matter through various biogeochemical cycles like carbon, nitrogen, phosphorus, and water cycles, which are essential for life.
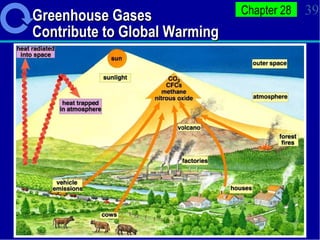
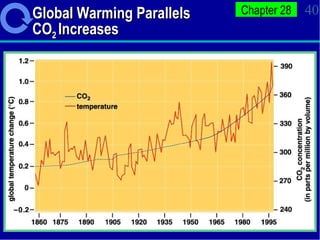
3. Human activities like burning fossil fuels are releasing excess carbon dioxide and other greenhouse gases, interfering with nutrient cycles and causing global warming through the enhanced greenhouse effect.