Download as PDF, PPTX


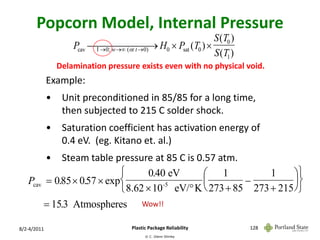
![Popcorn Model, Internal Pressure
m ( , f ) T1 S1 2 c exp( n2 f ) sin[ n (1 )]
1 1
m0 T0 S 0 n1 ( n2 c 2 c) sin n
S1 2 ( n2 c 2 ) exp( n2 f ) sin[ n (1 )]
1 1
S 0 n1 ( n c c) n
2 2
RT1S1
where c
and n are roots of tan c
Dt x Ref. H. S. Carslaw and J.C. Jaeger,
and f 12 (Fourier Number); “Conduction of Heat in Solids,”Oxford
w w 2nd ed. (1986) pp128-129.
8/2-4/2011 Plastic Package Reliability 126
© C. Glenn Shirley](https://image.slidesharecdn.com/plasticpackagereliability02aug2011rev1-120109031900-phpapp02/85/Plastic-package-reliability-128-320.jpg)


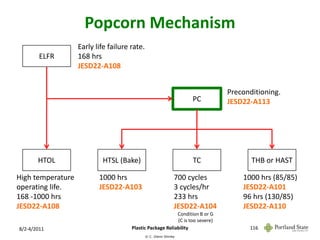
The document discusses the reliability of plastic-encapsulated microcircuits, covering aspects such as molding compounds, stress and test flows, thermal and moisture mechanisms. It outlines industry reliability standards and the importance of preconditioning and environmental testing in product reliability assessment. Additionally, it addresses challenges related to sampling and test procedures to ensure accurate reliability validation.