


![| Los Alamos National Laboratory |
Conclusions
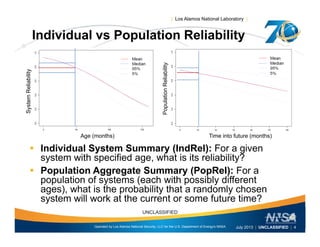
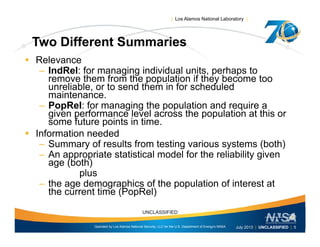
Understanding which summary is appropriate to answer which
question is key to good decision-making
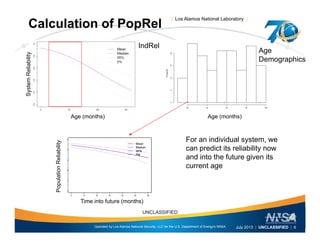
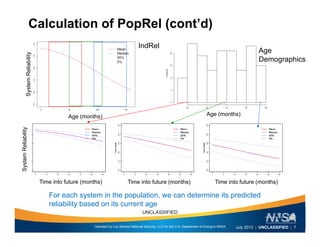
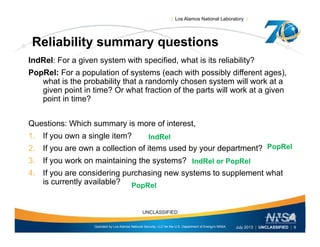
– IndRel answers “For a given system with specified age (and
) h i i li bili ?usage), what is its reliability?
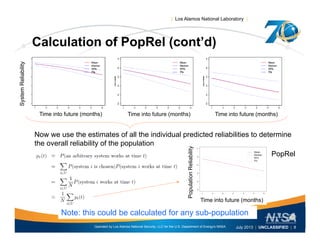
– PopRel answers “For a population of systems, what is the
probability that a randomly chosen system will work at the
current or some future time?current or some future time?
What is needed?
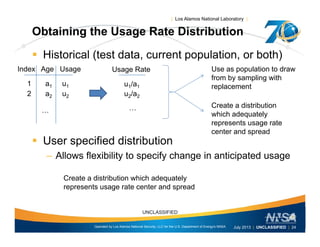
– Summary of results from testing various systems [both]
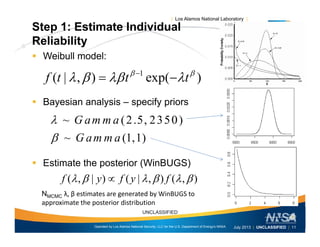
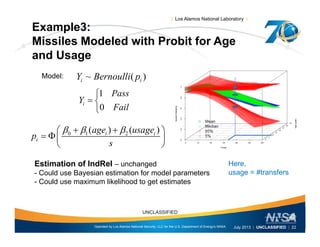
A statistical model for the reliability given age and usage [both]– A statistical model for the reliability given age and usage [both]
plus
– The age (and usage) demographics of the population at the current
time [PopRel]
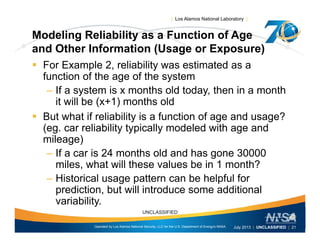
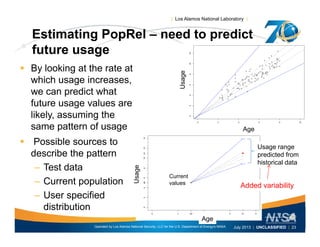
Predicting the age of systems into the future is straightforward, but
additional assumptions about future usage of units in the population are
needed to obtain a sensible PopRel estimate
Operated by Los Alamos National Security, LLC for the U.S. Department of Energy's NNSA
UNCLASSIFIED
July 2013 | UNCLASSIFIED | 27](https://image.slidesharecdn.com/reliaiblitywebinarv2-cmacjuly2013-130715163547-phpapp02/85/Comparing-Individual-Reliability-to-Population-Reliability-for-Aging-Systems-29-320.jpg)

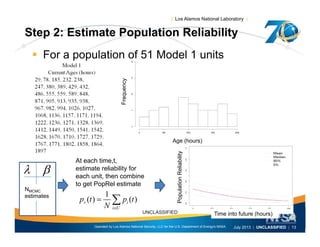
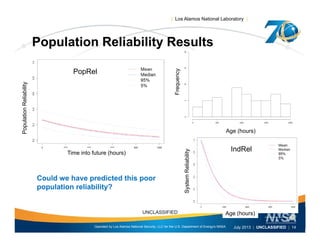
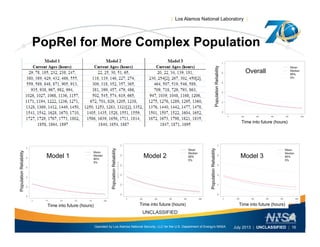
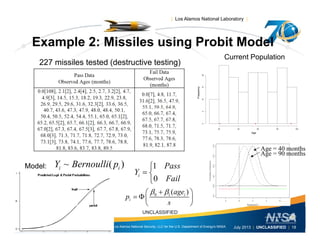
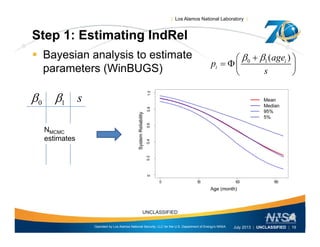
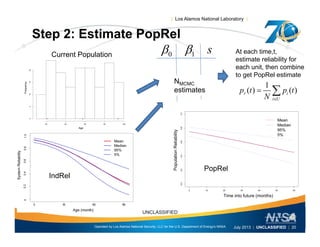
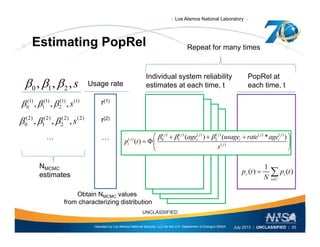
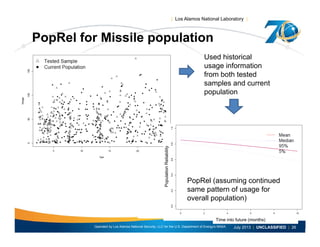
This document discusses the differences between individual reliability (IndRel) and population reliability (PopRel) for aging systems. IndRel provides the reliability of a single system at a given age, while PopRel provides the probability that a randomly selected system from a population will work at a given time, taking into account the age distribution of systems in the population. The document outlines methods to estimate both IndRel and PopRel, including using Weibull and probit models on failure data. Examples are provided to demonstrate estimating IndRel and PopRel for projects using different statistical models and failure data.