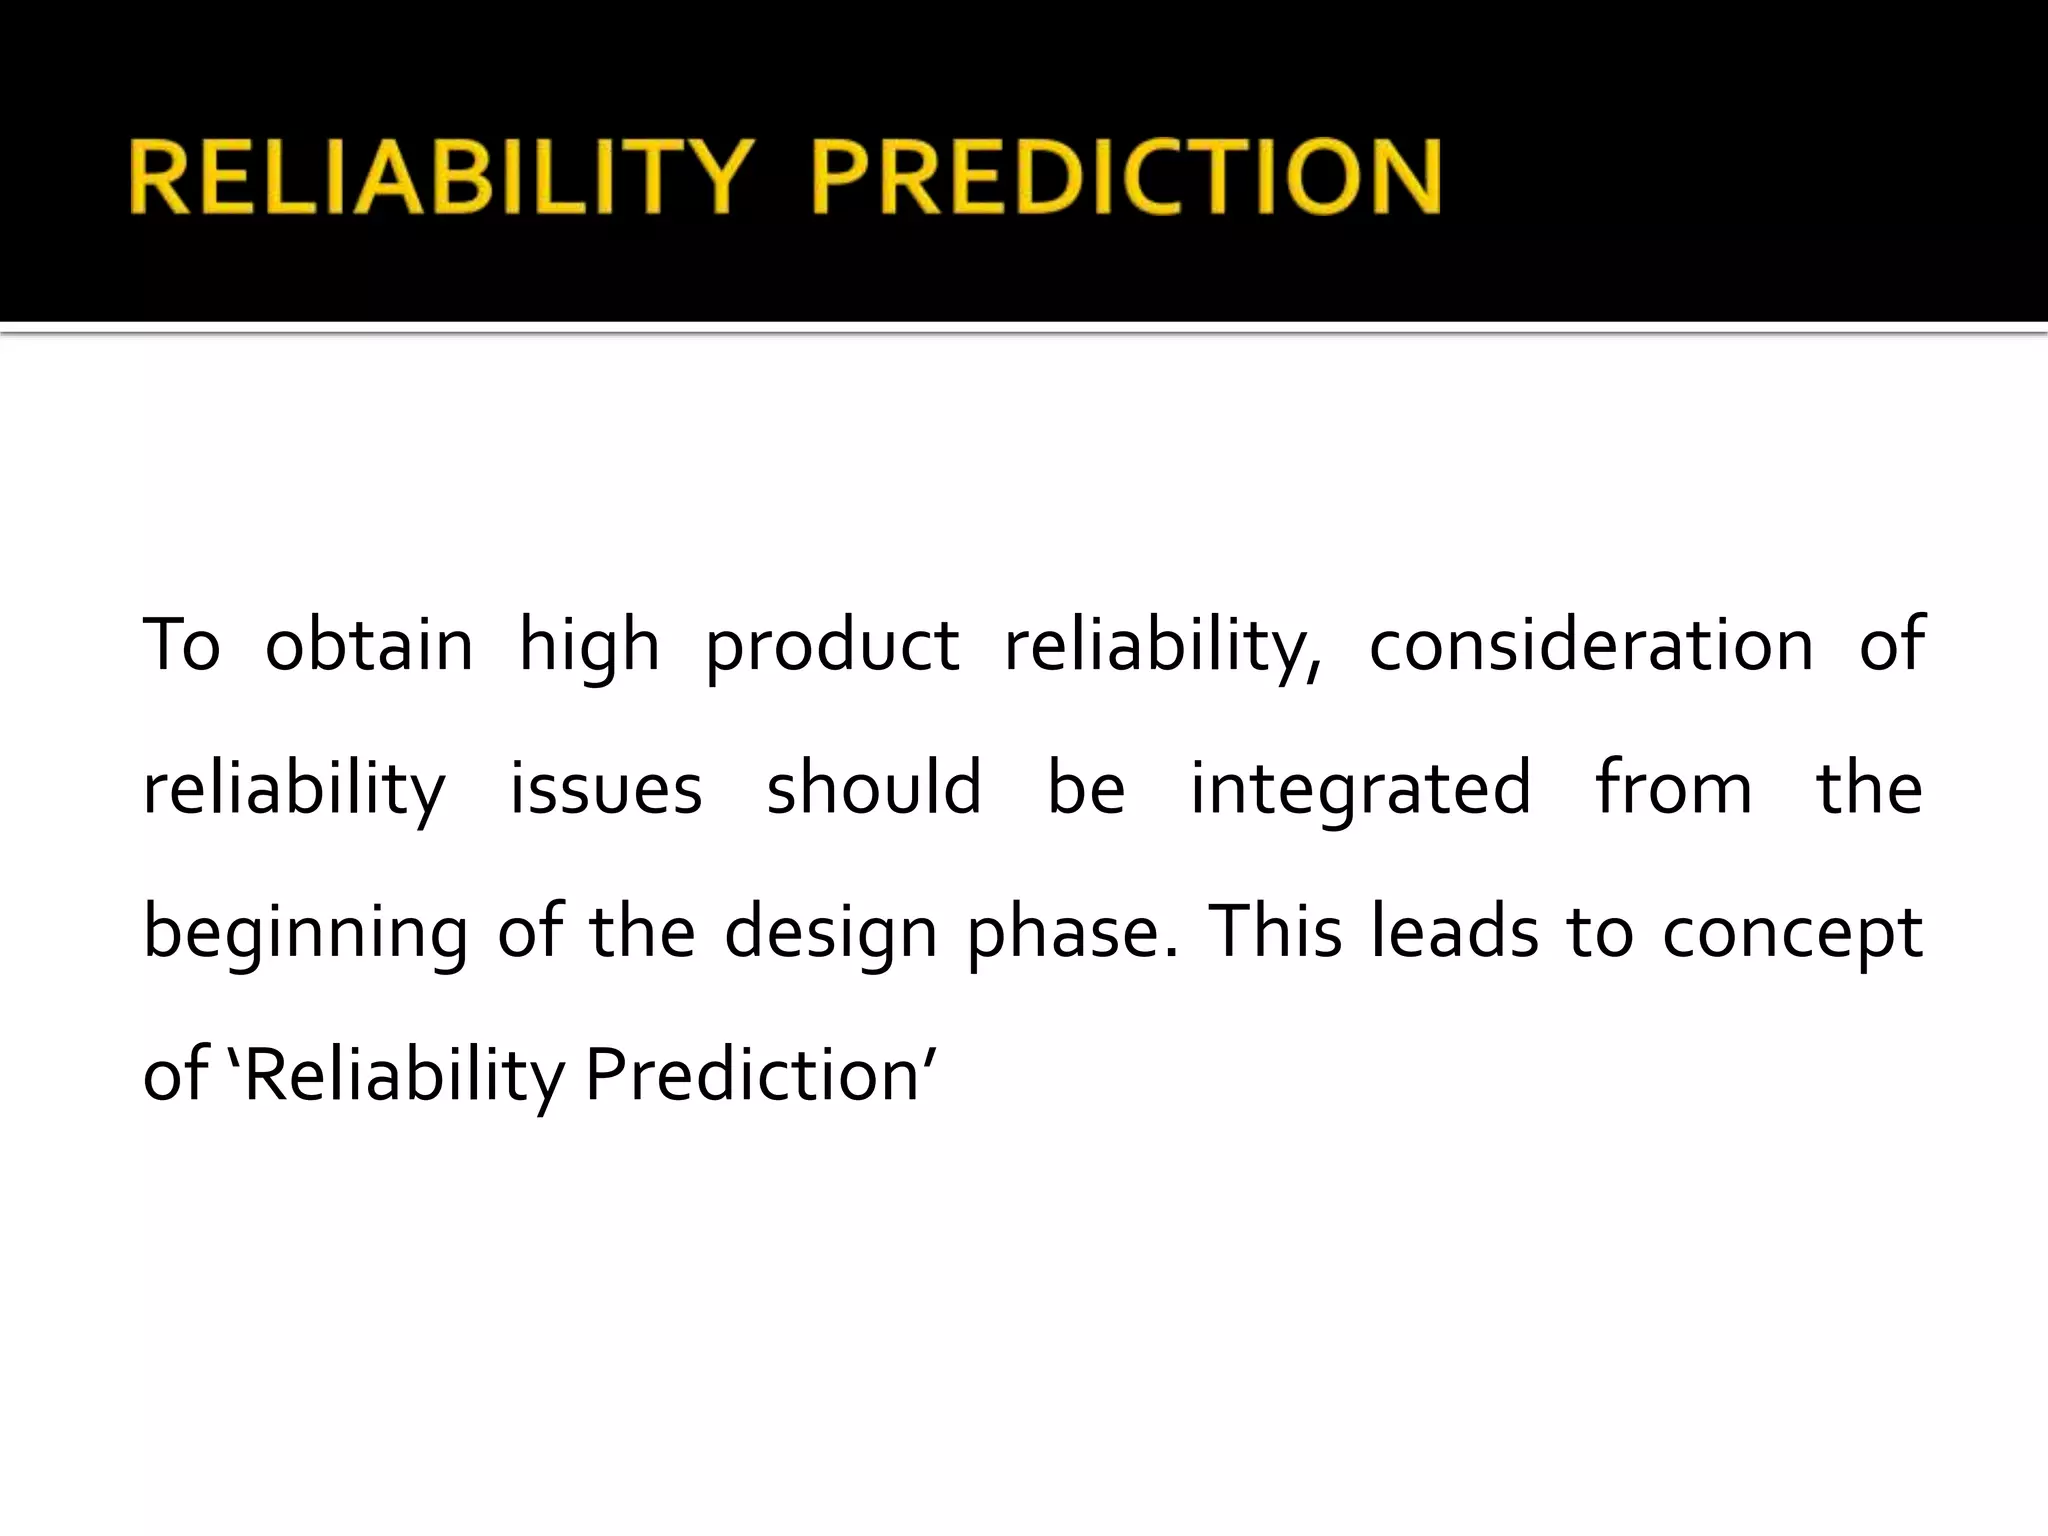
The document discusses reliability prediction for electronics components and products. Reliability prediction should be integrated from the beginning of the design phase to obtain high product reliability. This leads to the concept of reliability prediction. There are three main methods for reliability prediction: life testing, physics of failure analysis, and empirical or standards-based methods. Life testing uses statistical analysis of failures from testing samples at operational stresses. Physics of failure is based on understanding failure mechanisms and material properties. Empirical methods use statistical models developed from historical failure data for similar components. Standards like MIL-HDBK-217F provide empirical models to predict reliability for electronics parts in terms of failure rates.
To obtain highproduct reliability, consideration of
reliability issues should be integrated from the
beginning of the design phase. This leads to concept
of ‘Reliability Prediction’
3.
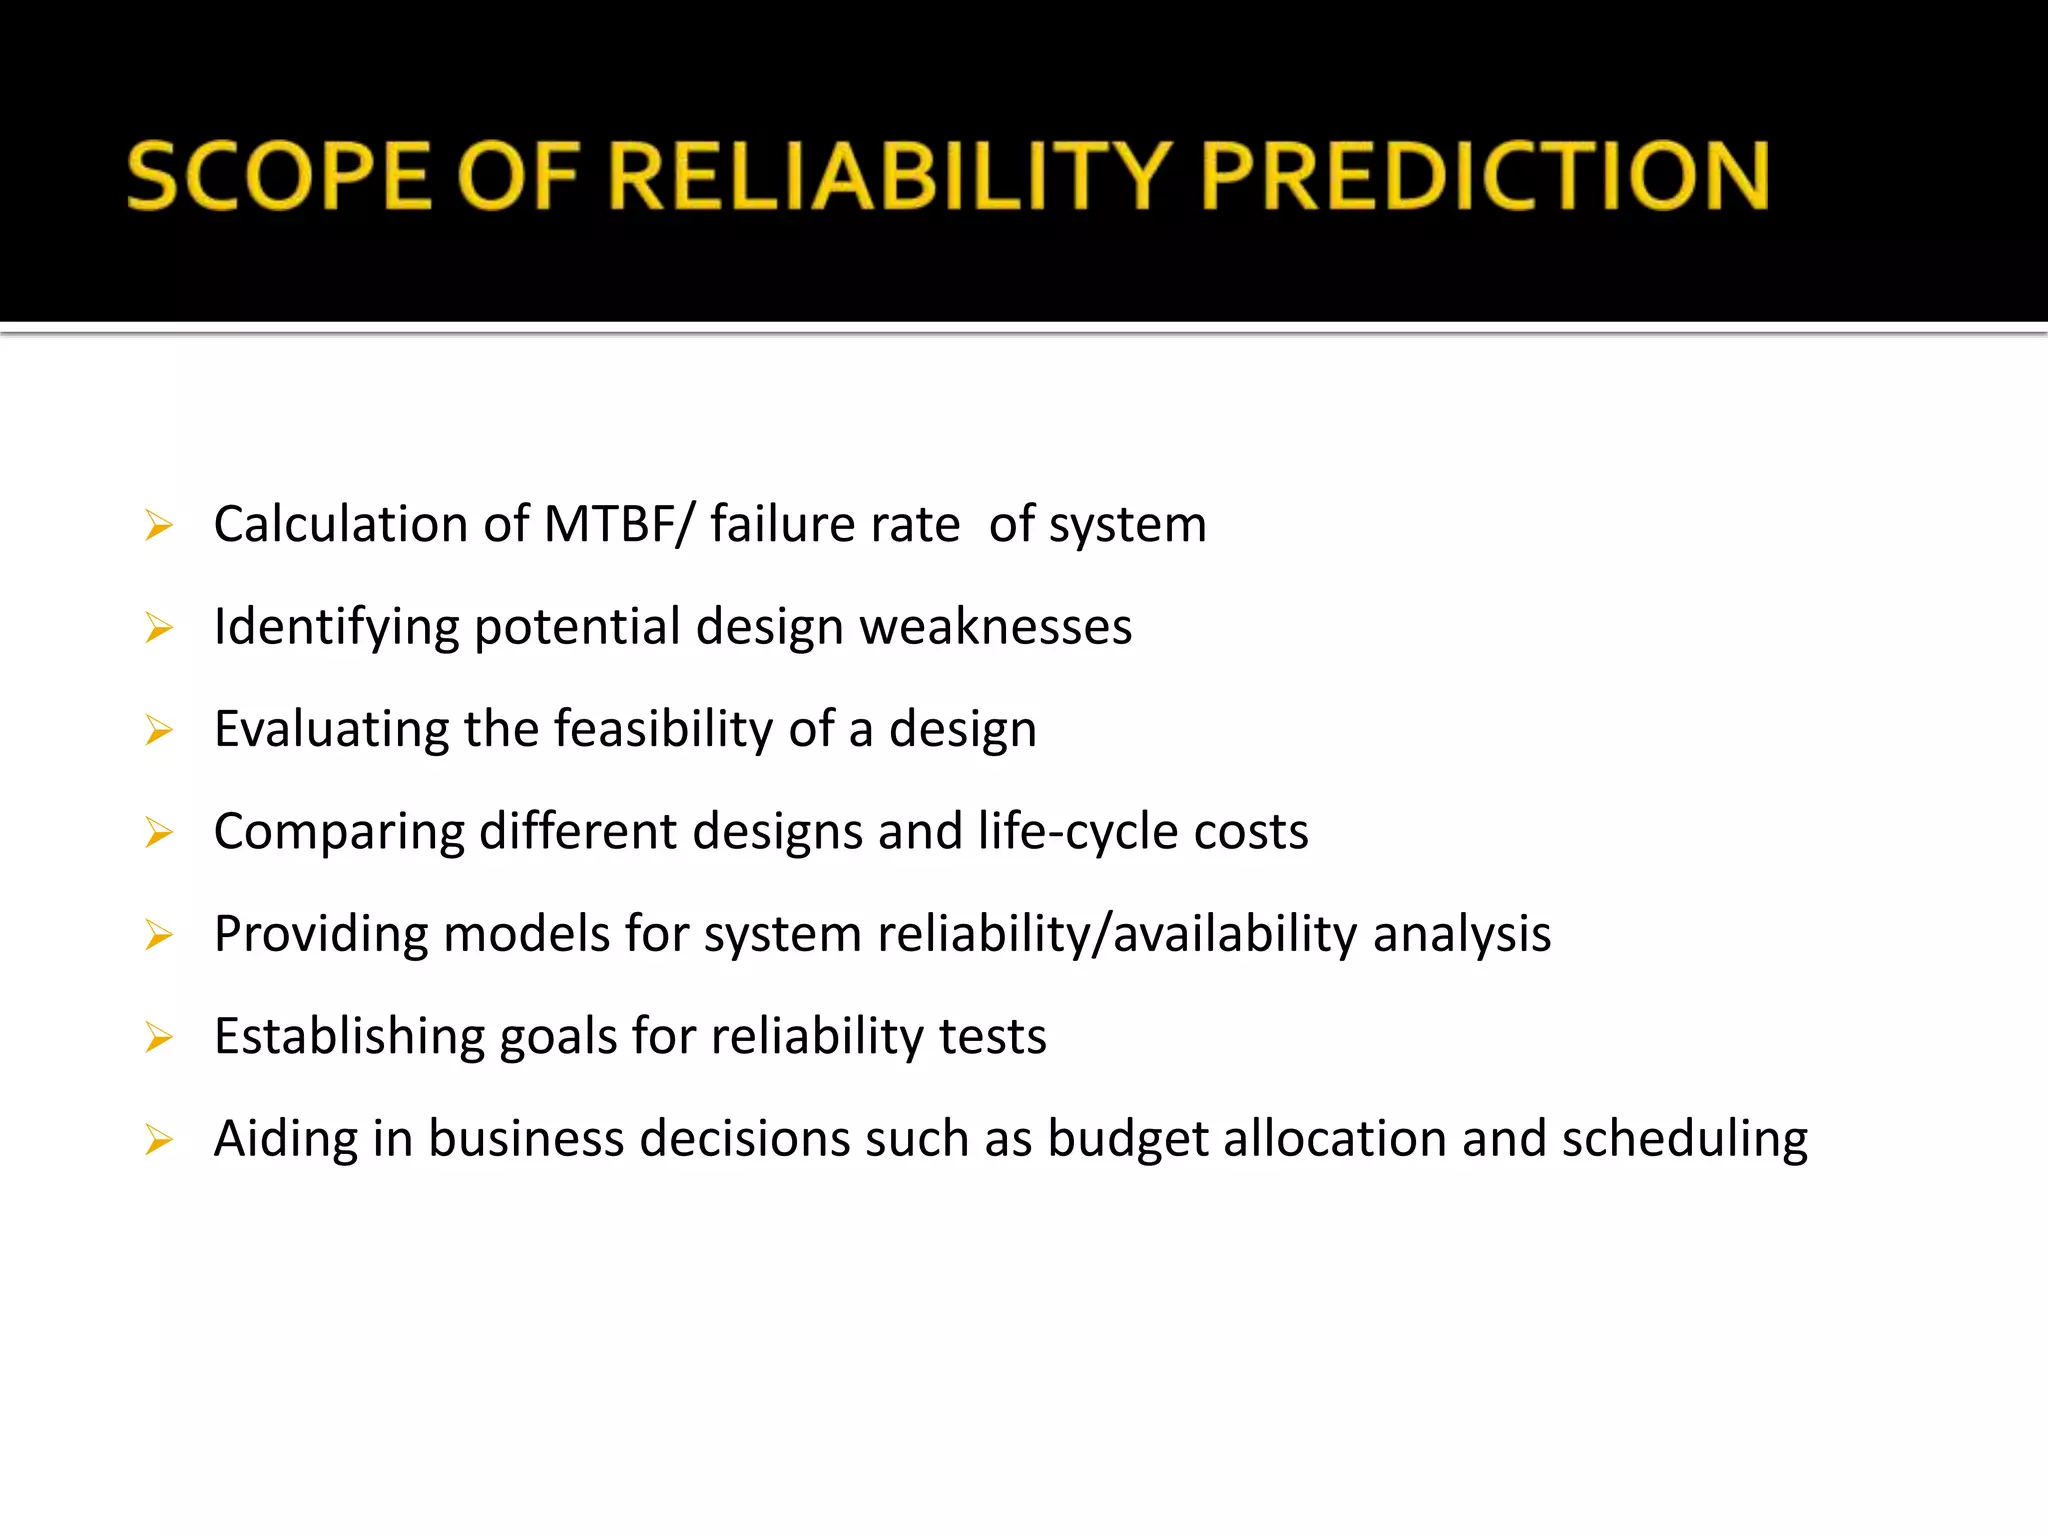
Calculation ofMTBF/ failure rate of system
Identifying potential design weaknesses
Evaluating the feasibility of a design
Comparing different designs and life-cycle costs
Providing models for system reliability/availability analysis
Establishing goals for reliability tests
Aiding in business decisions such as budget allocation and scheduling
4.
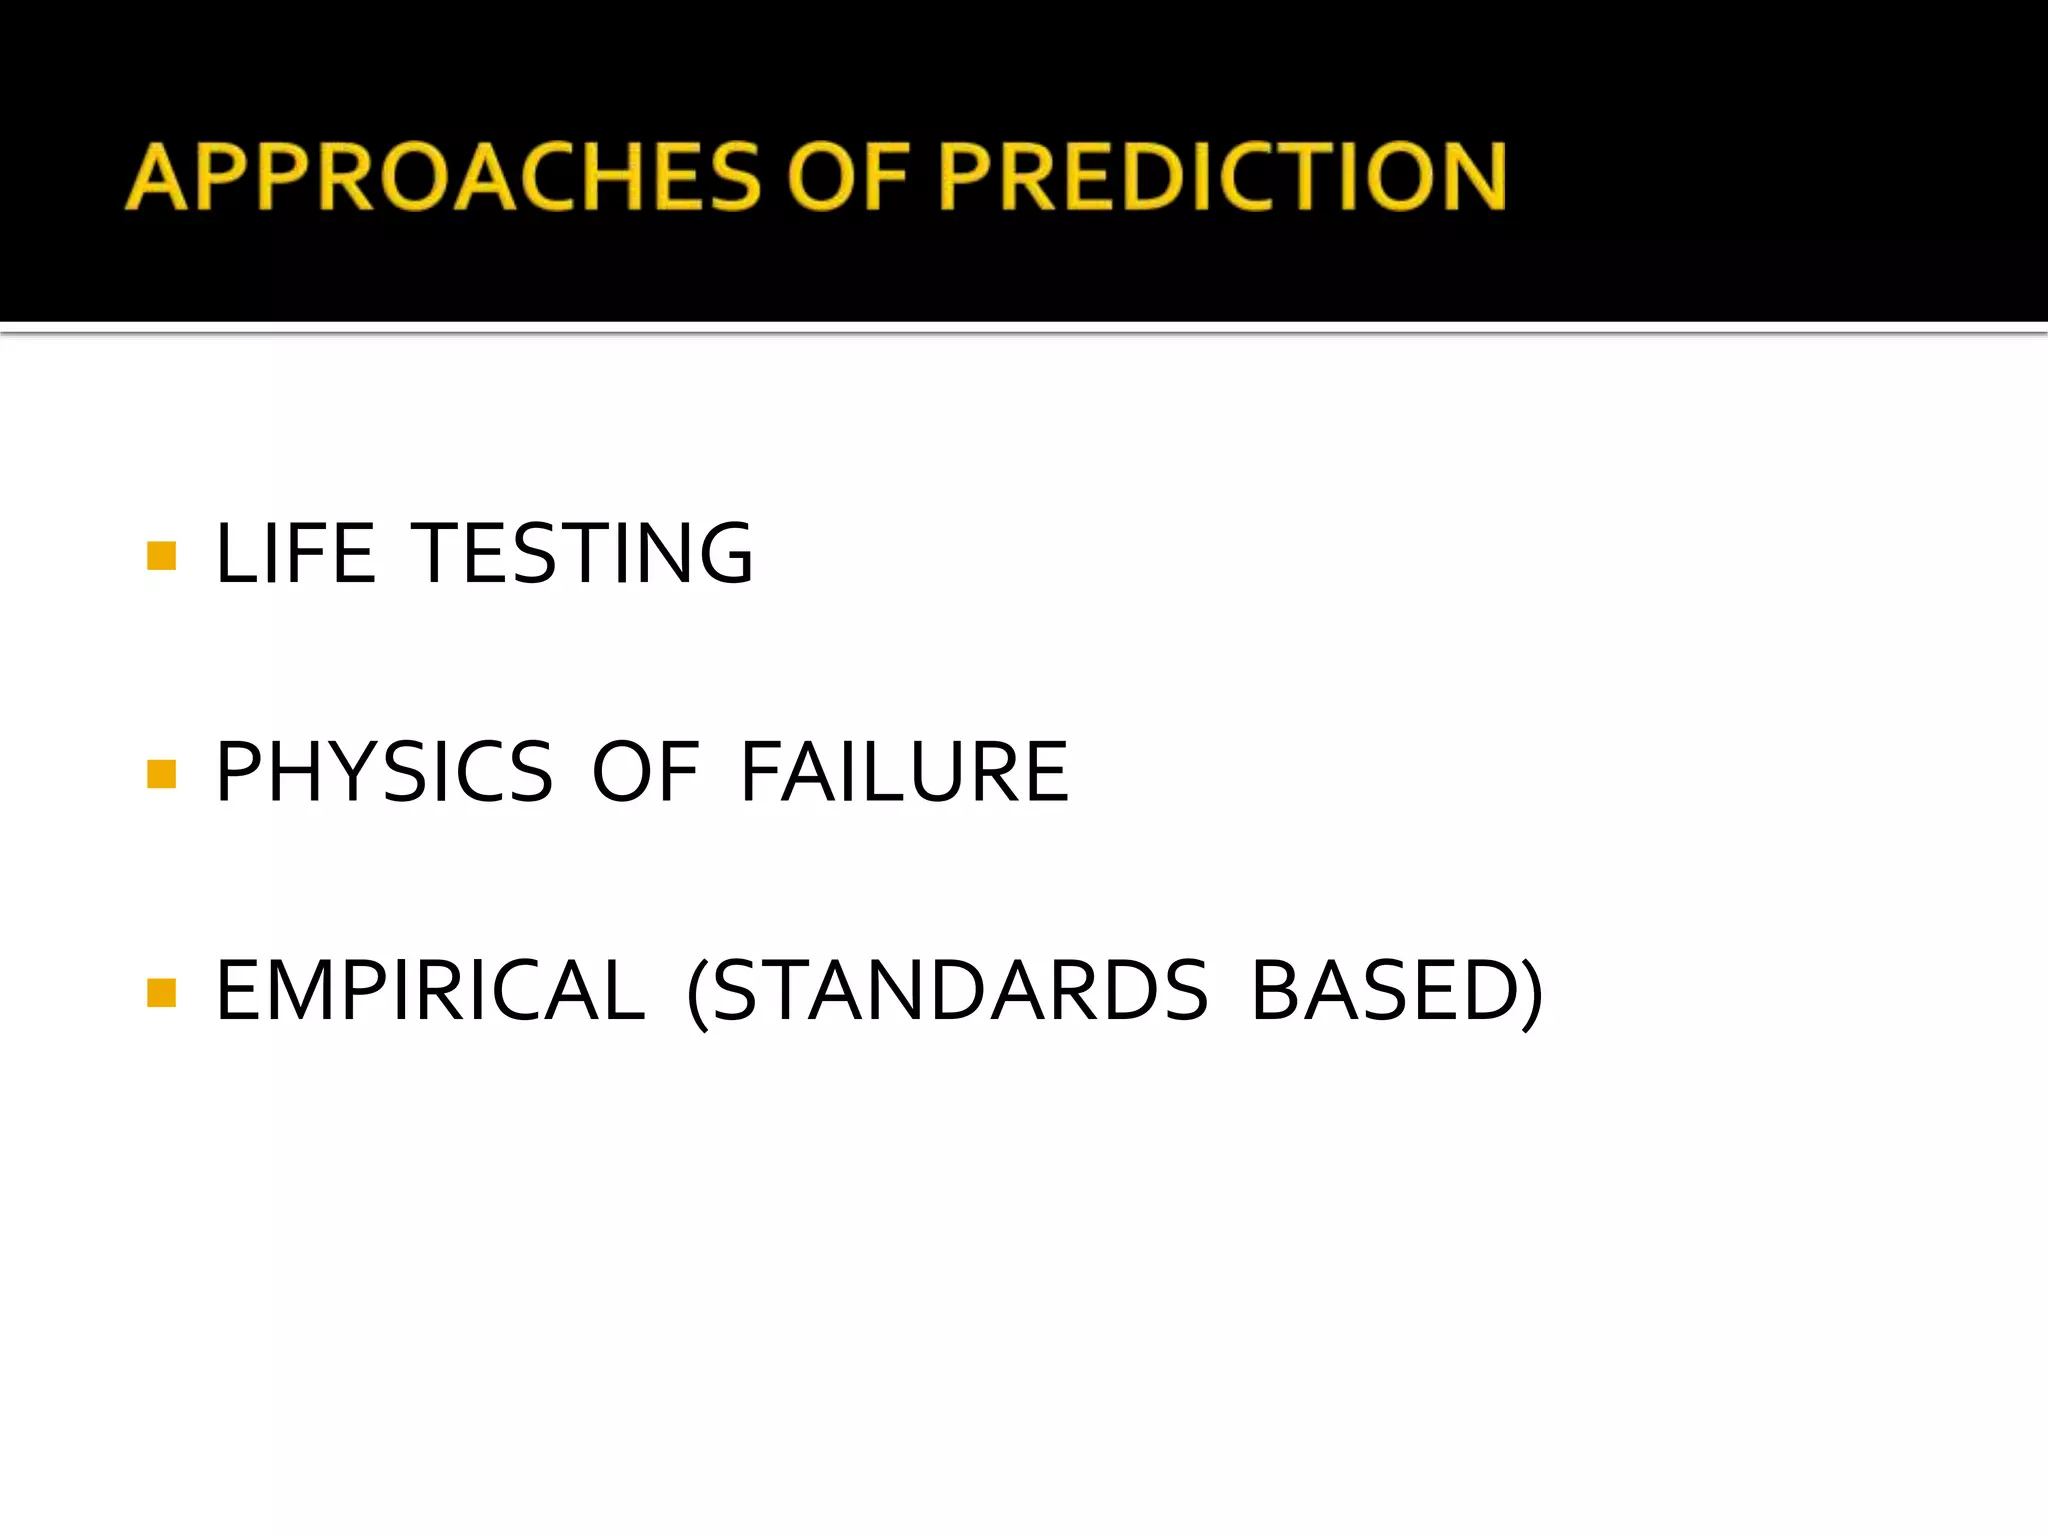
LIFE TESTING
PHYSICS OF FAILURE
EMPIRICAL (STANDARDS BASED)
5.
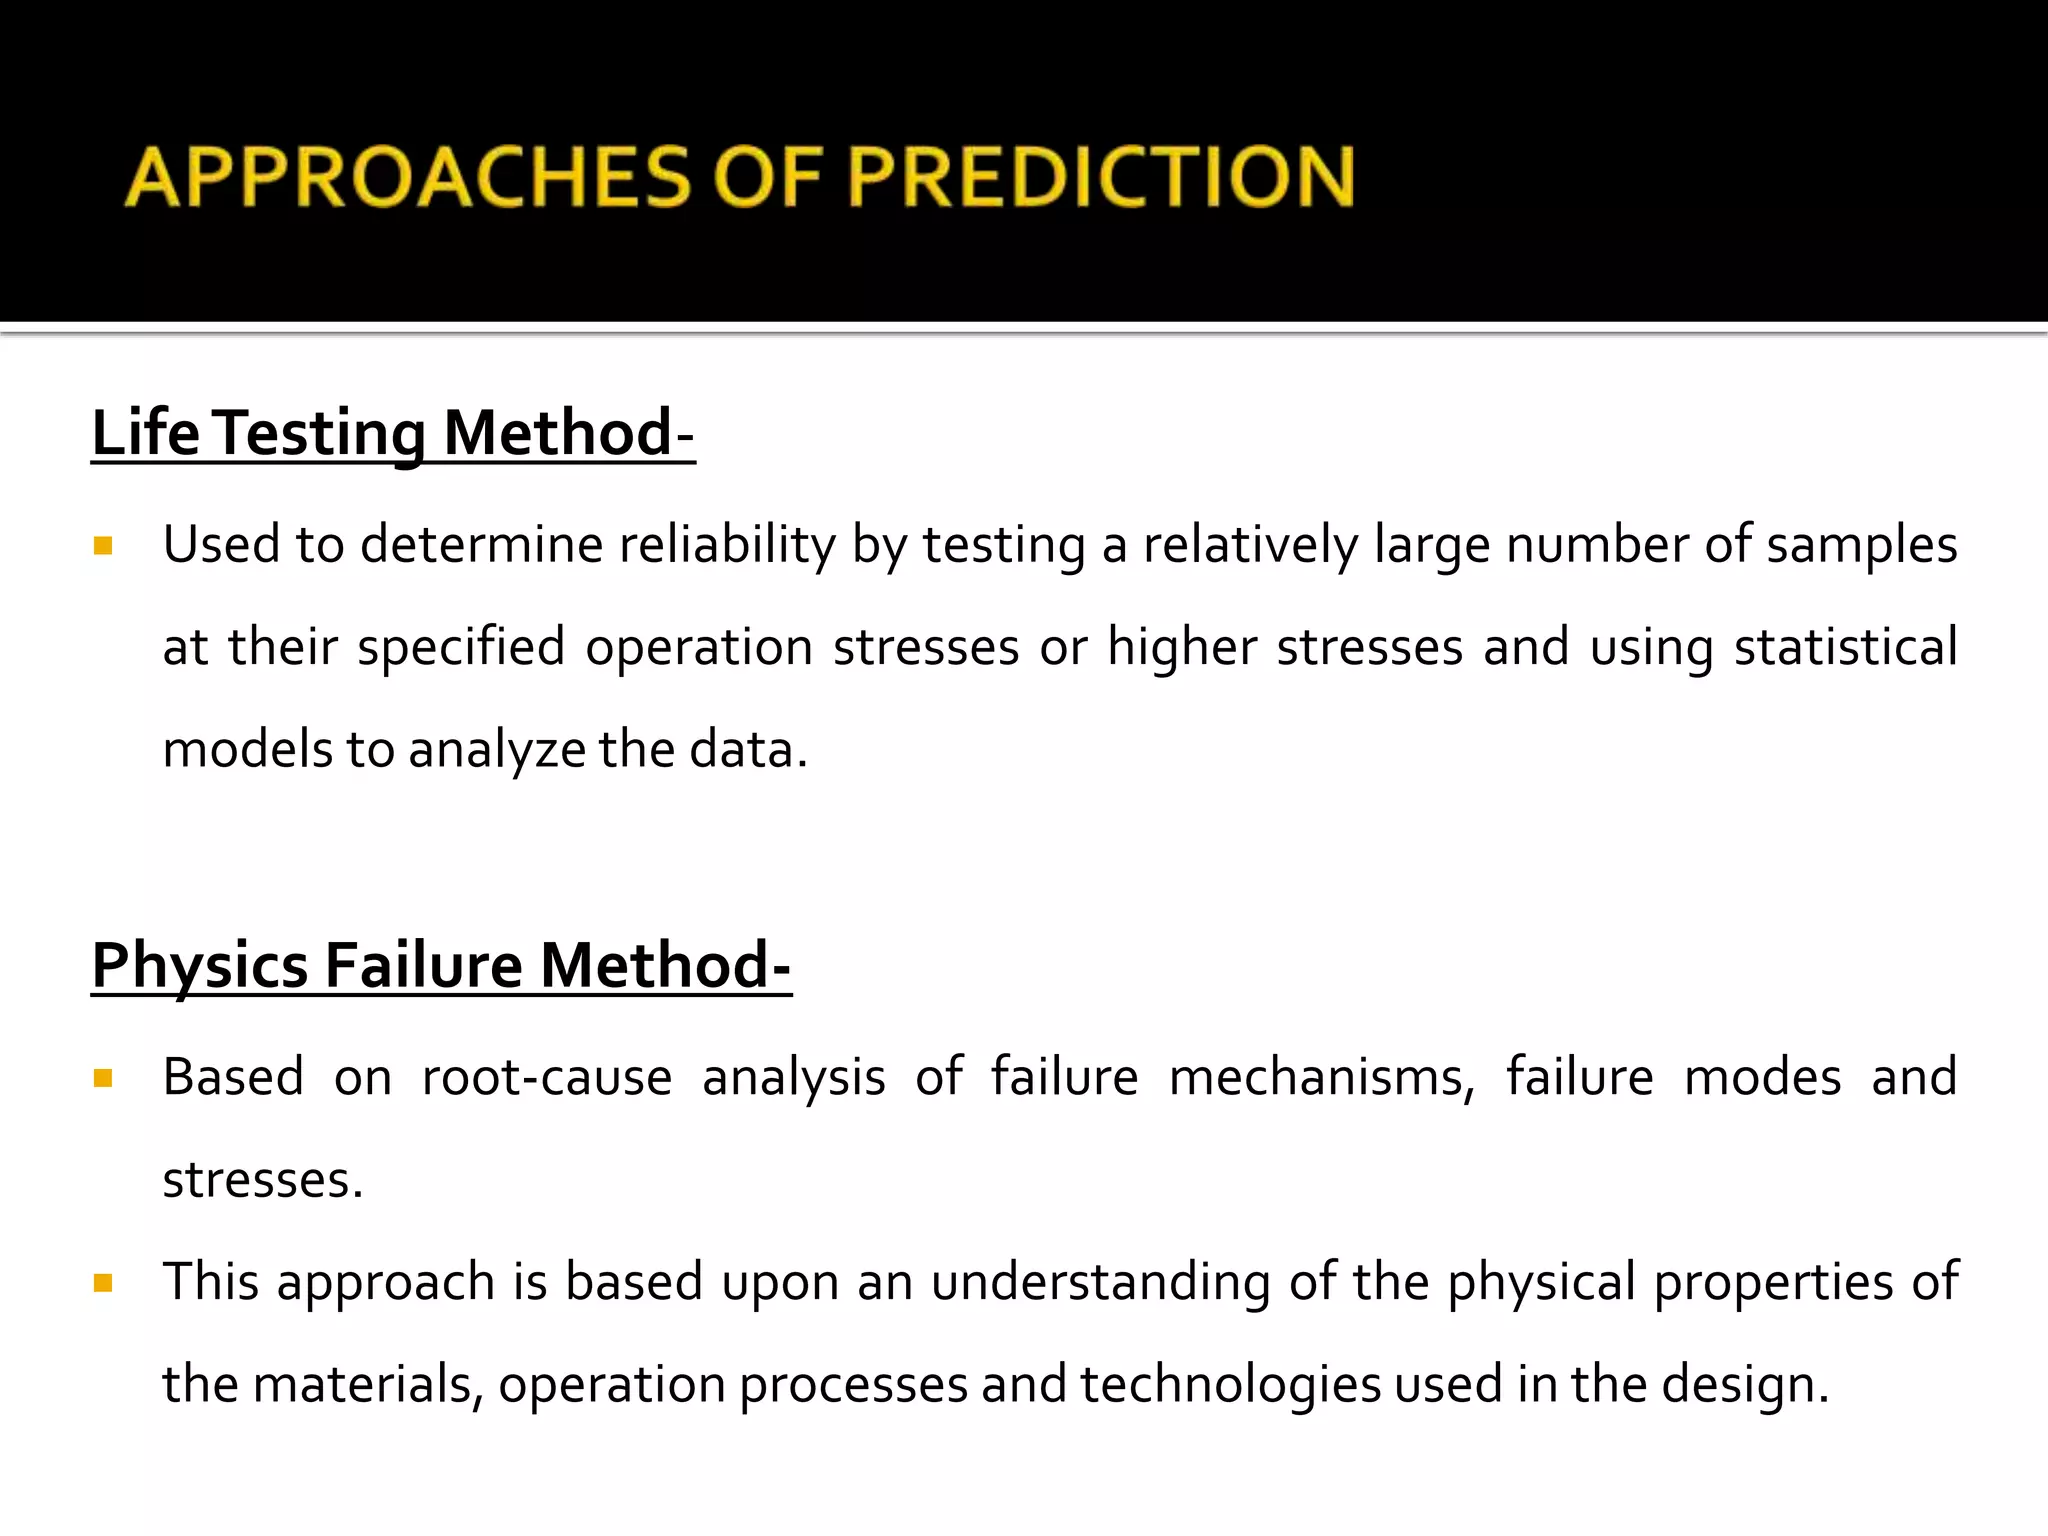
LifeTesting Method-
Usedto determine reliability by testing a relatively large number of samples
at their specified operation stresses or higher stresses and using statistical
models to analyze the data.
Physics Failure Method-
Based on root-cause analysis of failure mechanisms, failure modes and
stresses.
This approach is based upon an understanding of the physical properties of
the materials, operation processes and technologies used in the design.
6.
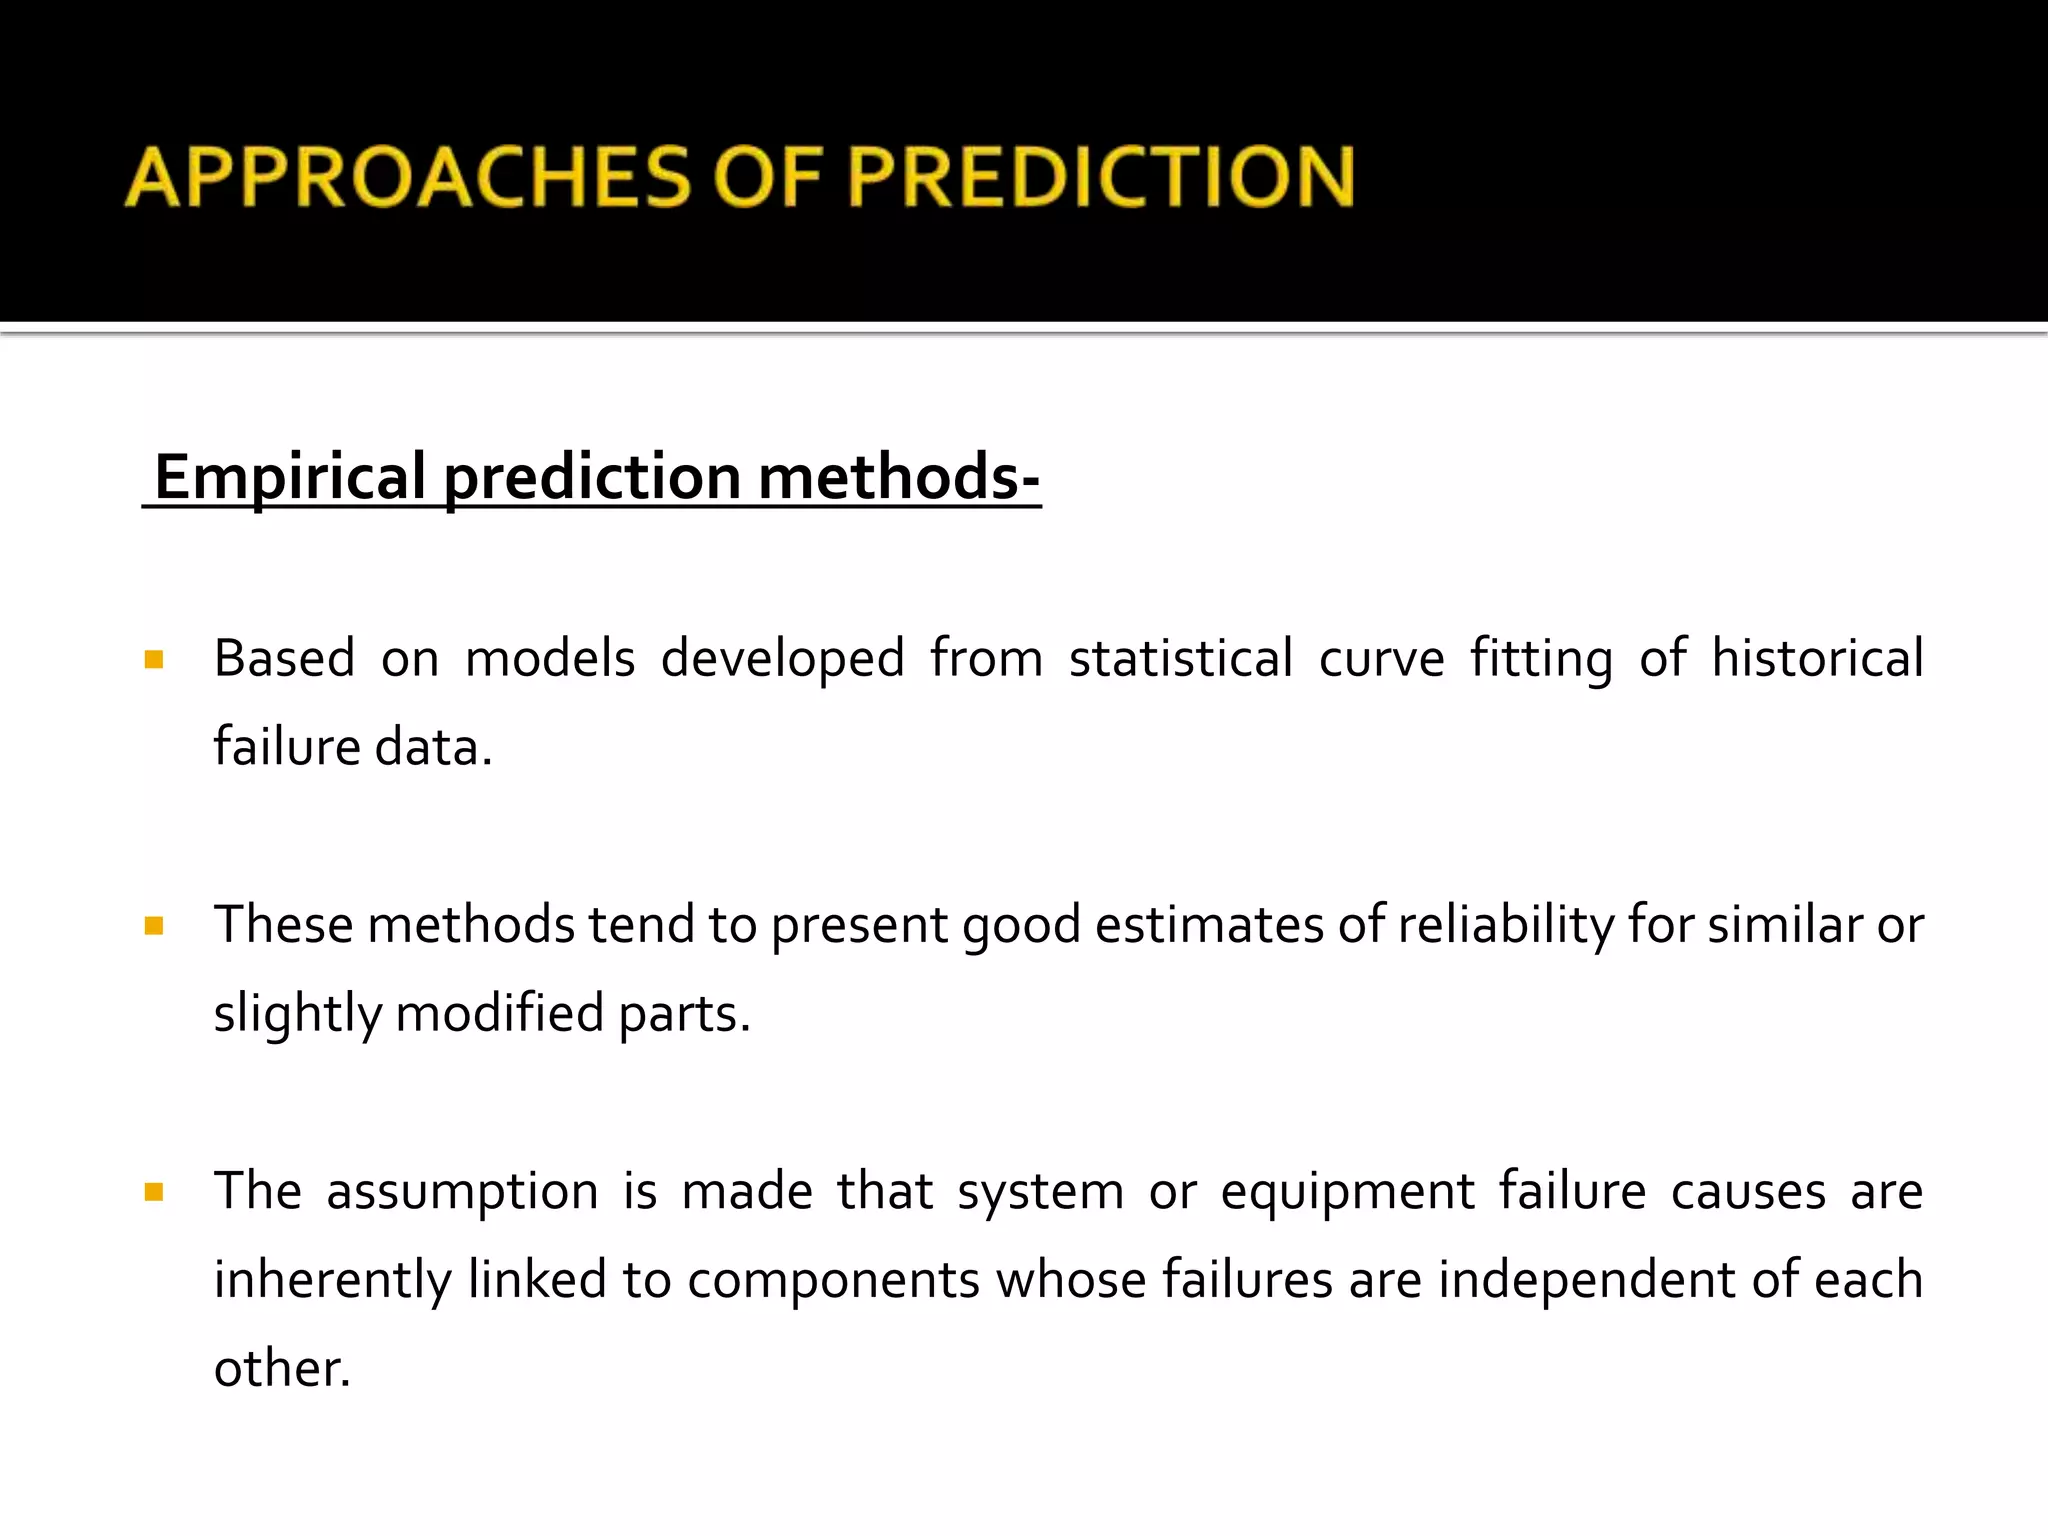
Empirical prediction methods-
Based on models developed from statistical curve fitting of historical
failure data.
These methods tend to present good estimates of reliability for similar or
slightly modified parts.
The assumption is made that system or equipment failure causes are
inherently linked to components whose failures are independent of each
other.
7.
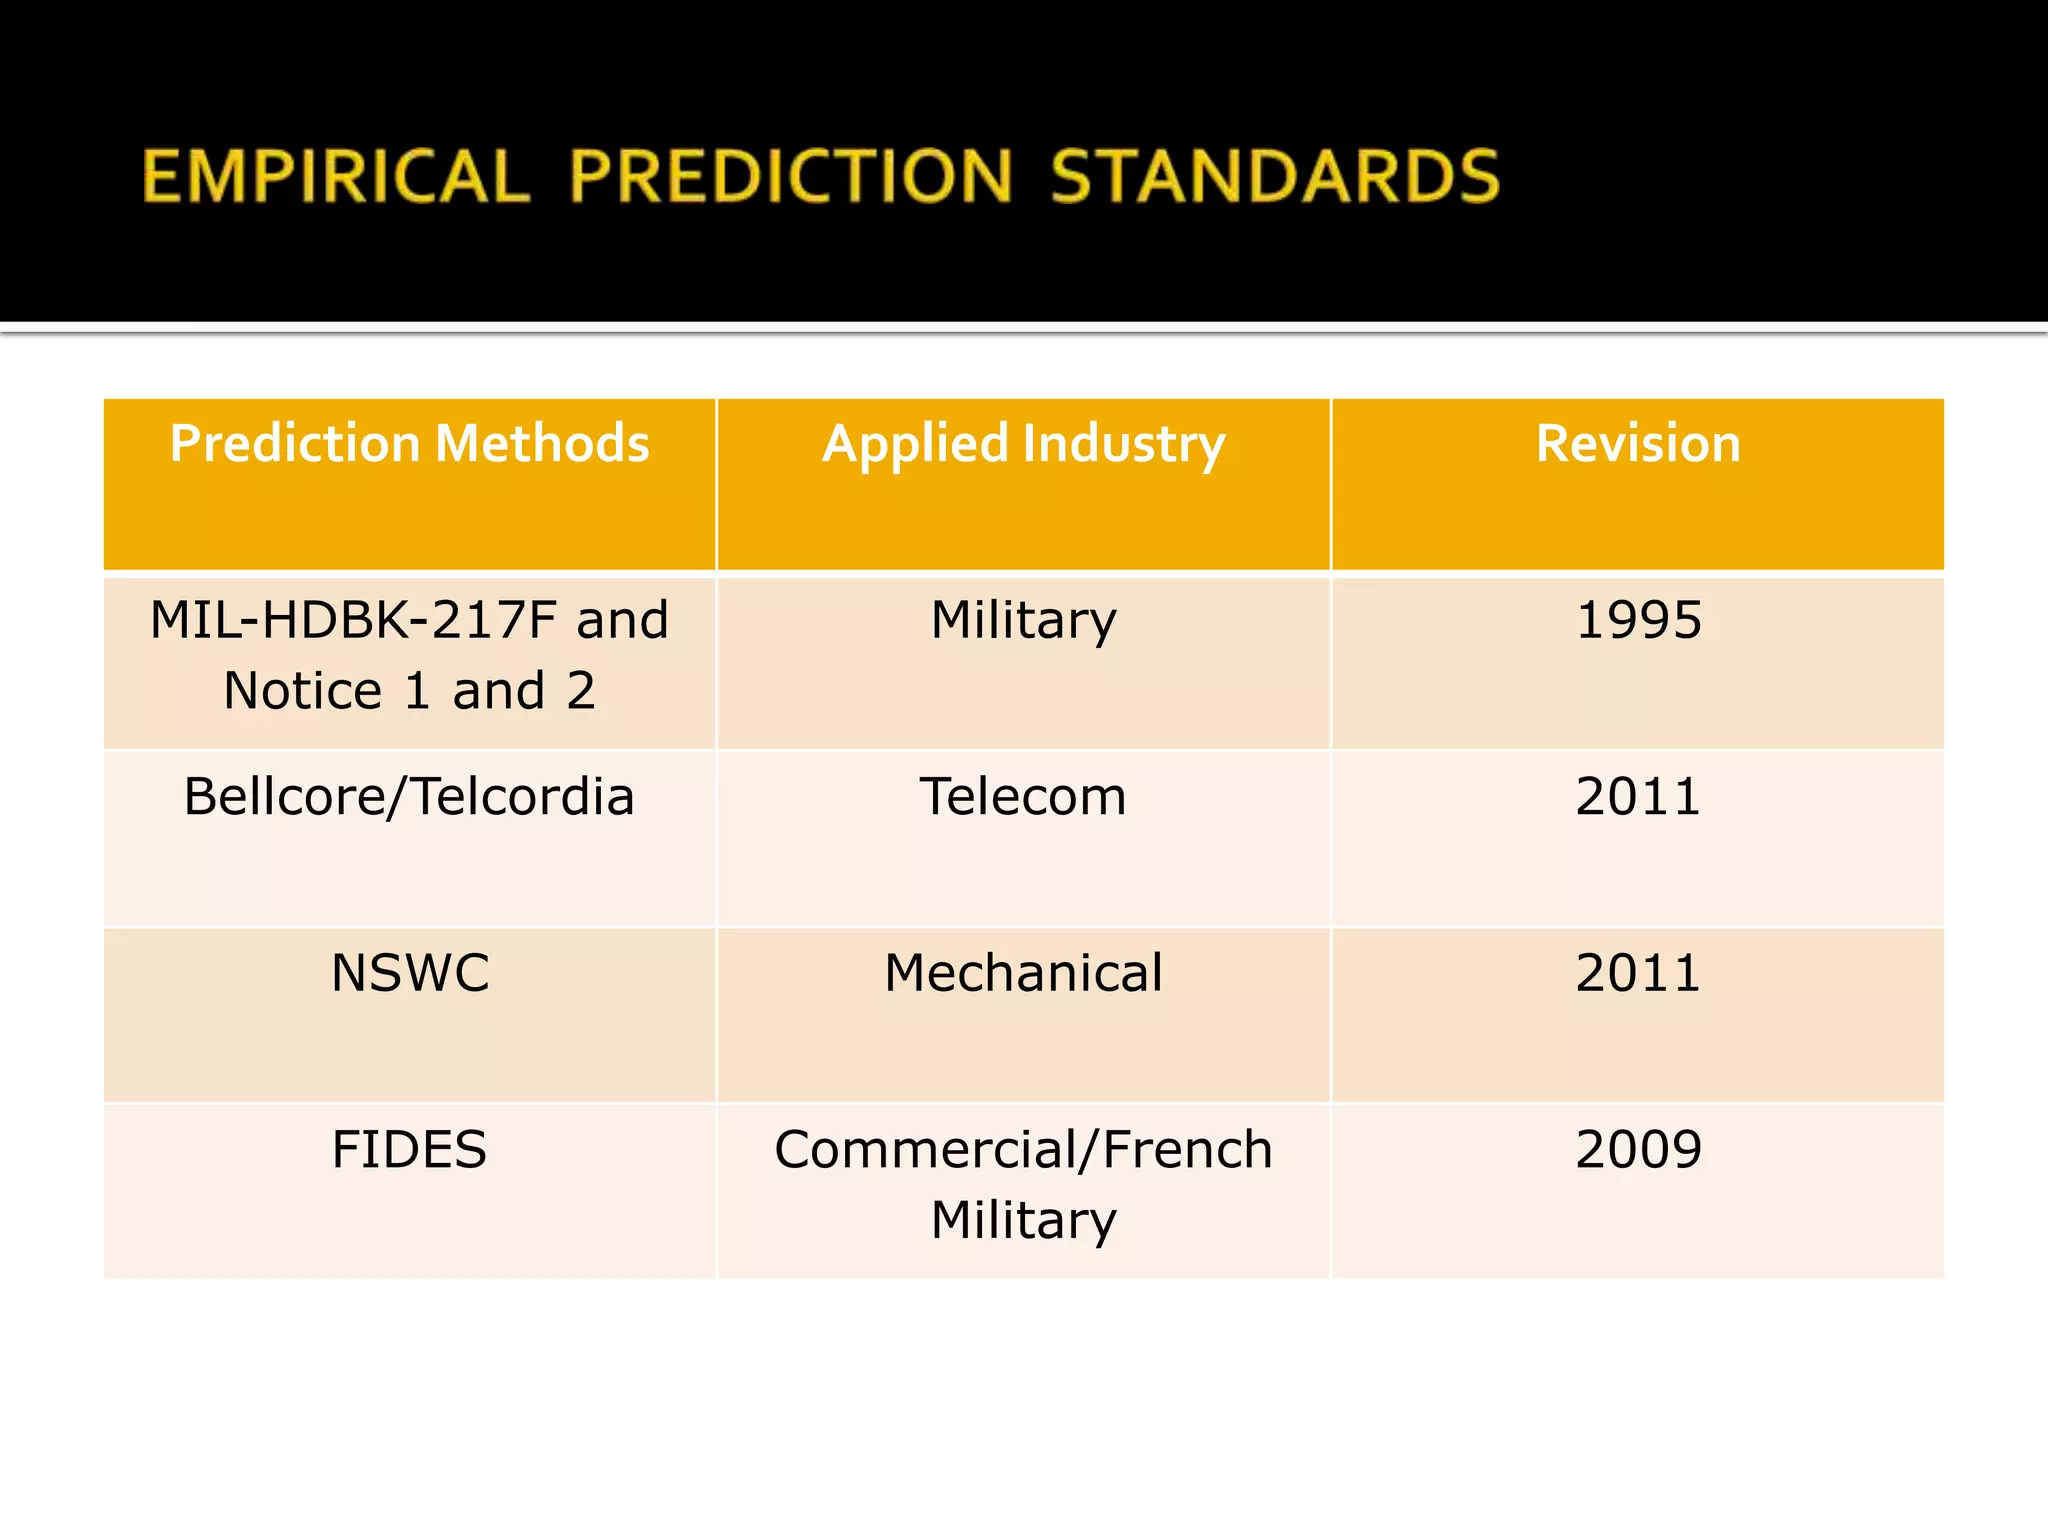
Prediction Methods AppliedIndustry Revision
MIL-HDBK-217F and
Notice 1 and 2
Military 1995
Bellcore/Telcordia Telecom 2011
NSWC Mechanical 2011
FIDES Commercial/French
Military
2009
8.
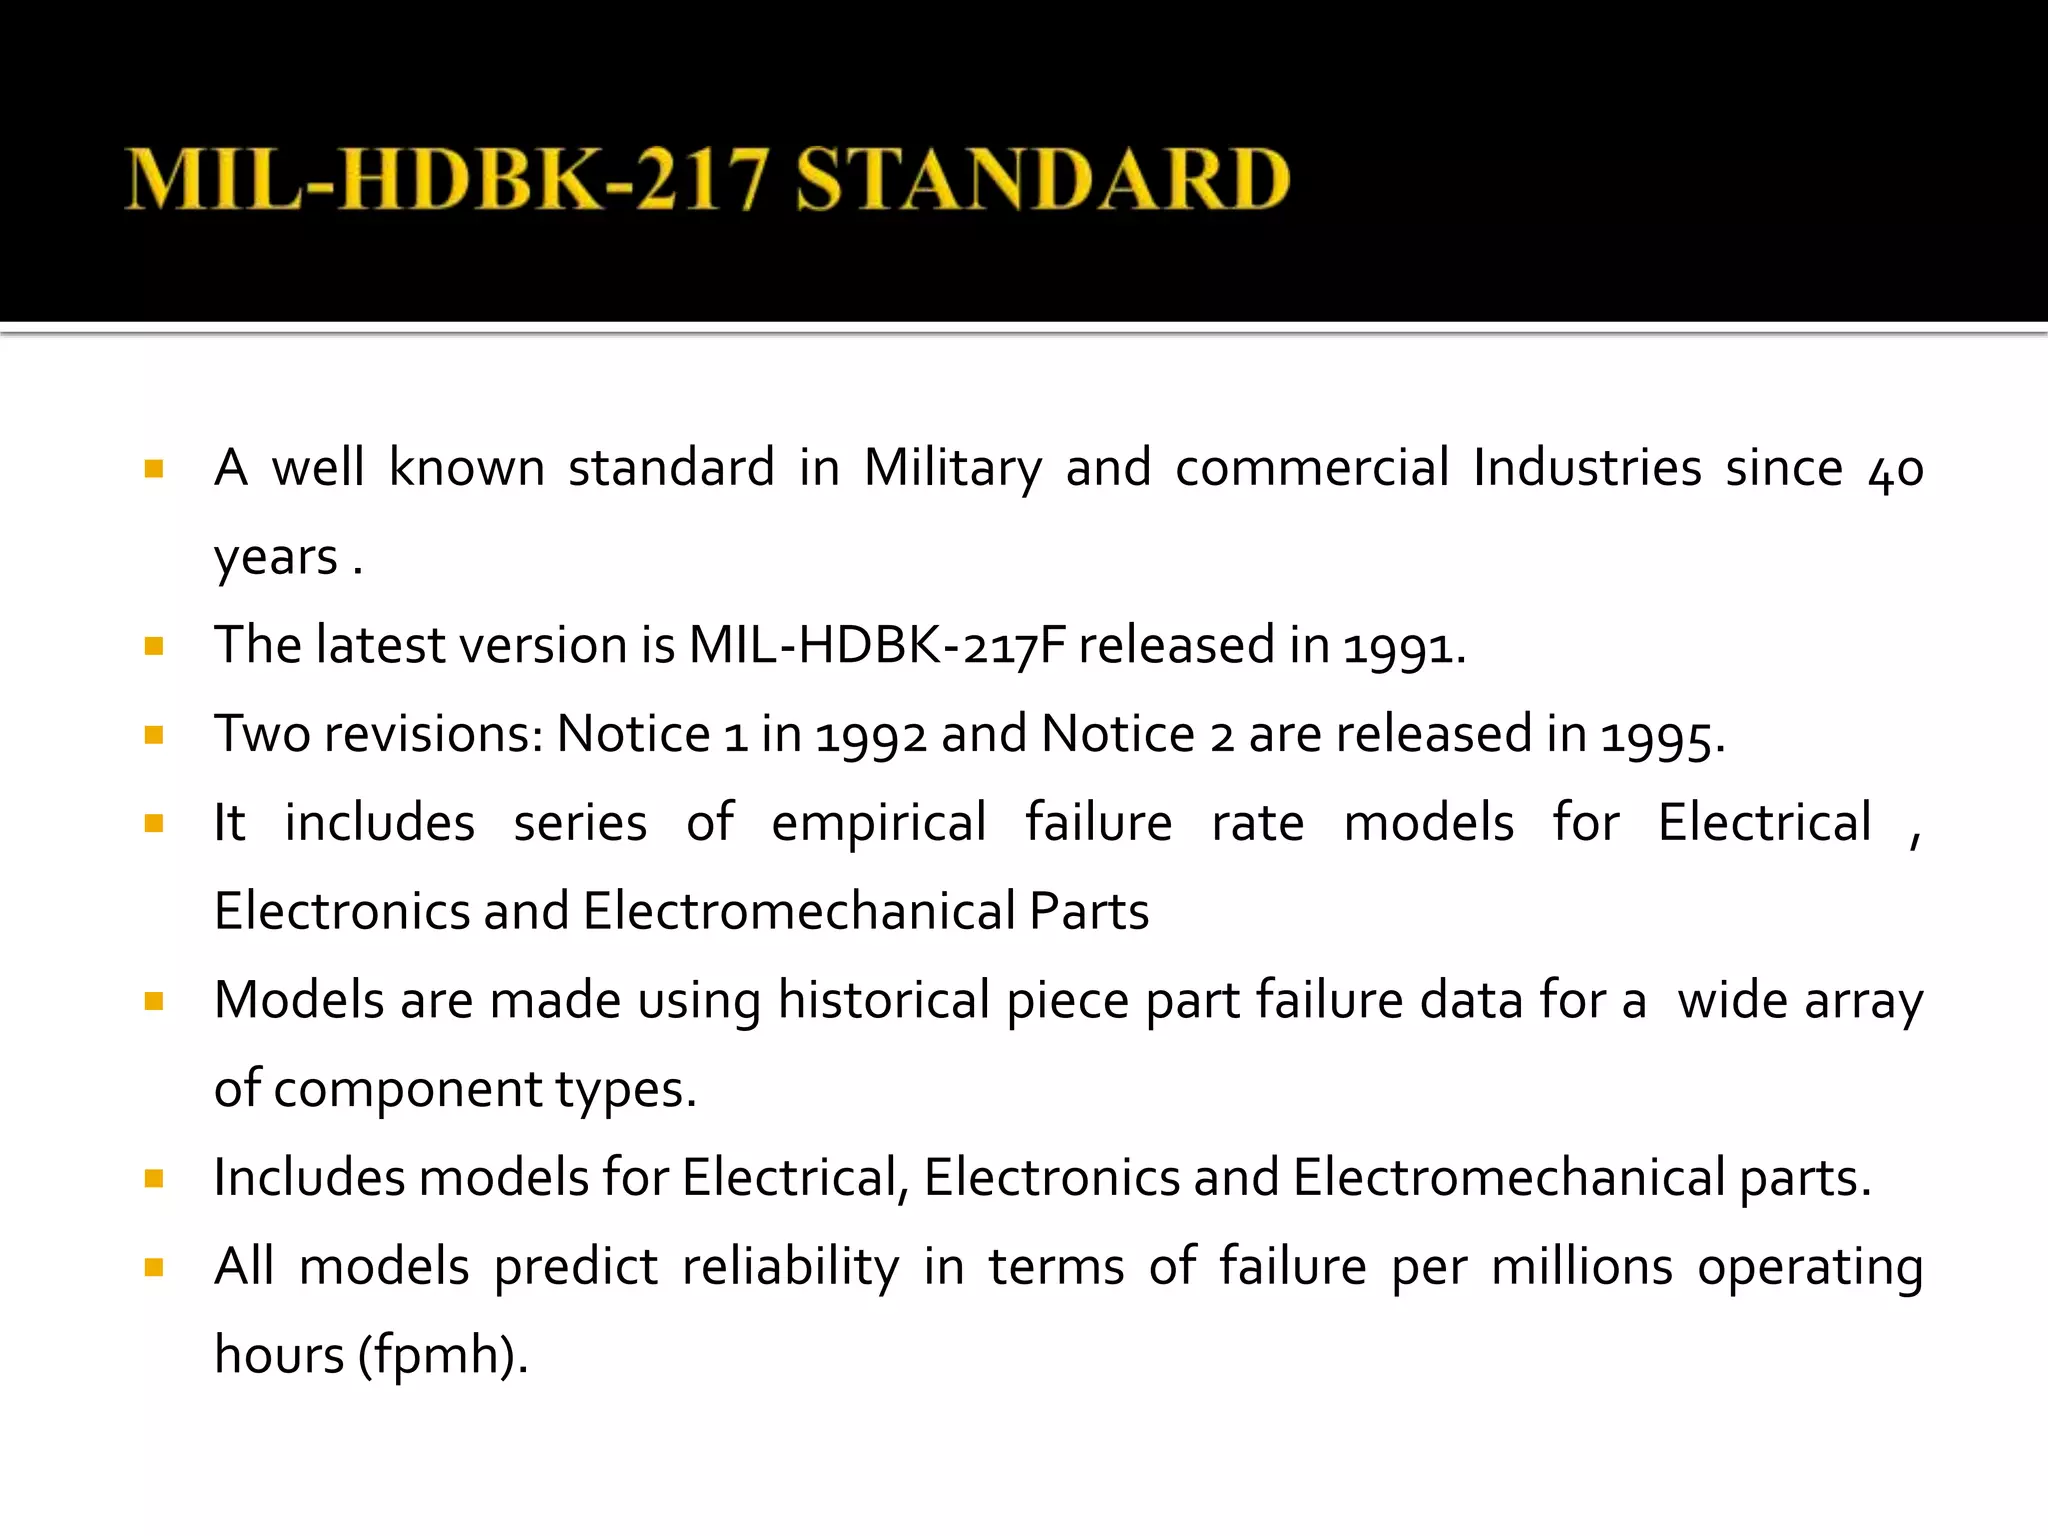
A wellknown standard in Military and commercial Industries since 40
years .
The latest version is MIL-HDBK-217F released in 1991.
Two revisions: Notice 1 in 1992 and Notice 2 are released in 1995.
It includes series of empirical failure rate models for Electrical ,
Electronics and Electromechanical Parts
Models are made using historical piece part failure data for a wide array
of component types.
Includes models for Electrical, Electronics and Electromechanical parts.
All models predict reliability in terms of failure per millions operating
hours (fpmh).
9.
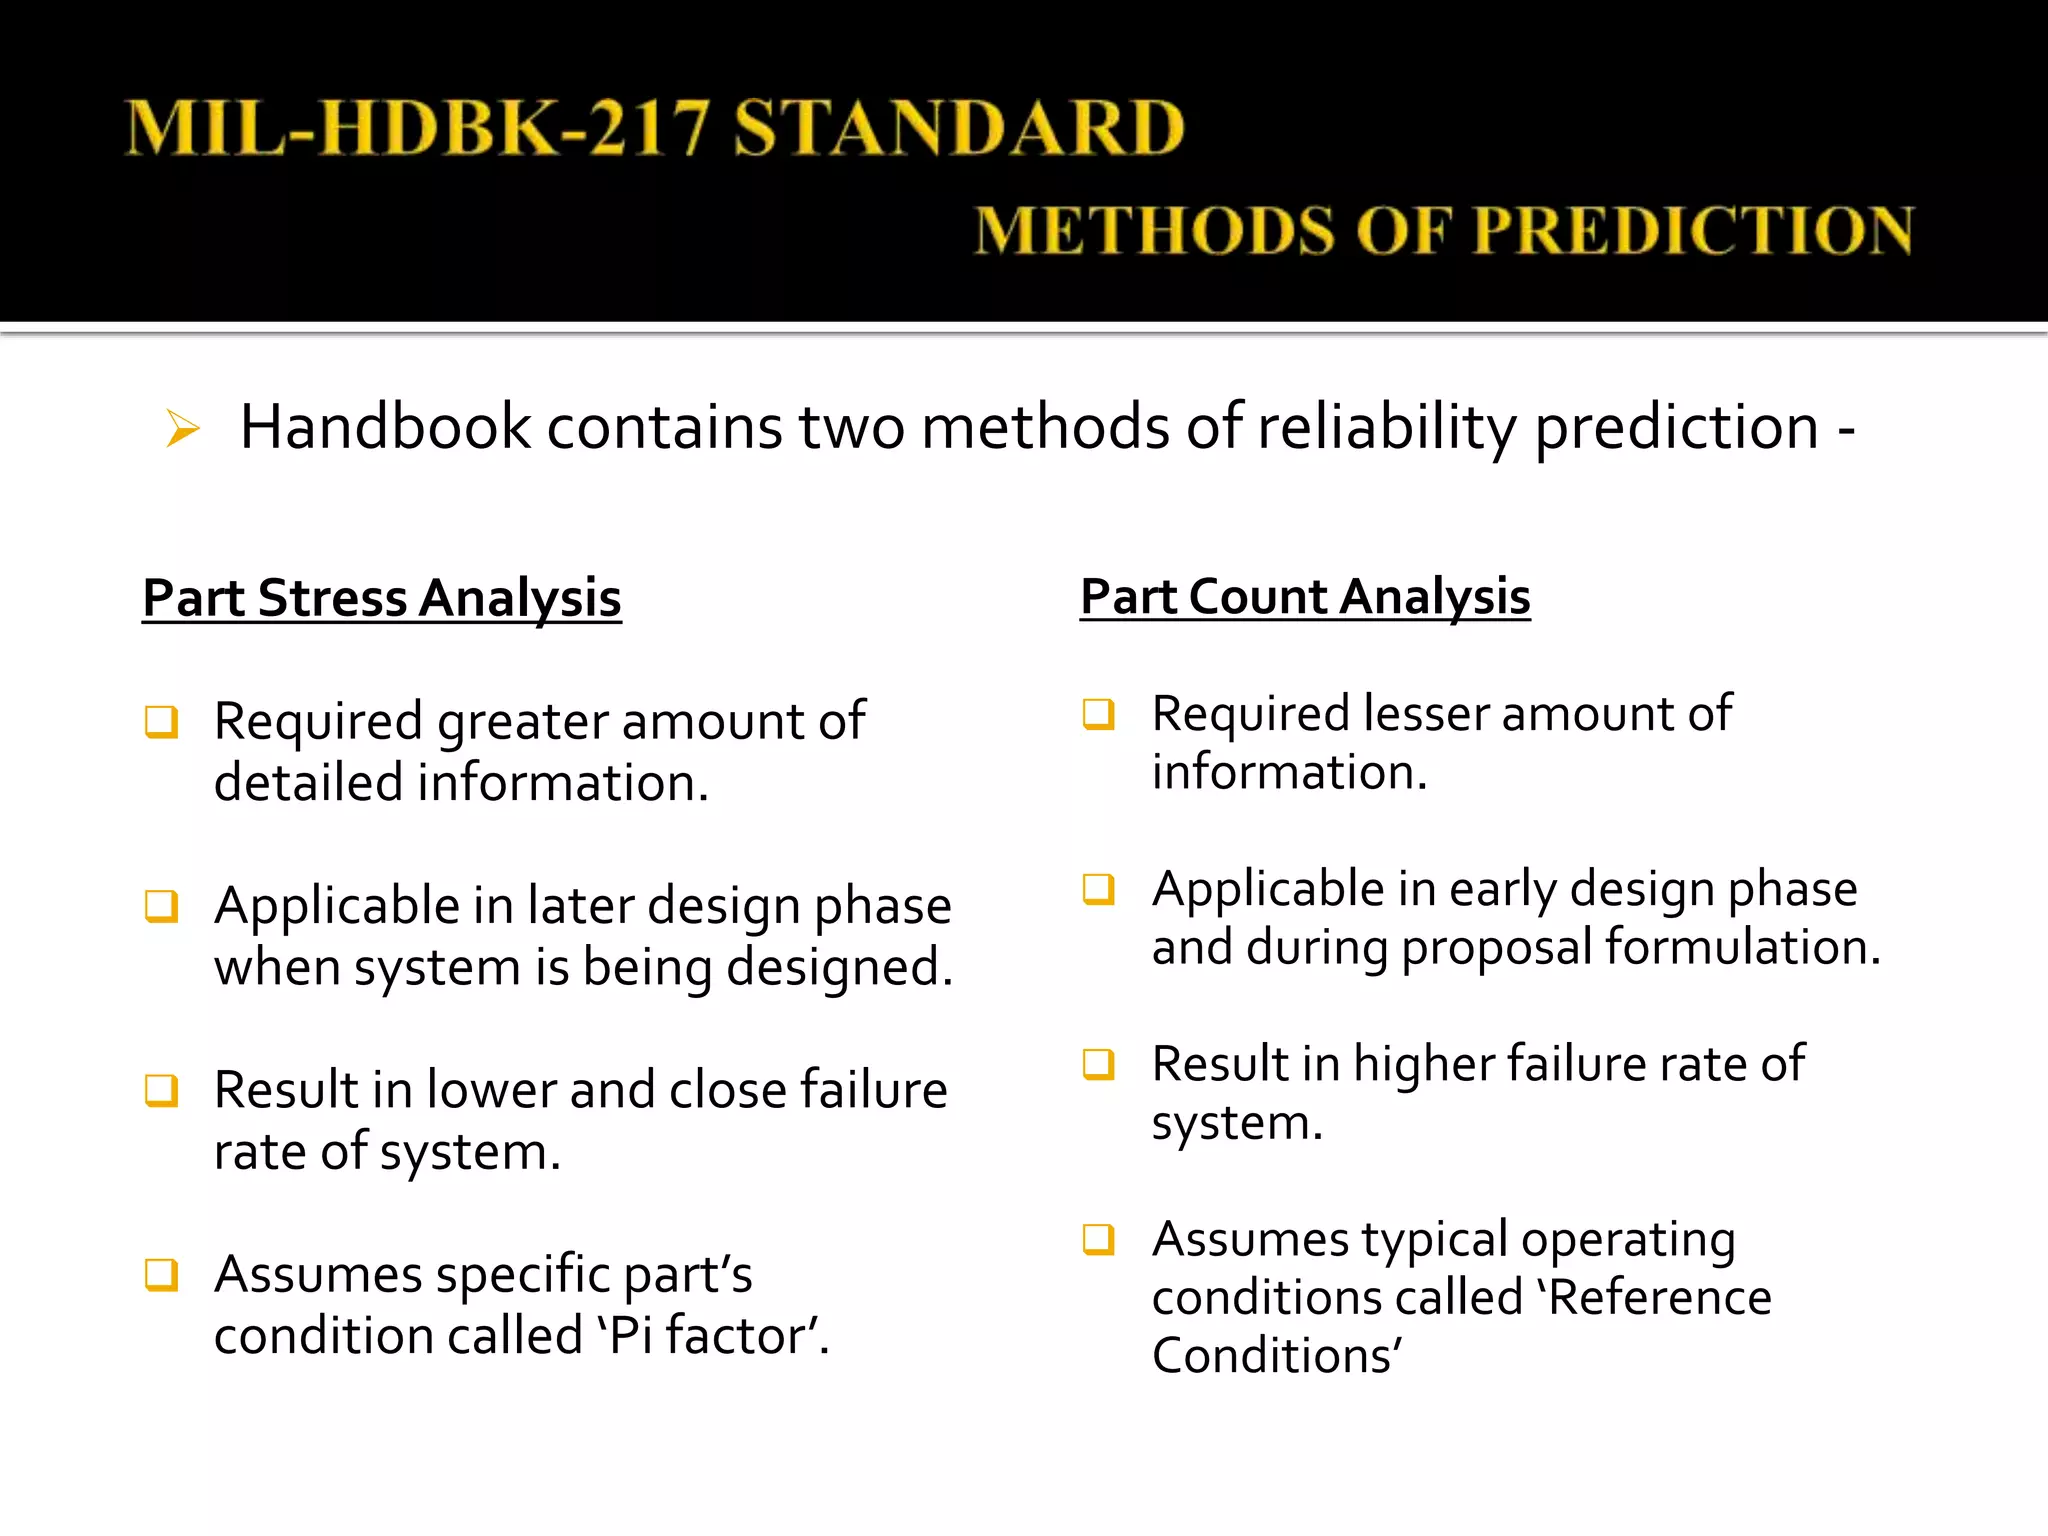
Handbook containstwo methods of reliability prediction -
Part Stress Analysis
Required greater amount of
detailed information.
Applicable in later design phase
when system is being designed.
Result in lower and close failure
rate of system.
Assumes specific part’s
condition called ‘Pi factor’.
Part Count Analysis
Required lesser amount of
information.
Applicable in early design phase
and during proposal formulation.
Result in higher failure rate of
system.
Assumes typical operating
conditions called ‘Reference
Conditions’
10.
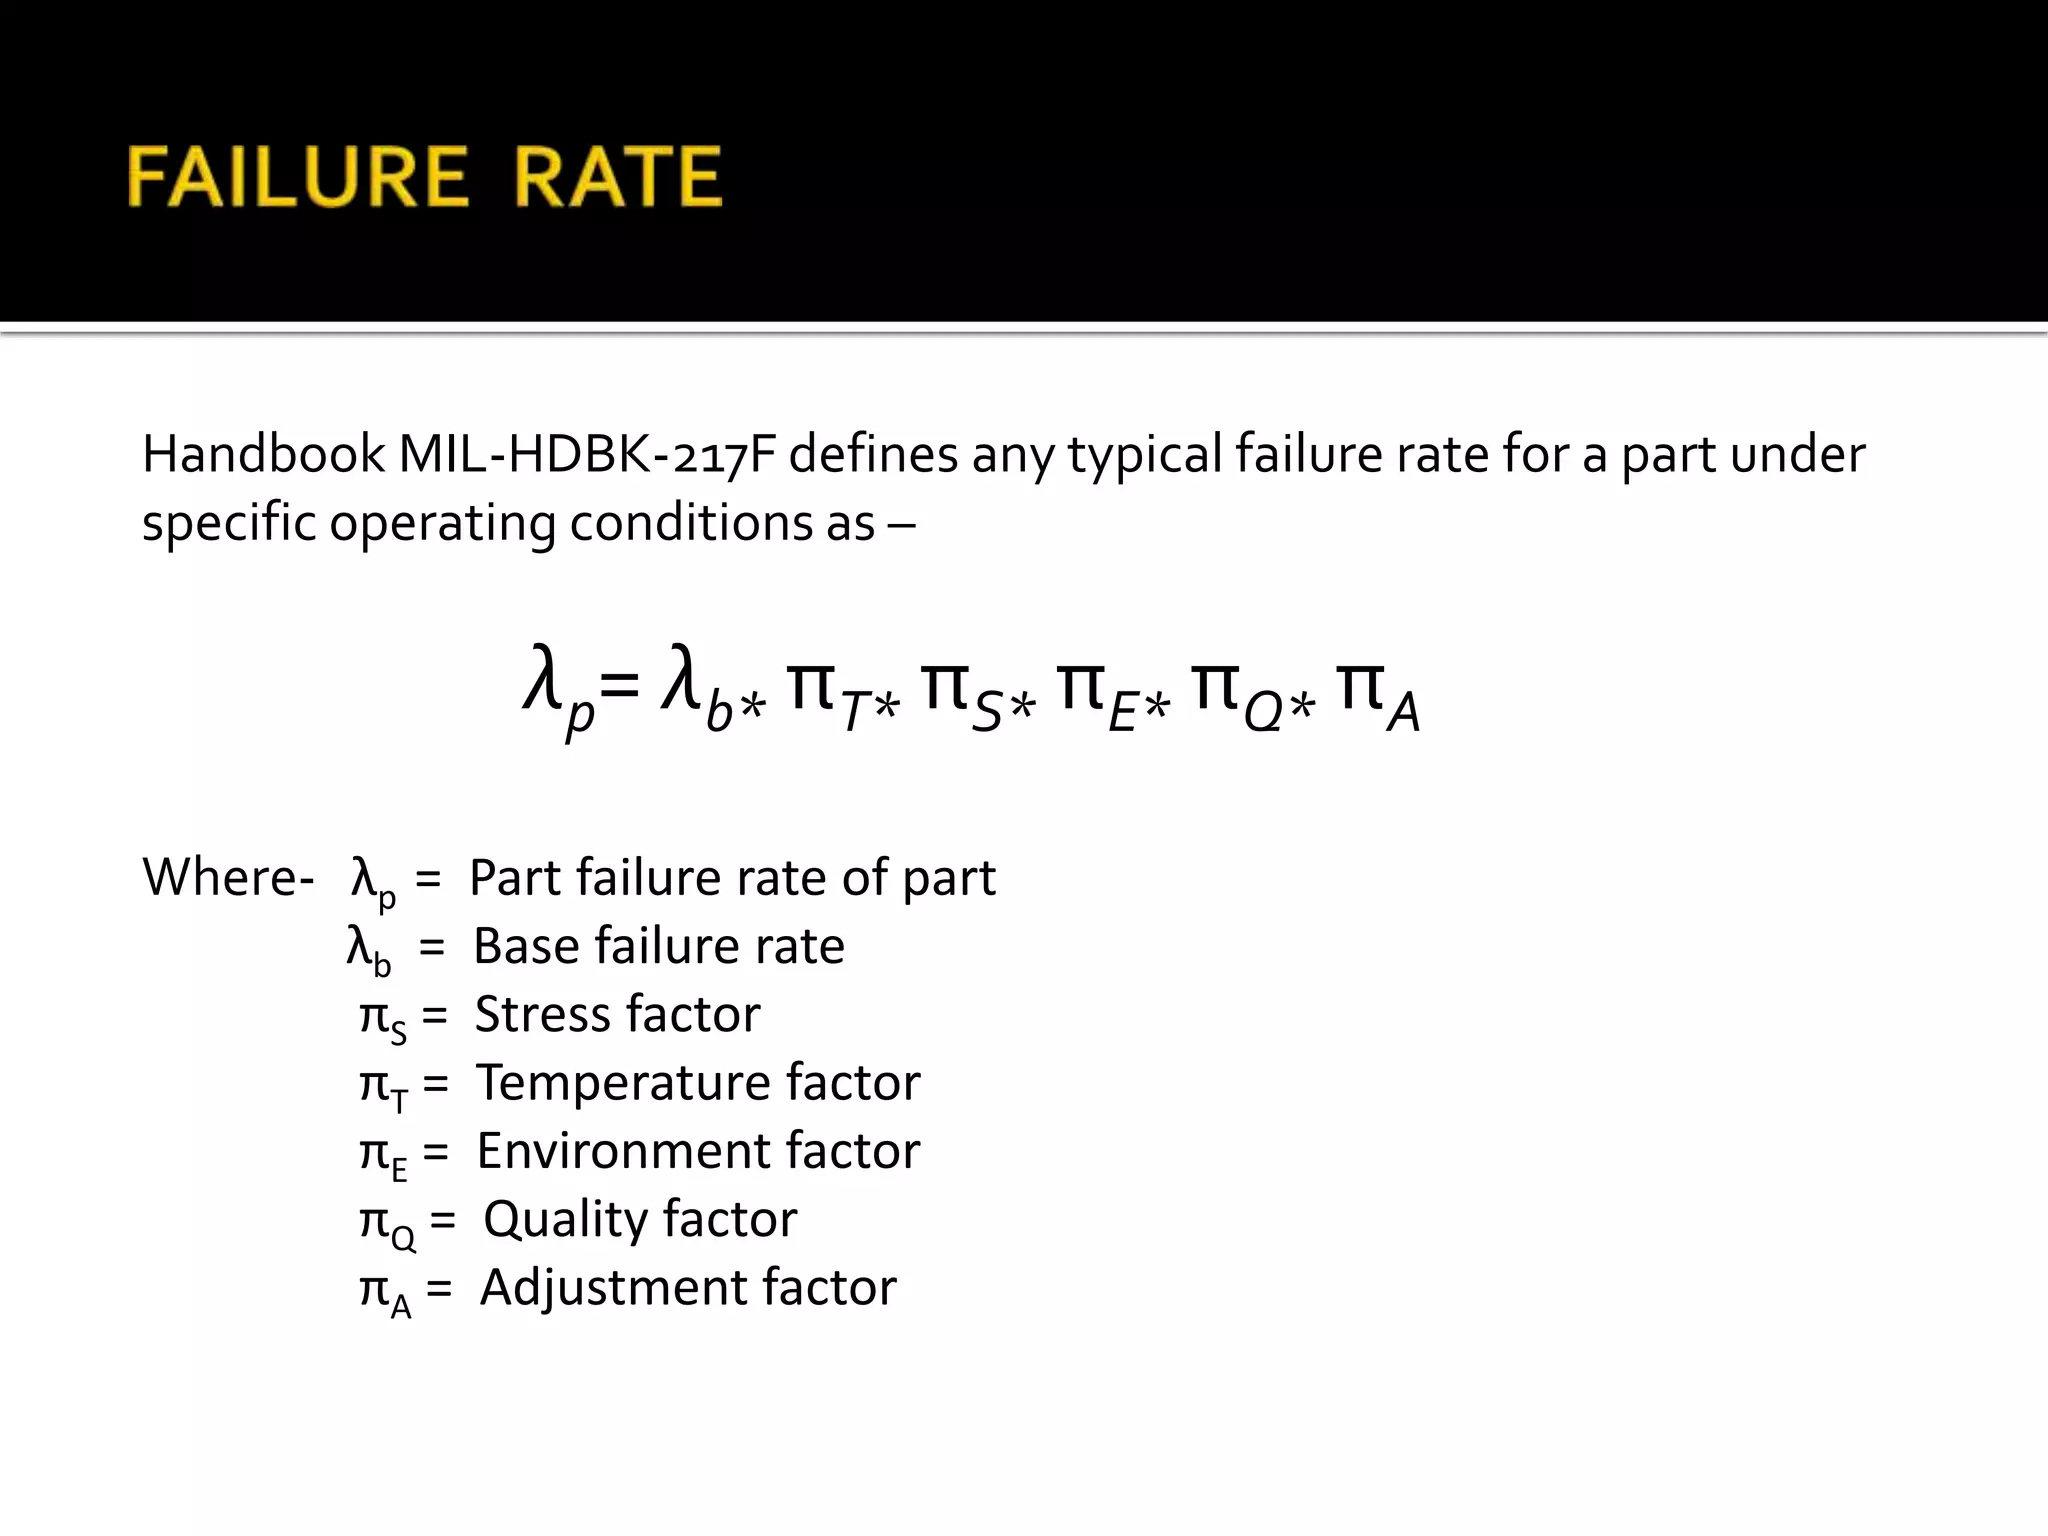
Handbook MIL-HDBK-217F definesany typical failure rate for a part under
specific operating conditions as –
λp= λb* πT* πS* πE* πQ* πA
Where- λp = Part failure rate of part
λb = Base failure rate
πS = Stress factor
πT = Temperature factor
πE = Environment factor
πQ = Quality factor
πA = Adjustment factor
11.
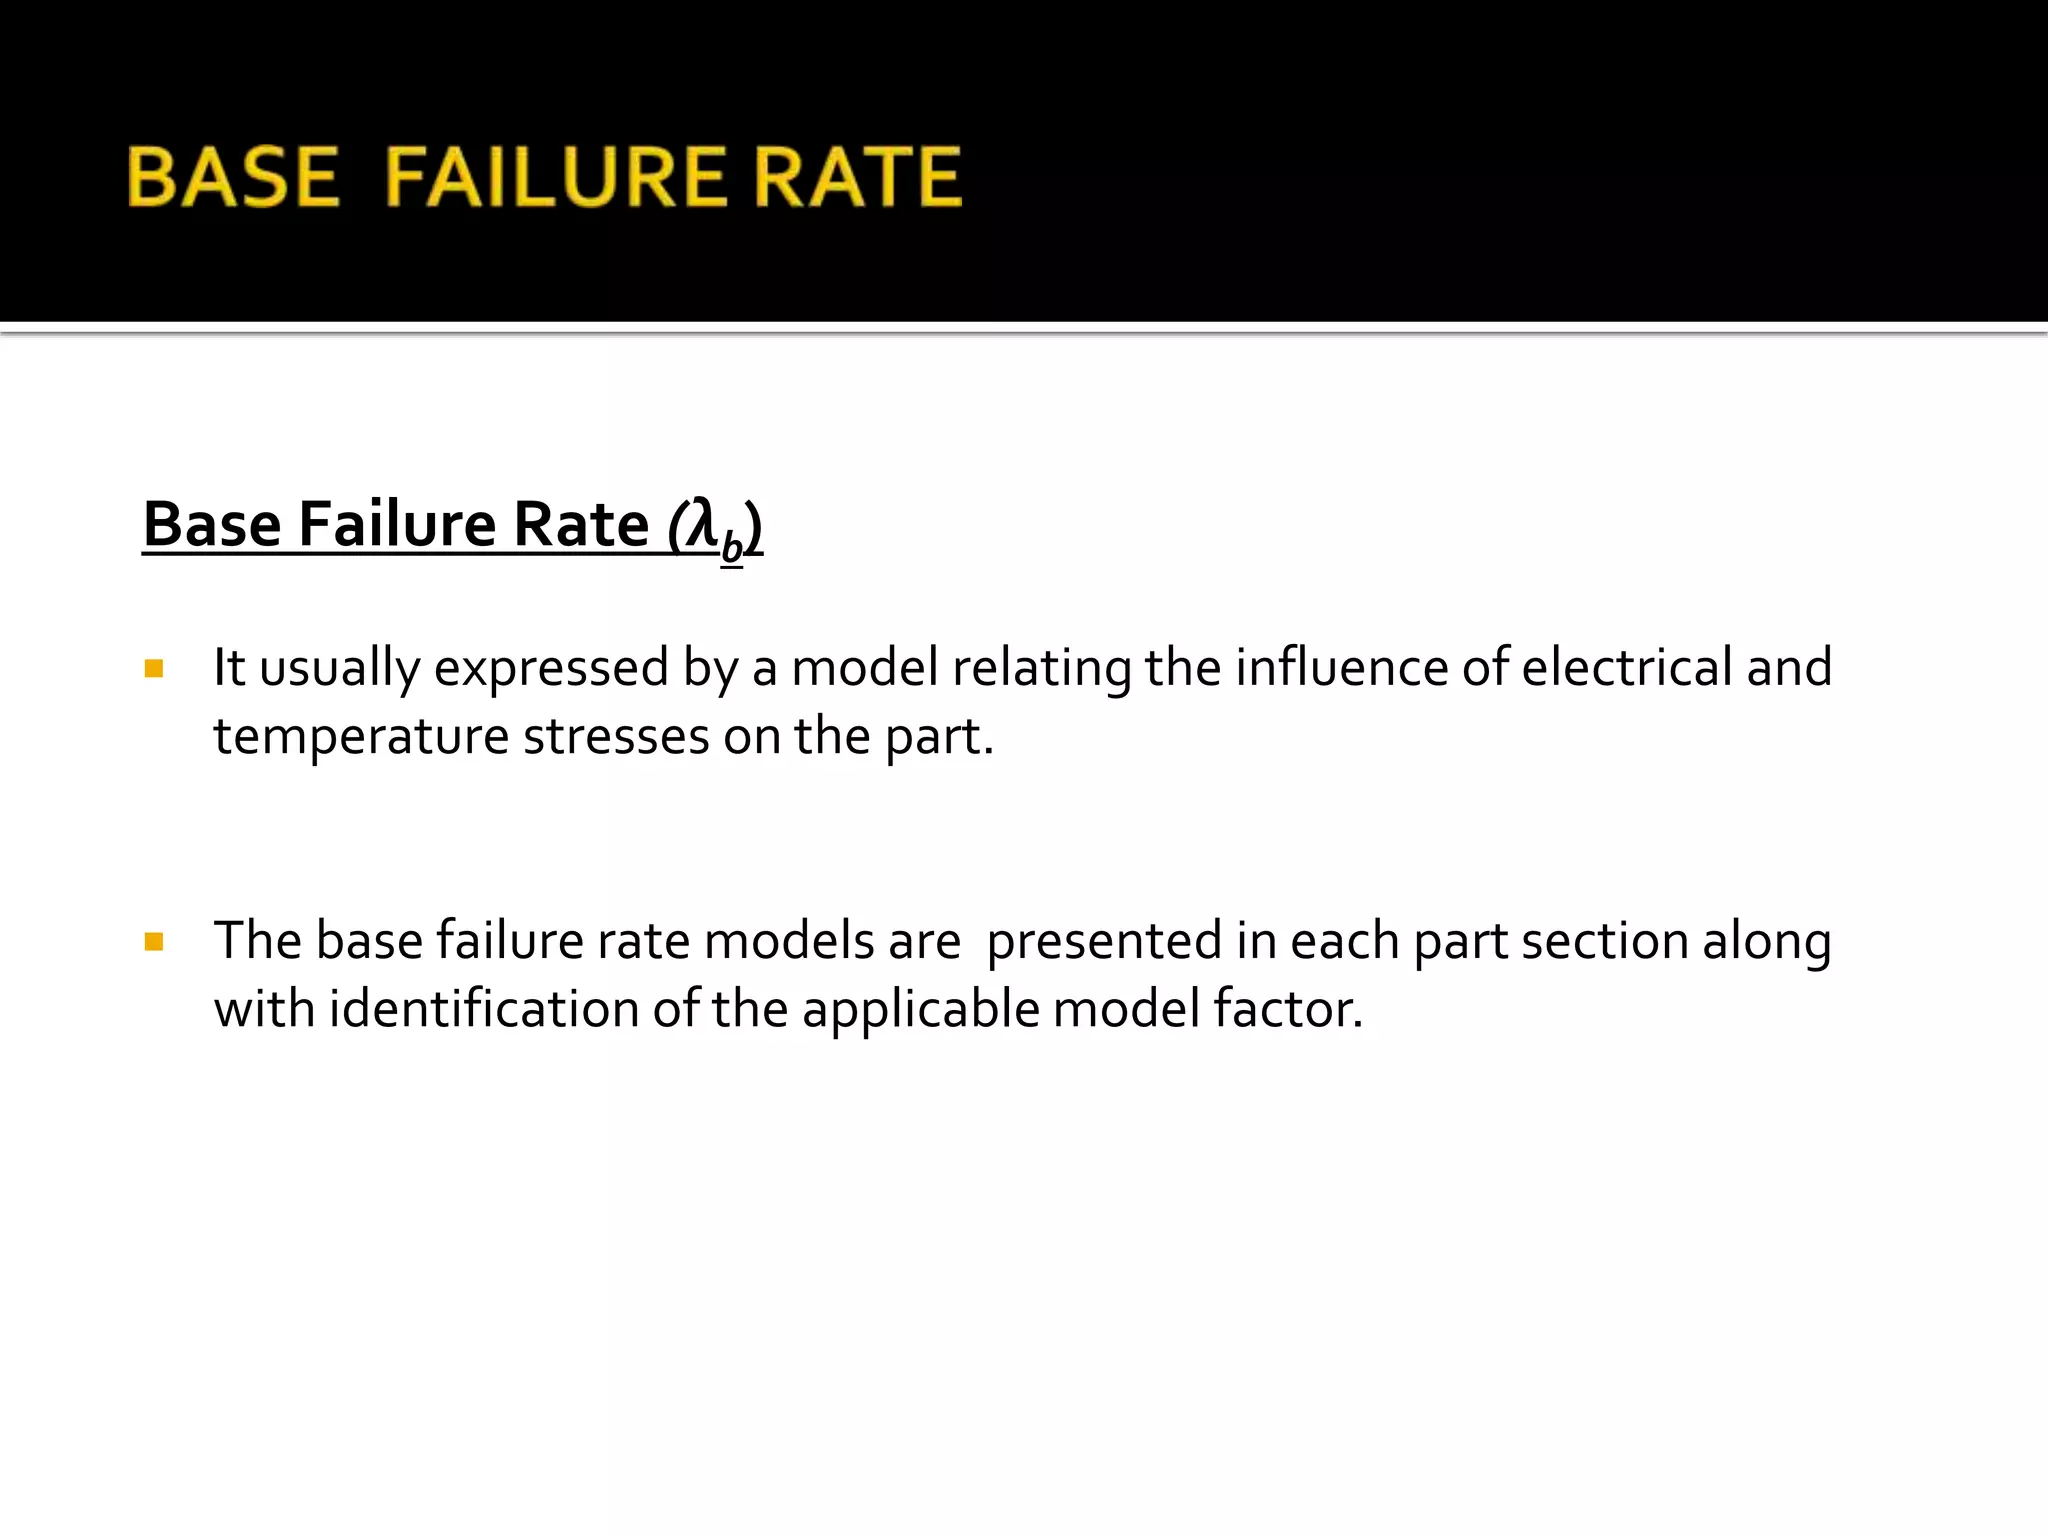
Base Failure Rate(λb)
It usually expressed by a model relating the influence of electrical and
temperature stresses on the part.
The base failure rate models are presented in each part section along
with identification of the applicable model factor.
12.
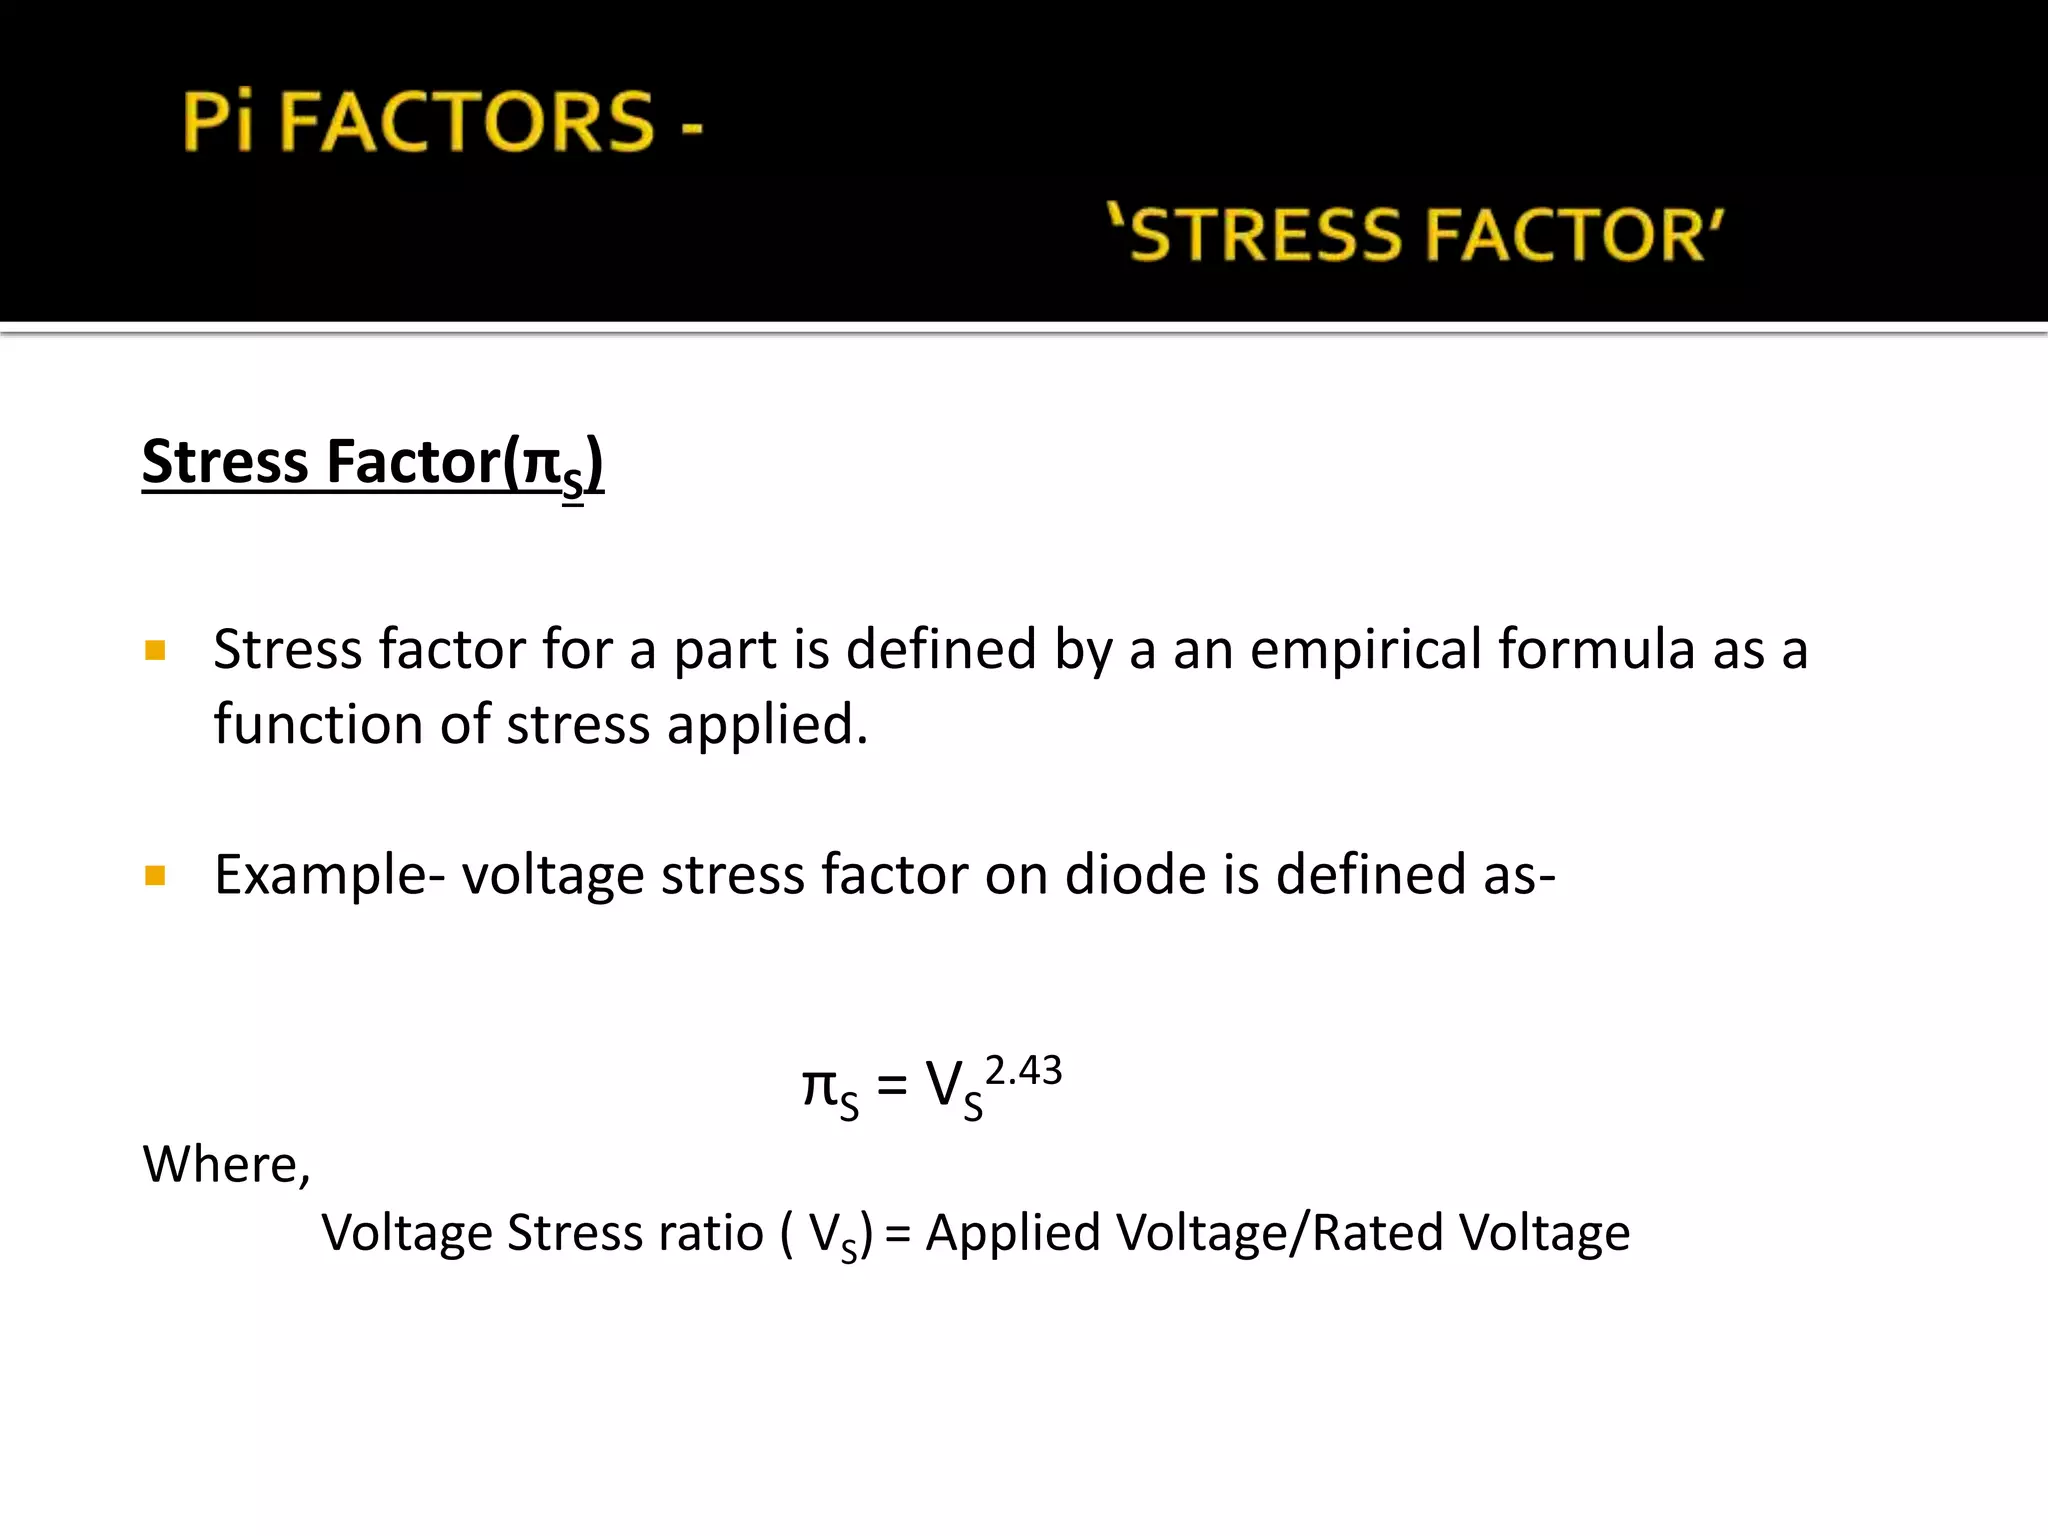
Stress Factor(πS)
Stressfactor for a part is defined by a an empirical formula as a
function of stress applied.
Example- voltage stress factor on diode is defined as-
πS = VS
2.43
Where,
Voltage Stress ratio ( VS) = Applied Voltage/Rated Voltage
13.
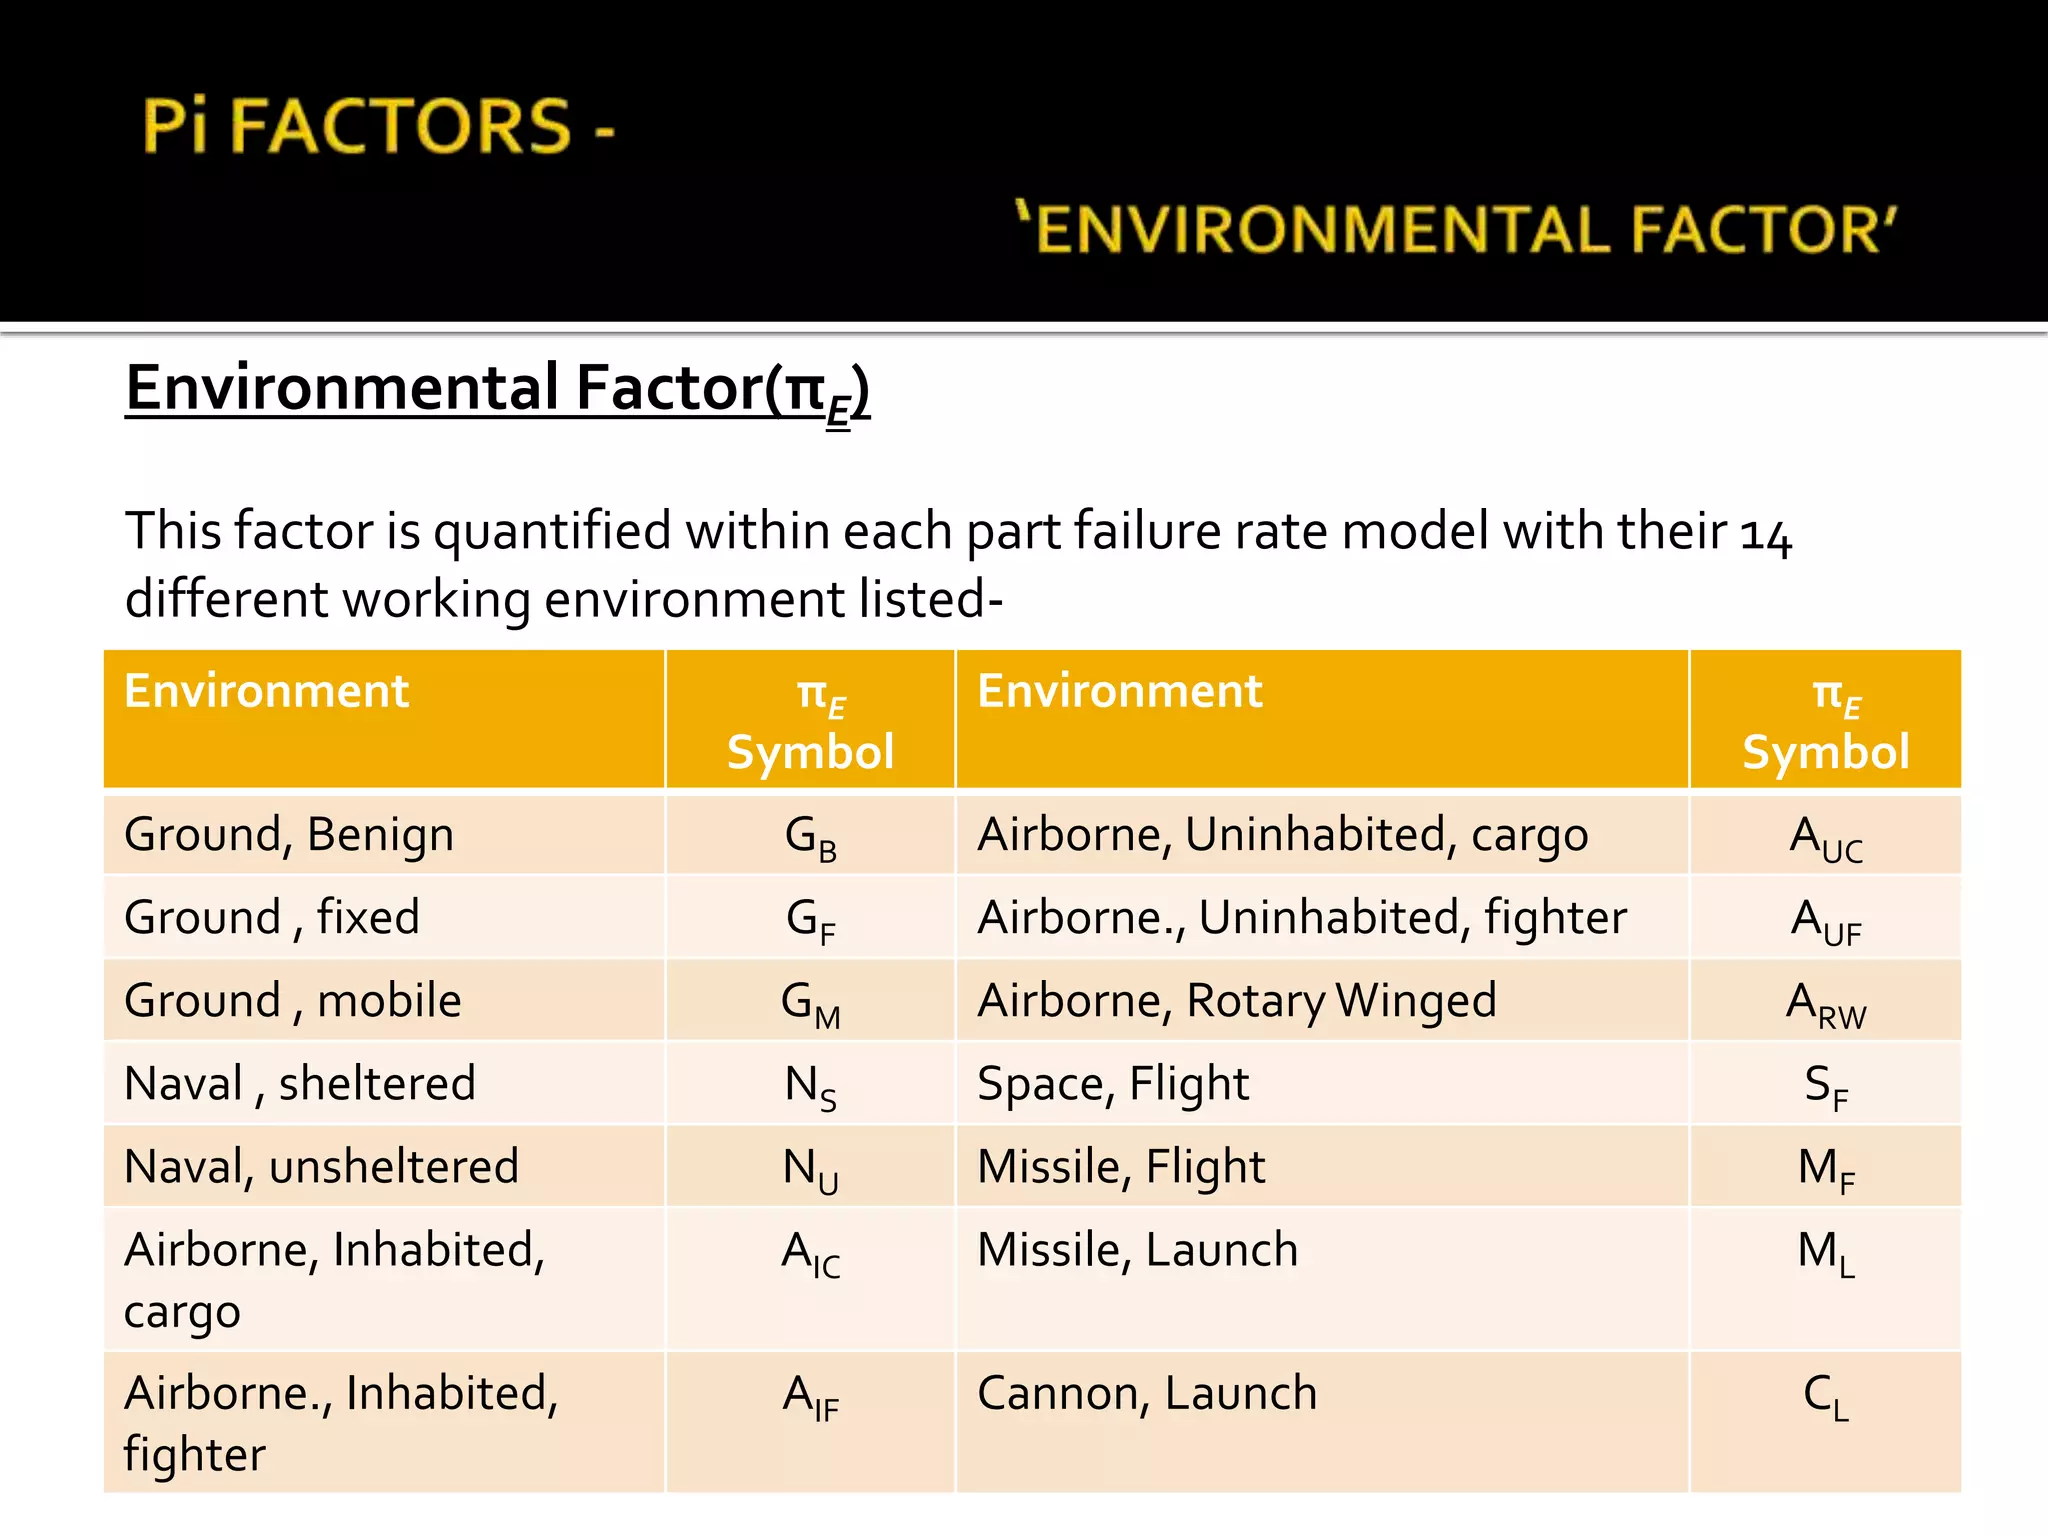
Environmental Factor(πE)
This factoris quantified within each part failure rate model with their 14
different working environment listed-
Environment πE
Symbol
Environment πE
Symbol
Ground, Benign GB Airborne, Uninhabited, cargo AUC
Ground , fixed GF Airborne., Uninhabited, fighter AUF
Ground , mobile GM Airborne, RotaryWinged ARW
Naval , sheltered NS Space, Flight SF
Naval, unsheltered NU Missile, Flight MF
Airborne, Inhabited,
cargo
AIC Missile, Launch ML
Airborne., Inhabited,
fighter
AIF Cannon, Launch CL
14.
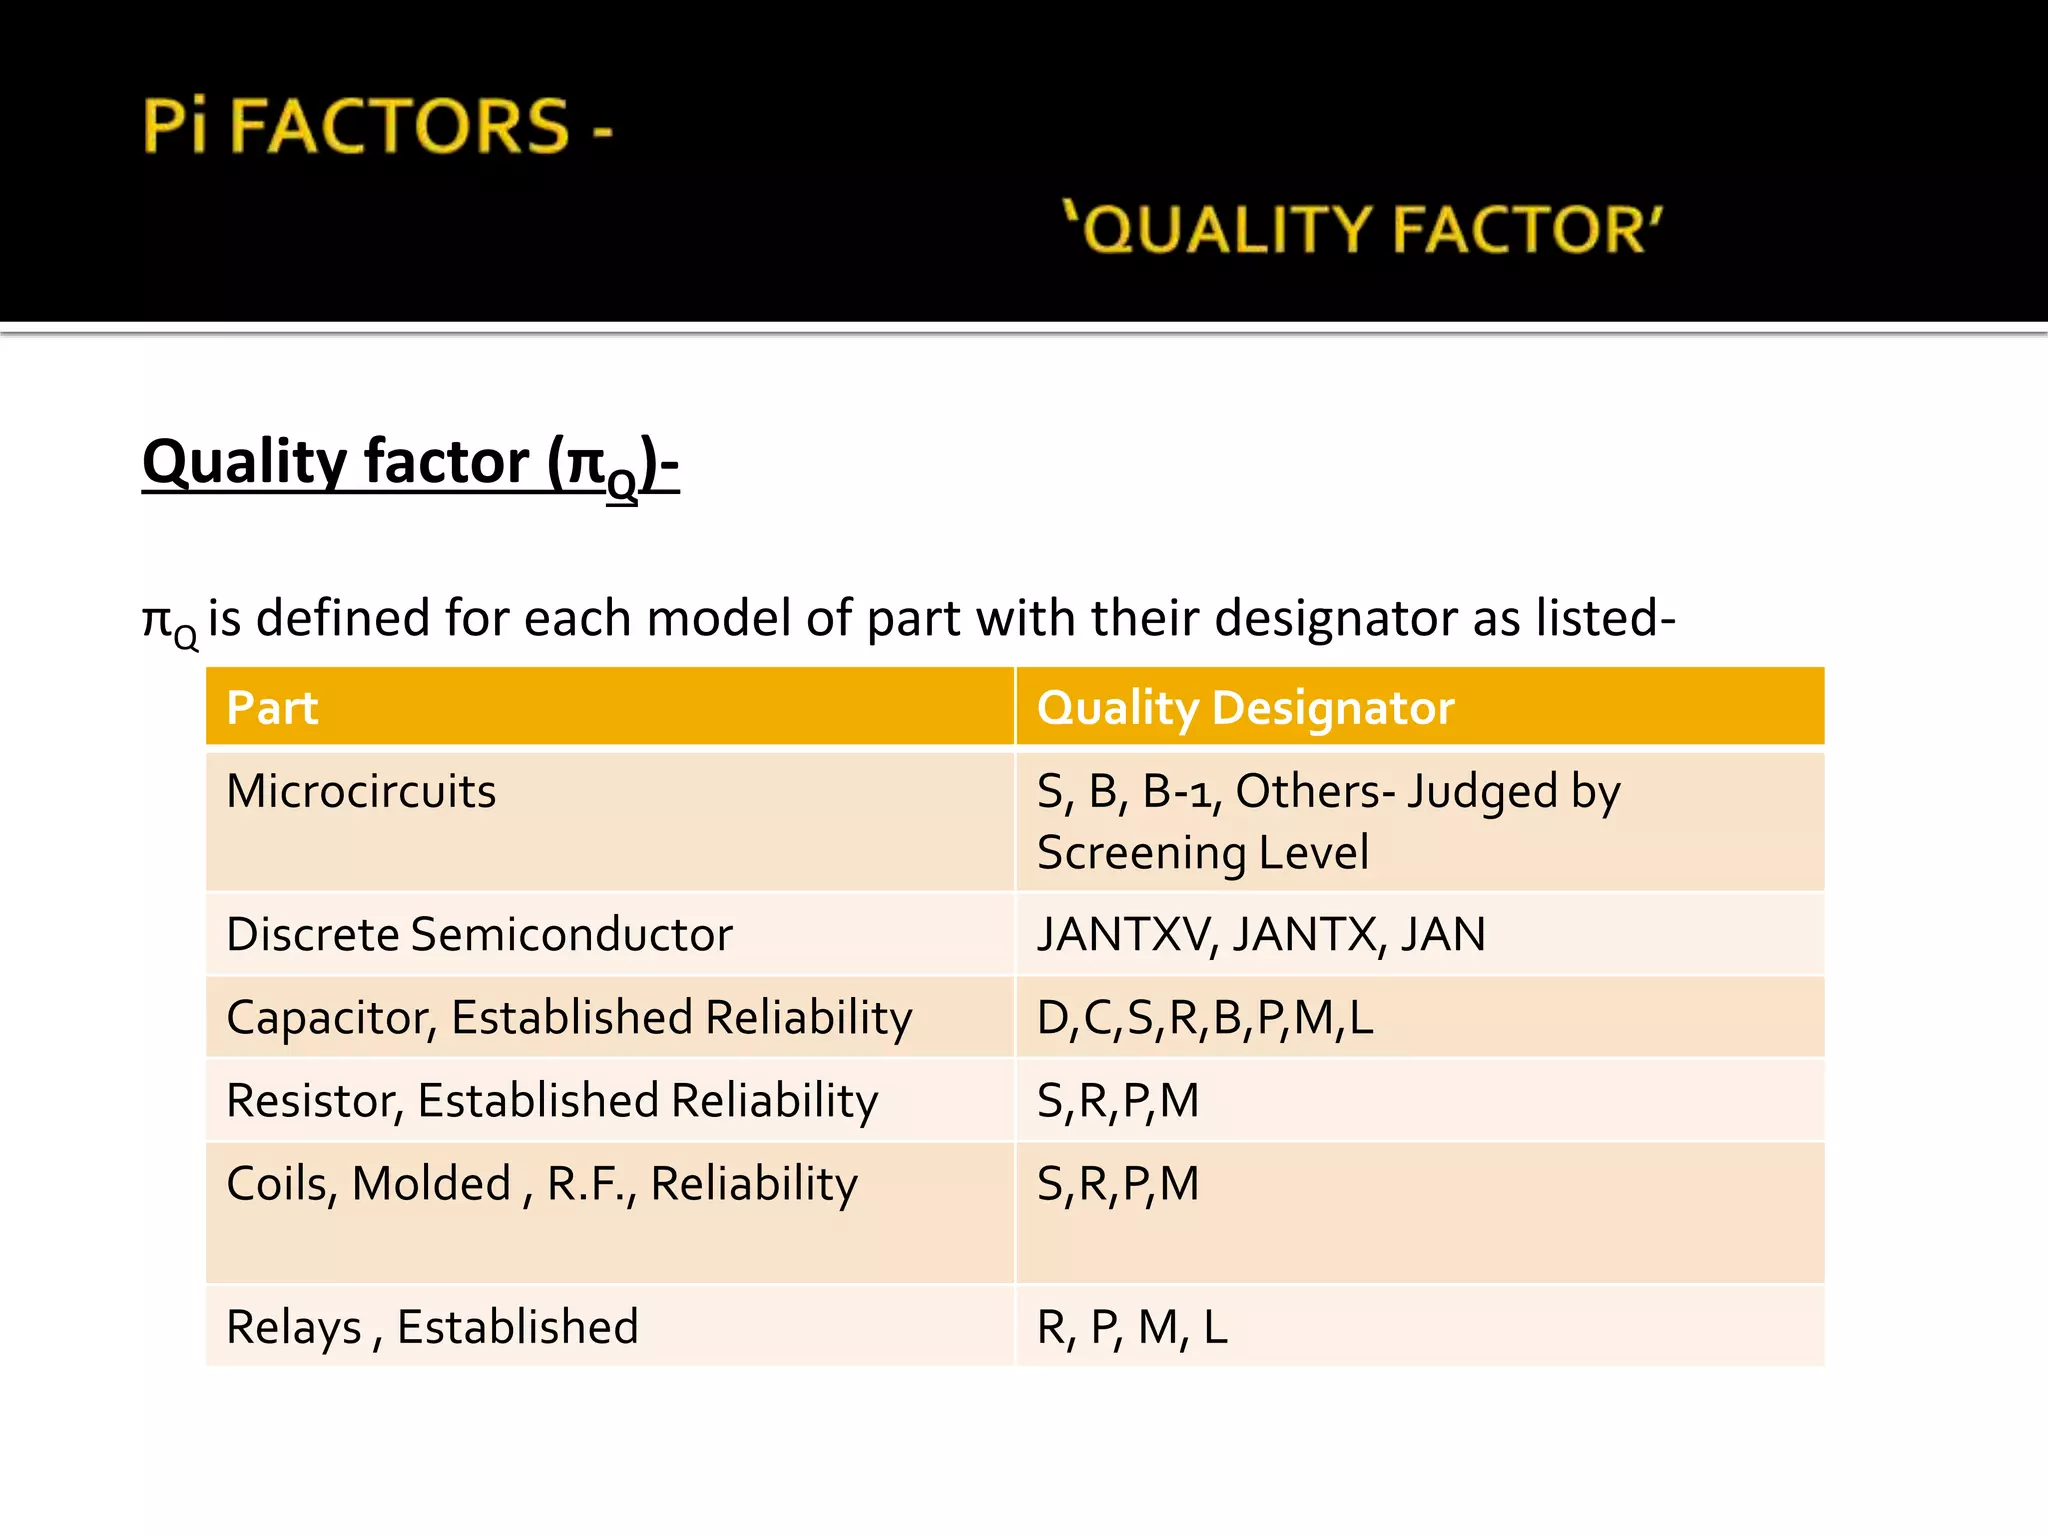
Quality factor (πQ)-
πQis defined for each model of part with their designator as listed-
Part Quality Designator
Microcircuits S, B, B-1, Others- Judged by
Screening Level
Discrete Semiconductor JANTXV, JANTX, JAN
Capacitor, Established Reliability D,C,S,R,B,P,M,L
Resistor, Established Reliability S,R,P,M
Coils, Molded , R.F., Reliability S,R,P,M
Relays , Established R, P, M, L
15.
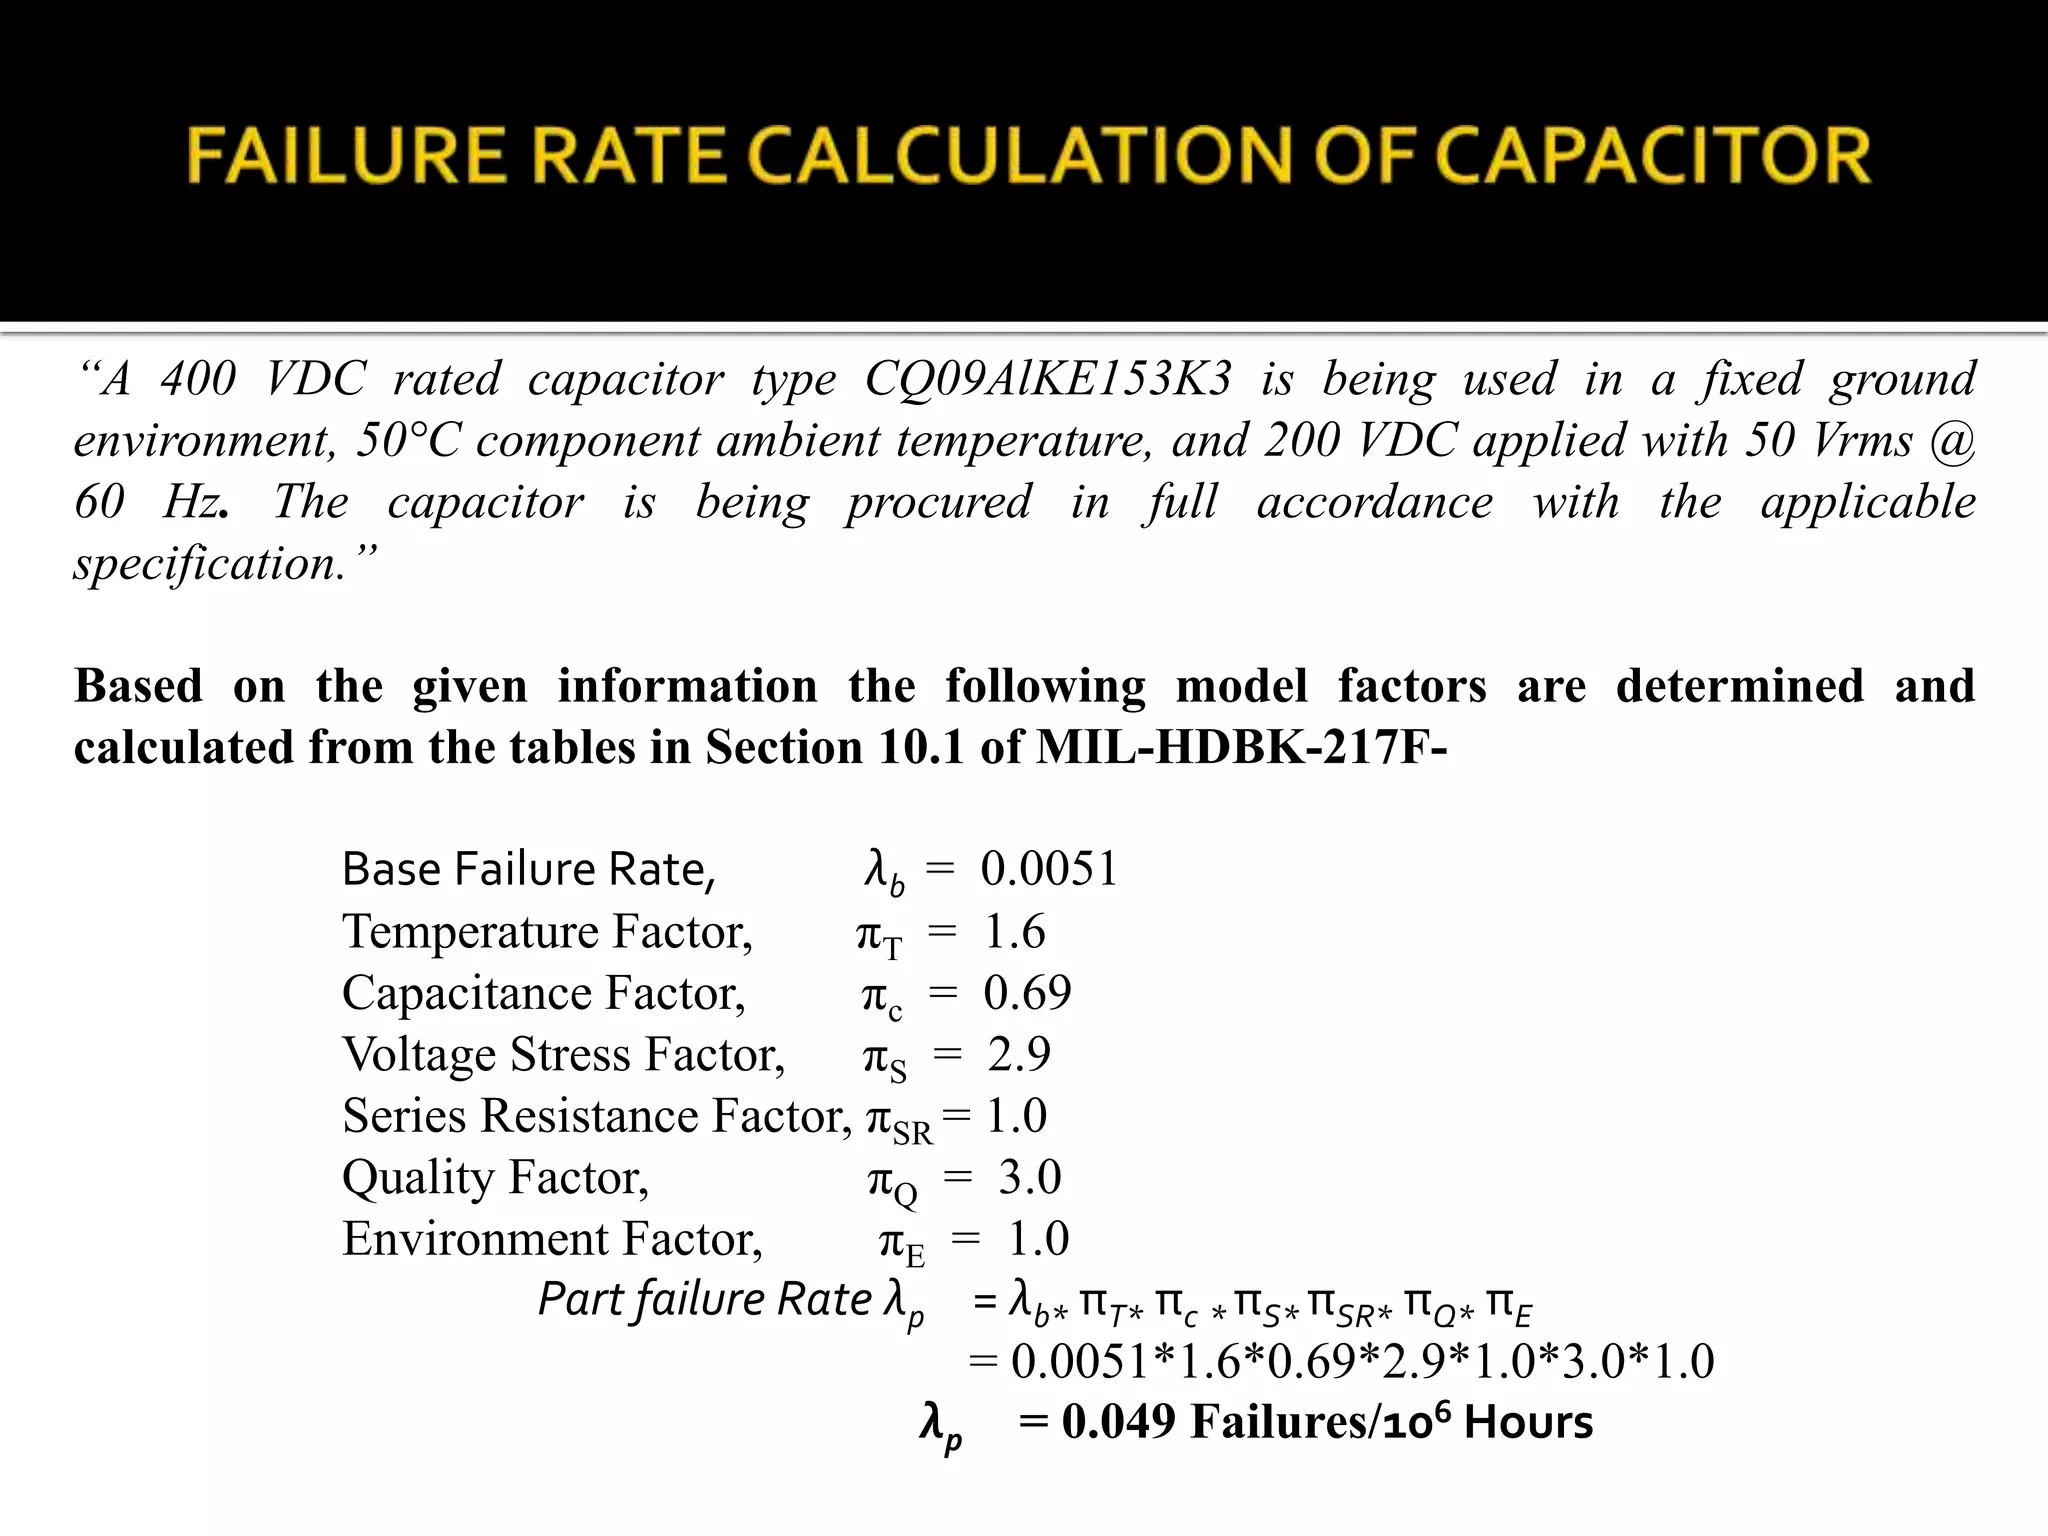
“A 400 VDCrated capacitor type CQ09AlKE153K3 is being used in a fixed ground
environment, 50°C component ambient temperature, and 200 VDC applied with 50 Vrms @
60 Hz. The capacitor is being procured in full accordance with the applicable
specification.”
Based on the given information the following model factors are determined and
calculated from the tables in Section 10.1 of MIL-HDBK-217F-
Base Failure Rate, λb = 0.0051
Temperature Factor, πT = 1.6
Capacitance Factor, πc = 0.69
Voltage Stress Factor, πS = 2.9
Series Resistance Factor, πSR = 1.0
Quality Factor, πQ = 3.0
Environment Factor, πE = 1.0
Part failure Rate λp = λb* πT* πc * πS* πSR* πQ* πE
= 0.0051*1.6*0.69*2.9*1.0*3.0*1.0
λp = 0.049 Failures/106 Hours
16.
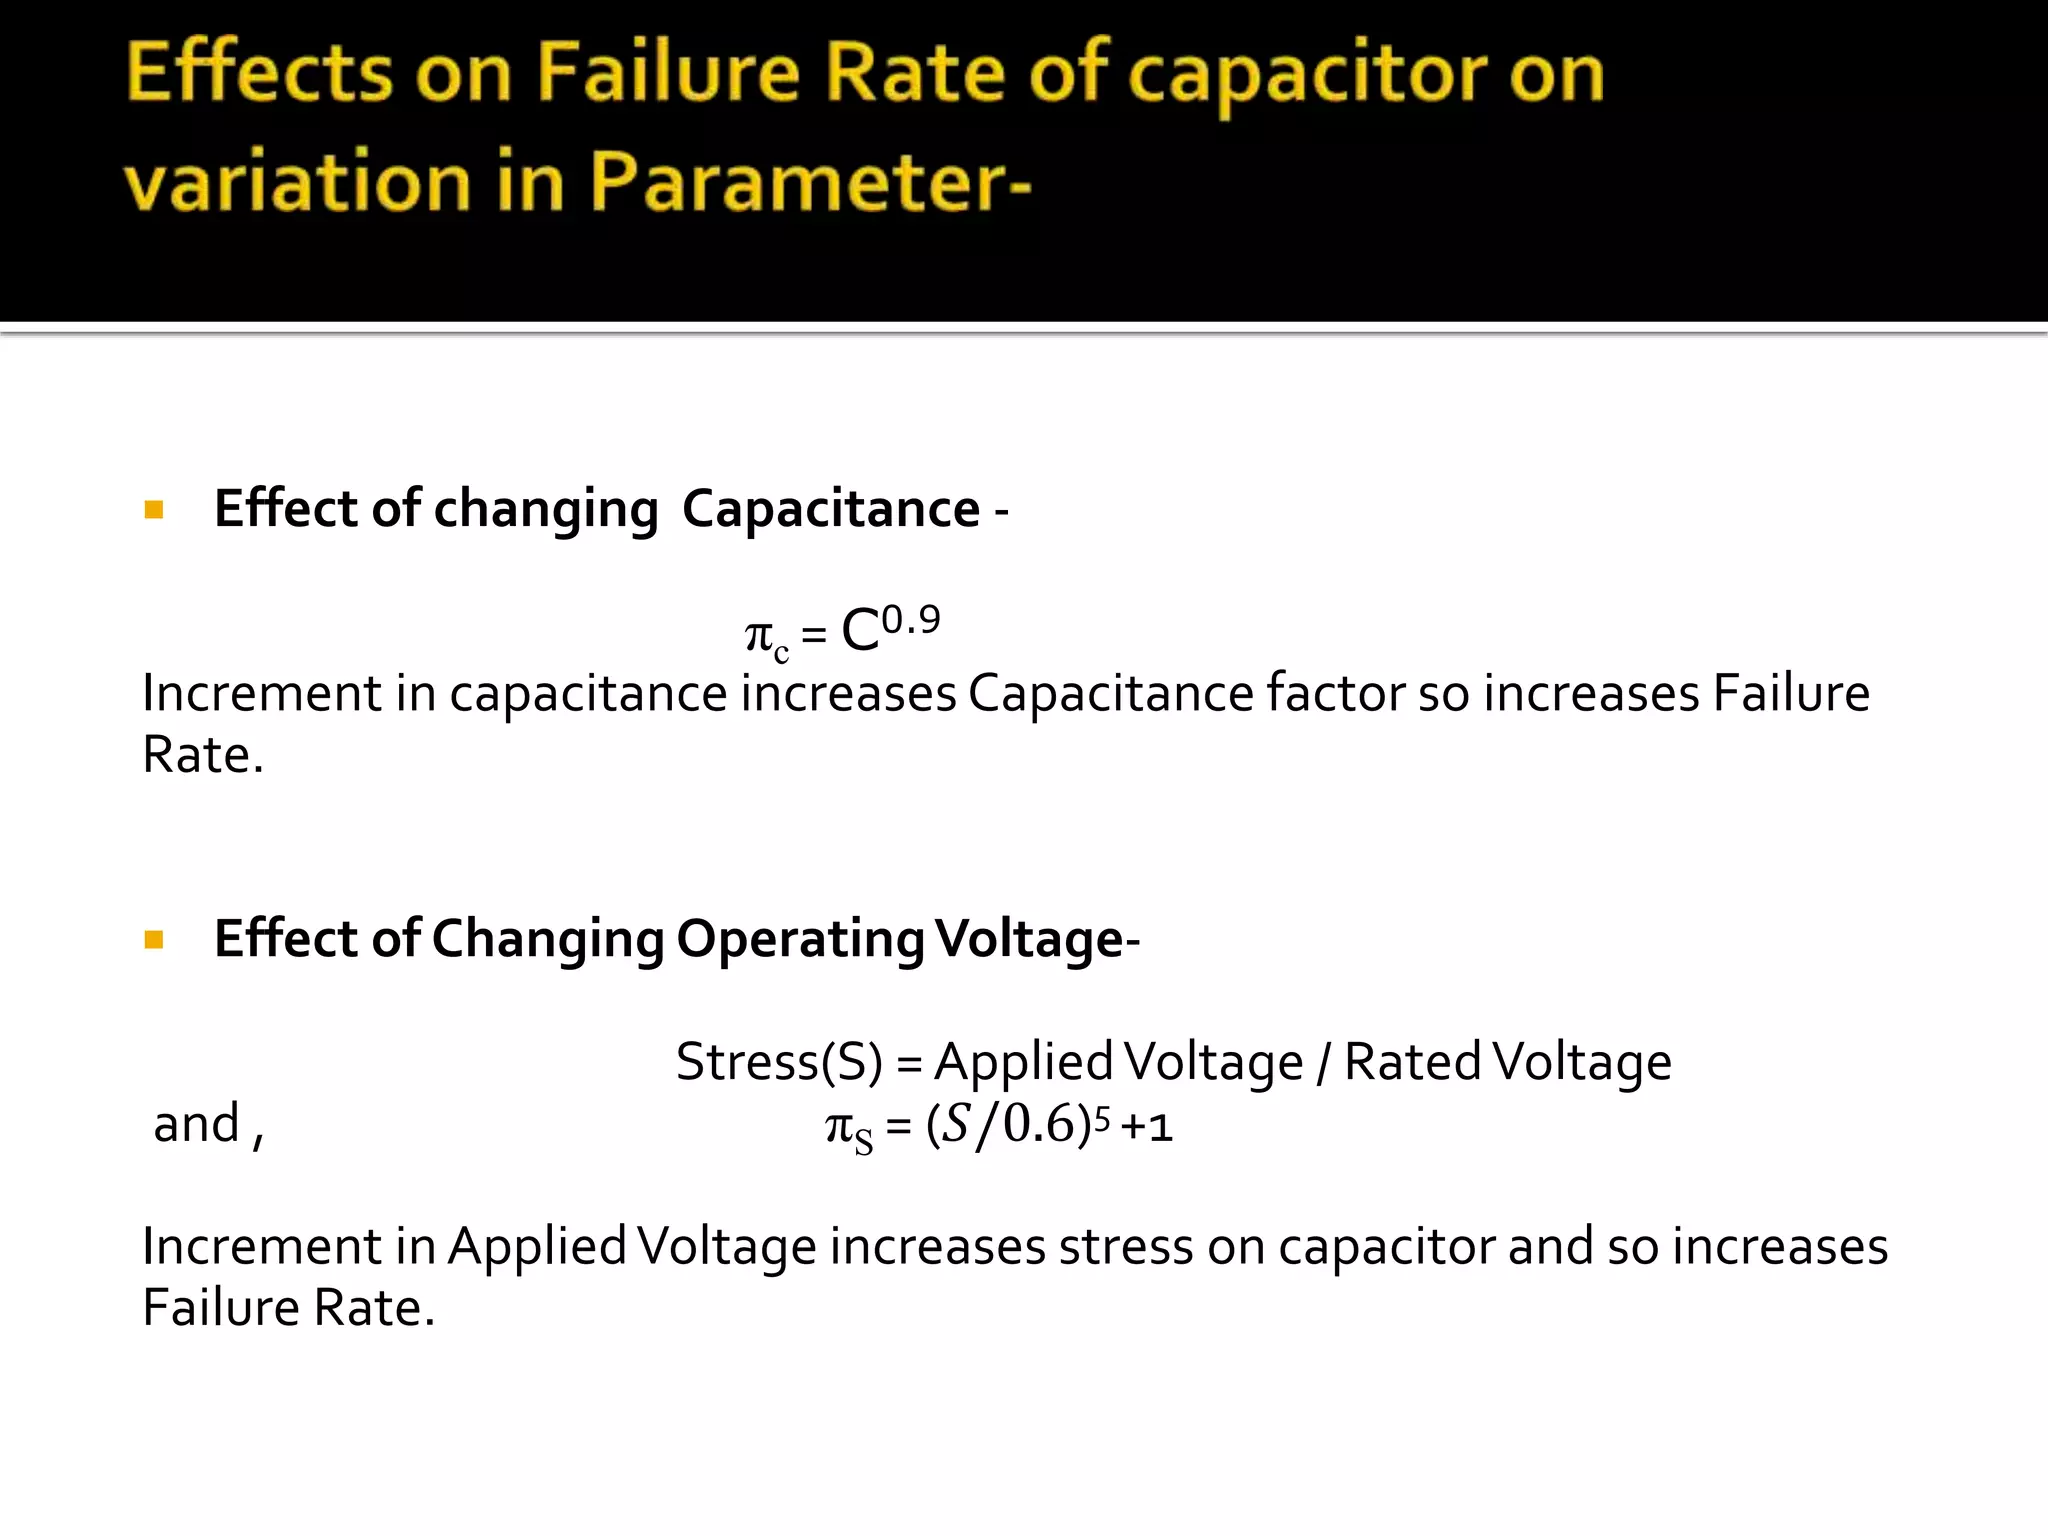
Effect ofchanging Capacitance -
πc = C0.9
Increment in capacitance increases Capacitance factor so increases Failure
Rate.
Effect of Changing OperatingVoltage-
Stress(S) = AppliedVoltage / RatedVoltage
and , πS = (𝑆/0.6)5 +1
Increment inAppliedVoltage increases stress on capacitor and so increases
Failure Rate.
17.
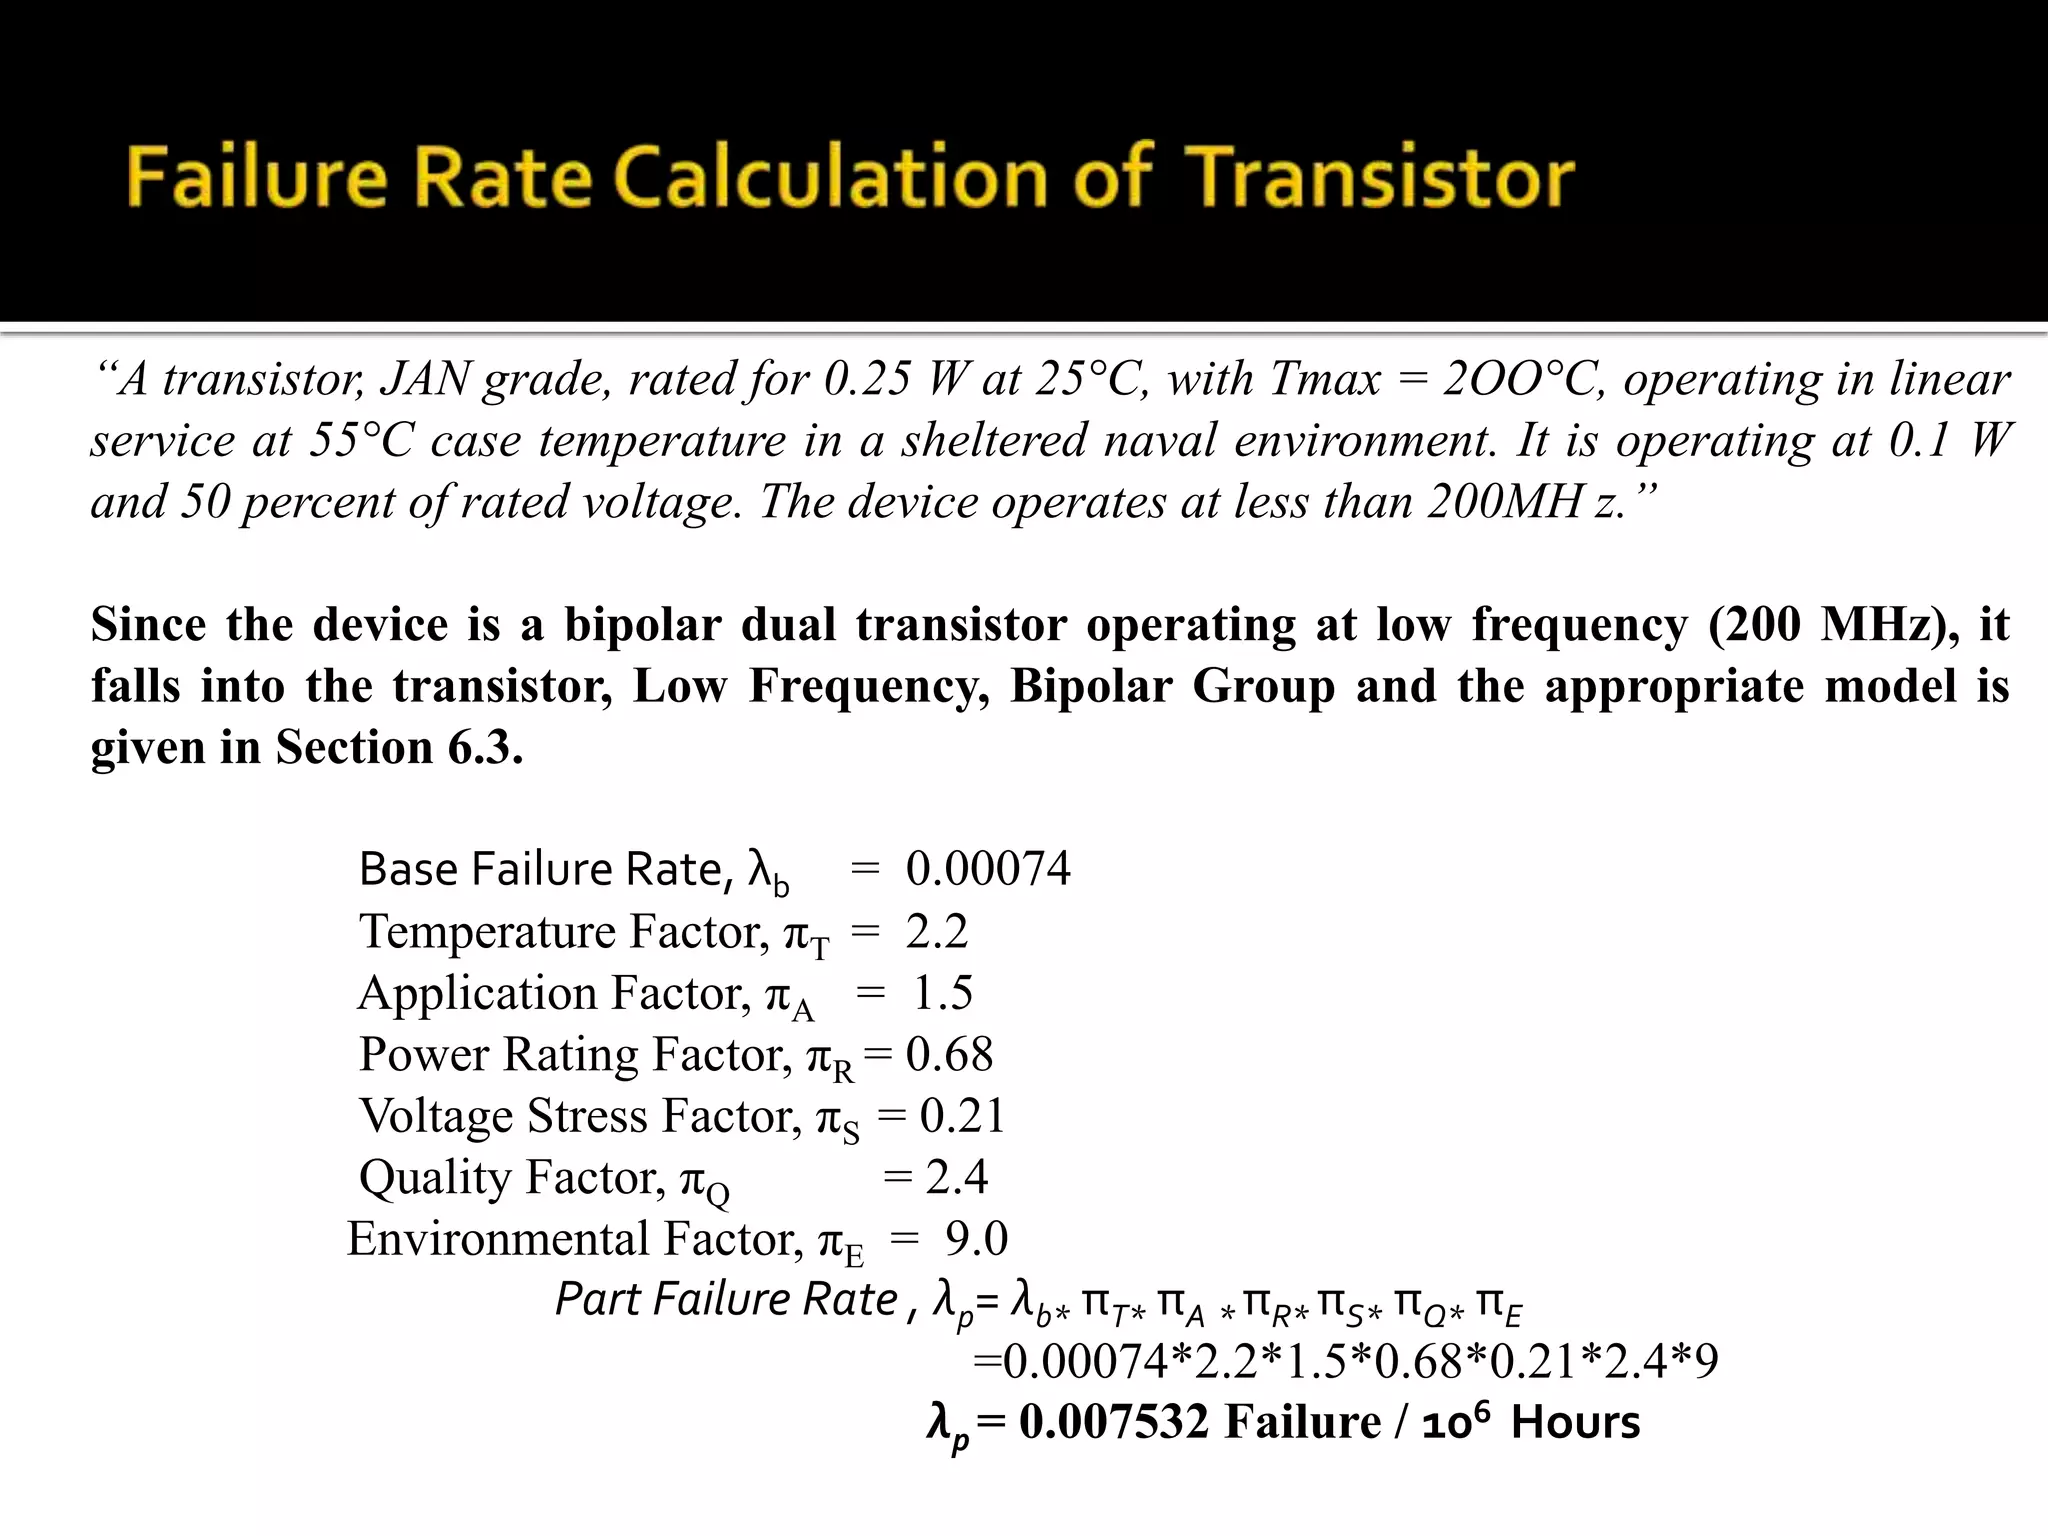
“A transistor, JANgrade, rated for 0.25 W at 25°C, with Tmax = 2OO°C, operating in linear
service at 55°C case temperature in a sheltered naval environment. It is operating at 0.1 W
and 50 percent of rated voltage. The device operates at less than 200MH z.”
Since the device is a bipolar dual transistor operating at low frequency (200 MHz), it
falls into the transistor, Low Frequency, Bipolar Group and the appropriate model is
given in Section 6.3.
Base Failure Rate, λb = 0.00074
Temperature Factor, πT = 2.2
Application Factor, πA = 1.5
Power Rating Factor, πR = 0.68
Voltage Stress Factor, πS = 0.21
Quality Factor, πQ = 2.4
Environmental Factor, πE = 9.0
Part Failure Rate , λp= λb* πT* πA * πR* πS* πQ* πE
=0.00074*2.2*1.5*0.68*0.21*2.4*9
λp = 0.007532 Failure / 106 Hours
18.
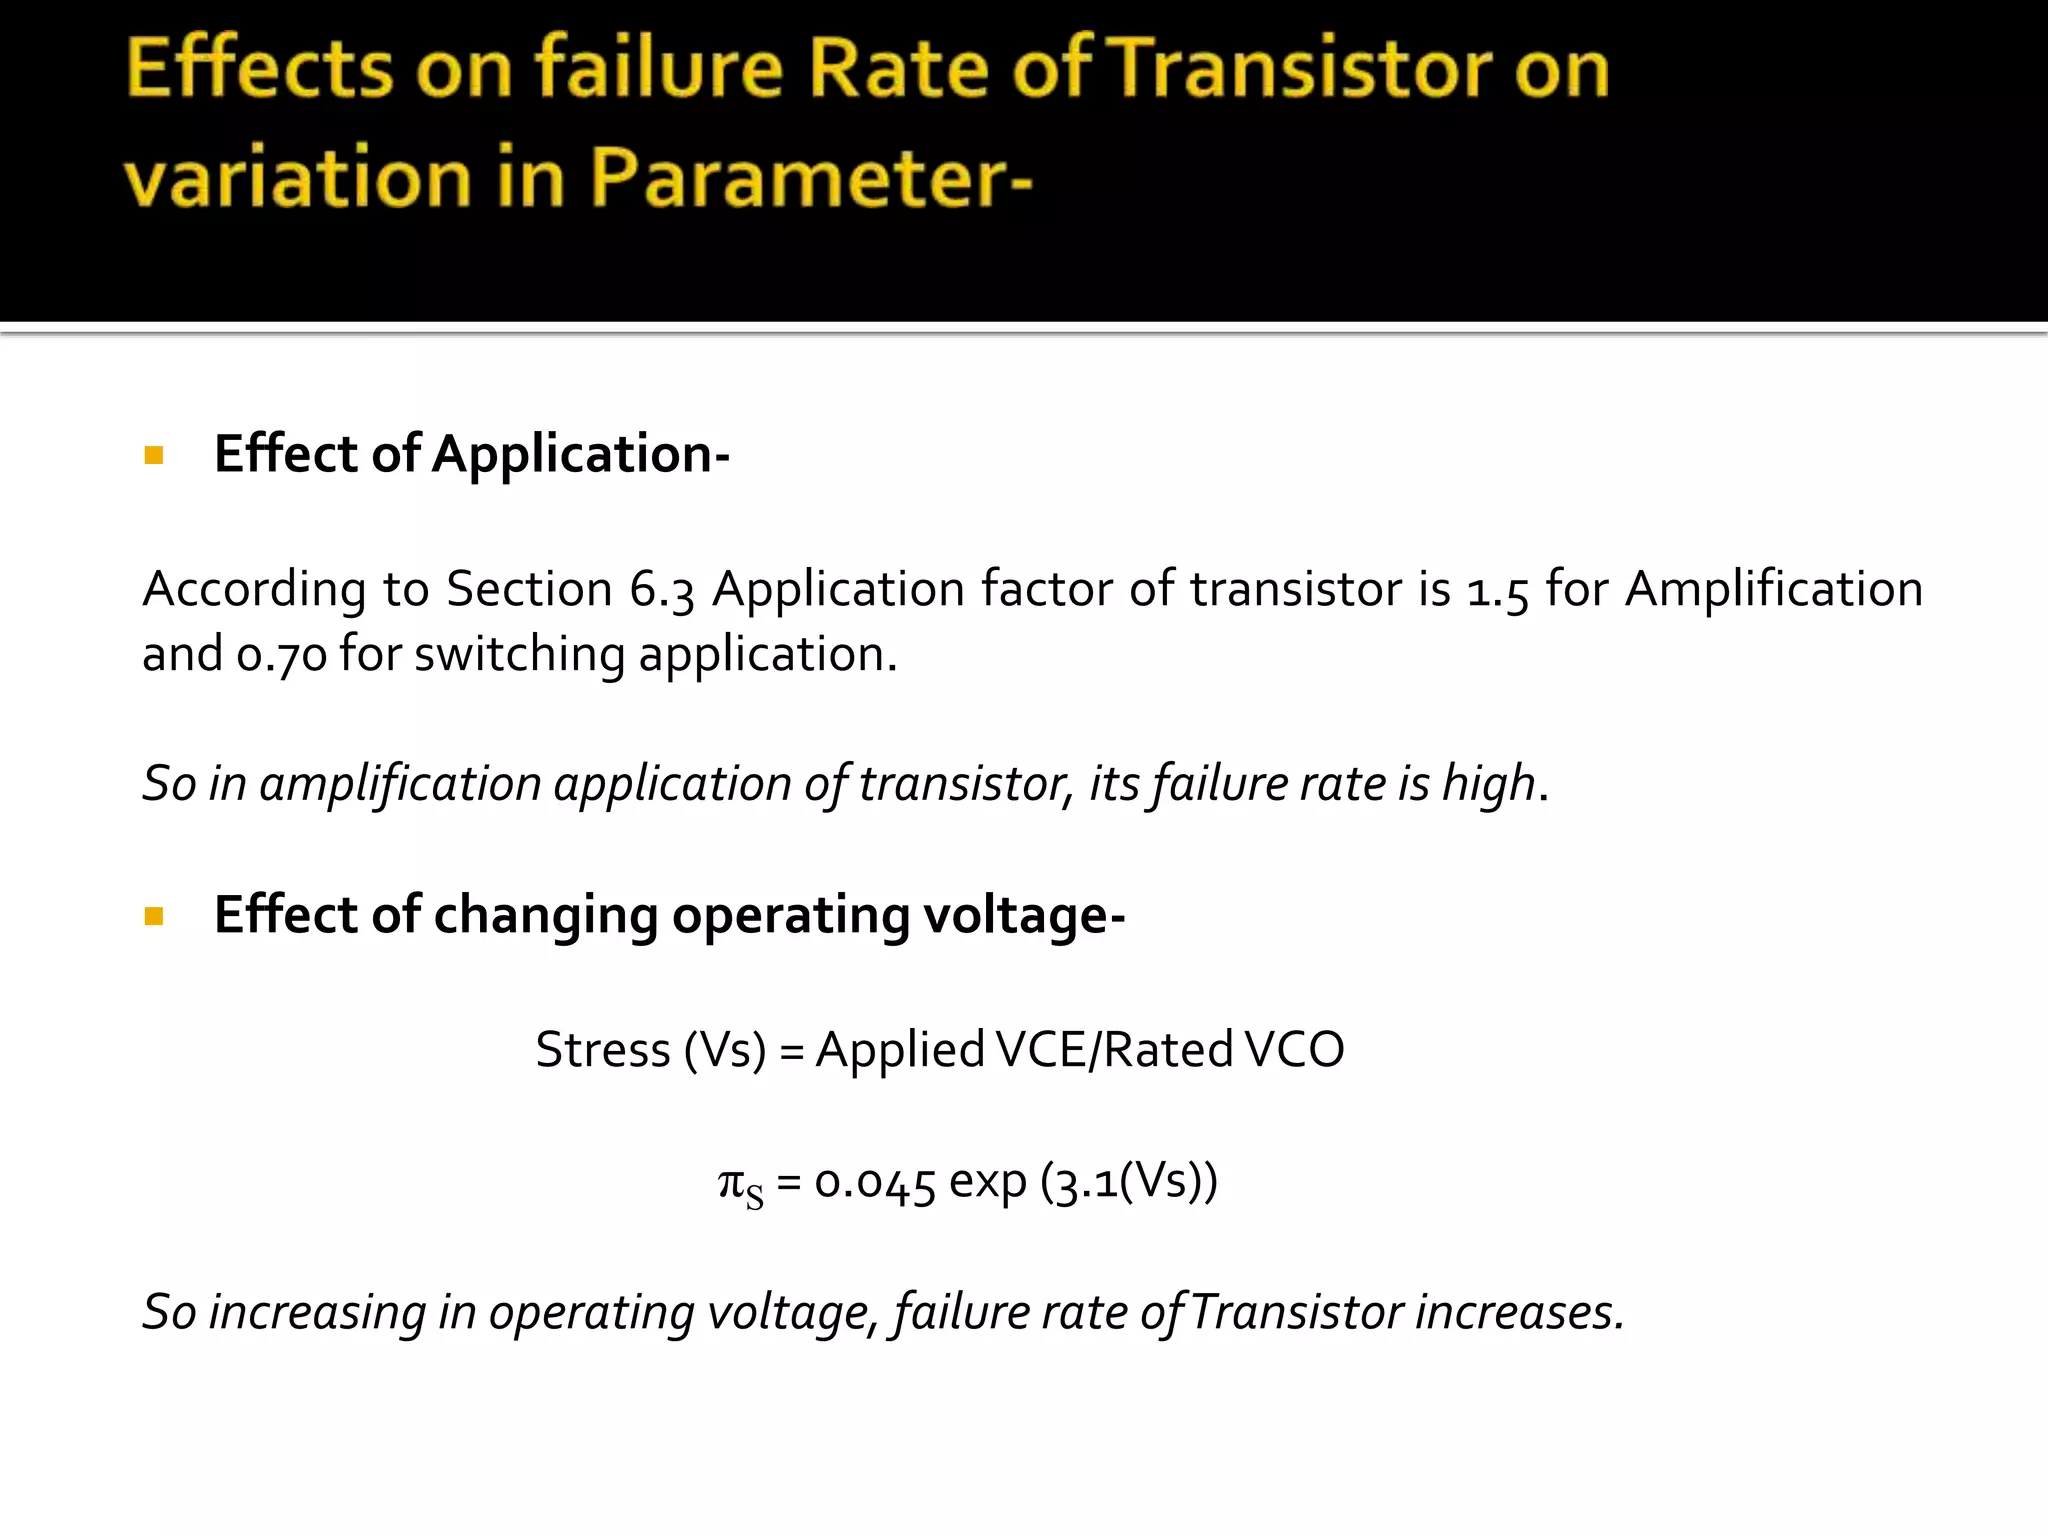
Effect ofApplication-
According to Section 6.3 Application factor of transistor is 1.5 for Amplification
and 0.70 for switching application.
So in amplification application of transistor, its failure rate is high.
Effect of changing operating voltage-
Stress (Vs) = AppliedVCE/RatedVCO
πS = 0.045 exp (3.1(Vs))
So increasing in operating voltage, failure rate ofTransistor increases.