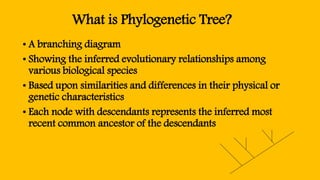
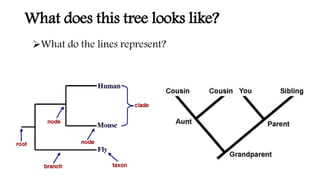
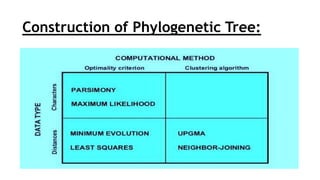
P
H
Y
L
O
G
E
N
E
T
I
C
T
R
E
E
Team-NoFrazzle
•NazmulAhsan 151-15-4668
•FarhanTawsifChowdhury 151-15-4705
•Md.MahbuburRahman 151-15-4761
•Md.SanzidulIslam 151-15-5223
•SadiaSultanaSharmin 151-15-5191
What is Phylogenetic Tree?
• A branching diagram
• Showing the inferred evolutionary relationships among
various biological species
• Based upon similarities and differences in their physical or
genetic characteristics
• Each node with descendants represents the inferred most
recent common ancestor of the descendants
History
• Early representations of "branching"
phylogenetic trees include a "paleontological
chart" showing the geological relationships
among plants and animals in the
book Elementary Geology, by Edward Hitchcock
in 1840.
• Charles Darwin in 1859 also produced one of the
first illustrations and crucially popularized the
notion of an evolutionary "tree" in his seminal
book The Origin of Species.
Why might we care?
The Purposes!
• Understanding human origins
• Understanding biogeography, e.g. what’s the relative importance of dispersal versus
vicariance?
• Learning about the tempo of evolution, e.g. was the Cambrian explosion really an
explosion? Did mammals and birds wait until dinosaurs went extinct to inherit the earth
or were they already started before the asteroid hit?
• Understanding the origin of particular traits
• Understanding the processes of molecular evolution
• Origin of disease, e.g. where did humans get AIDs from?
How Phylogenetic Tree Works?
What does this tree looks like?
What do the lines represent?
Types of Phylogenetic Tree
Rooted Tree:
• Make inferences about the most common
ancestor of the leaves or branches of the
tree.
• Most commonly the root is referred to as an
“outgroup”.
Unrooted Tree:
• Make an illustration about the leaves or
branches,
• but not make assumption regarding a
common ancestor.
The Bifurcating Tree
• A tree that bifurcates has a maximum of 2
descendants arising from each of the interior
nodes.
The Multi-furcating Tree
• A tree that multi-furcates has multiple descendants arising
from each of the interior nodes.
Construction of
Phylogenetic Tree
Construction of Phylogenetic Tree:
Find the tree which best describes the relationships between species.
There are two main types:
1. Character based methods
2. Distance based methods
Character based methods:
Use the aligned characters, such as DNA or protein sequences, directly during tree
inference
Example:
1. Parsimony
2. Maximum likelihood
Taxa Characters
Species A ATGGCTATTCTTATAGTACG
Species B ATCGCTAGTCTTATATTACA
Species C TTCACTAGACCTGTGGTCCA
Species D TTGACCAGACCTGTGGTCCG
Species E TTGACCAGTTCTCTAGTTCG
Distance based methods:
Transform the sequence data into pairwise distances and then use the matrix during
tree building
Example:
1. UPGMA
2. Neighbor-joining
A B C D E
Species A ---- 0.20 0.50 0.45 0.40
Species B 0.23 ---- 0.40 0.55 0.50
Species C 0.87 0.59 ---- 0.15 0.40
Species D 0.73 1.12 0.17 ---- 0.25
Species E 0.59 0.89 0.61 0.31 ----
Construction of Phylogenetic Tree:
UPGMA:
q Abbreviation of “Unweighted Pair Group Method
with Arithmetic Mean”
q Originally developed for numeric taxonomy in
1958 by Sokal and Michener
q Simplest algorithm for tree construction, so it's fast!
Example of
UPGMA
A B C D E
A 0
B 20 0
C 60 50 0
D 100 90 40 0
E 90 80 50 30 0
Example of
UPGMA
A B C D E
A 0
B 20 0
C 60 50 0
D 100 90 40 0
E 90 80 50 30 0
New average
Distance between C and AB is: C to AB = (60 + 50) / 2 = 55
Distance between D and AB is: D to AB = (100 + 90) / 2 = 95
Distance between E and AB is: E to AB = (90 + 80) / 2 = 85
13
Example of
UPGMA
AB C D E
AB 0
C 55 0
D 95 40 0
E 85 50 30 0
Example of
UPGMA
AB C D E
AB 0
C 55 0
D 95 40 0
E 85 50 30 0
New average
Distance between AB and DE is: AB to DE = (95 + 85) / 2 = 90
Distance between C and DE is: C to DE = (40 + 50) / 2 = 45
Example of
UPGMA
AB C DE
AB 0
C 55 0
DE 90 45 0
Example of
UPGMA
AB C DE
AB 0
C 55 0
DE 90 45 0
New Average
Distance between CDE and AB is: CDE to AB = (90 + 55) / 2 =
72.5
Example of
UPGMA
AB CDE
AB 0
CDE 72.5 0
There are only two clusters. so this completes
the
calculation!
Limitations Of Phylogenetic tree
- Limitations
1. Inaccurate evolutionary
history
2. The data used is little noisy
3. Problem facing in single type
of character basing
4. Homoplasy would be unlikely
from natural selection
5. Length of branch doesn’t mean
the timing passed
- Branches of a tree
- Fields of study
1. Cladistics
2. Comparative phylogenetics
3. Computational phylogenetics
4. Evolutionary taxonomy
5. Evolutionary biology
6. Phylogenetics
Applications:
• Find out the evolutionary history .
• Can measure phylogenetic diversity using
phylogenetic trees .
• Search for natural products .
• Infectious bacteria and viruses to trace their
evolutionary histories.
Applications:
• Find out what trends they've undergone in their
history .
• To guide our search for new species.
• Find out how our species spread geographically
in their evolution.
• To tell us when taxa originated and where.
This is what Bio- Informatics
Deals With!
Thanks!

Phylogenetic tree

  • 1.
  • 2.
    Team-NoFrazzle •NazmulAhsan 151-15-4668 •FarhanTawsifChowdhury 151-15-4705 •Md.MahbuburRahman151-15-4761 •Md.SanzidulIslam 151-15-5223 •SadiaSultanaSharmin 151-15-5191
  • 3.
    What is PhylogeneticTree? • A branching diagram • Showing the inferred evolutionary relationships among various biological species • Based upon similarities and differences in their physical or genetic characteristics • Each node with descendants represents the inferred most recent common ancestor of the descendants
  • 4.
    History • Early representationsof "branching" phylogenetic trees include a "paleontological chart" showing the geological relationships among plants and animals in the book Elementary Geology, by Edward Hitchcock in 1840. • Charles Darwin in 1859 also produced one of the first illustrations and crucially popularized the notion of an evolutionary "tree" in his seminal book The Origin of Species.
  • 5.
    Why might wecare? The Purposes! • Understanding human origins • Understanding biogeography, e.g. what’s the relative importance of dispersal versus vicariance? • Learning about the tempo of evolution, e.g. was the Cambrian explosion really an explosion? Did mammals and birds wait until dinosaurs went extinct to inherit the earth or were they already started before the asteroid hit? • Understanding the origin of particular traits • Understanding the processes of molecular evolution • Origin of disease, e.g. where did humans get AIDs from?
  • 6.
  • 7.
    What does thistree looks like? What do the lines represent?
  • 8.
    Types of PhylogeneticTree Rooted Tree: • Make inferences about the most common ancestor of the leaves or branches of the tree. • Most commonly the root is referred to as an “outgroup”. Unrooted Tree: • Make an illustration about the leaves or branches, • but not make assumption regarding a common ancestor.
  • 9.
    The Bifurcating Tree •A tree that bifurcates has a maximum of 2 descendants arising from each of the interior nodes.
  • 10.
    The Multi-furcating Tree •A tree that multi-furcates has multiple descendants arising from each of the interior nodes.
  • 11.
  • 12.
    Construction of PhylogeneticTree: Find the tree which best describes the relationships between species. There are two main types: 1. Character based methods 2. Distance based methods
  • 13.
    Character based methods: Usethe aligned characters, such as DNA or protein sequences, directly during tree inference Example: 1. Parsimony 2. Maximum likelihood Taxa Characters Species A ATGGCTATTCTTATAGTACG Species B ATCGCTAGTCTTATATTACA Species C TTCACTAGACCTGTGGTCCA Species D TTGACCAGACCTGTGGTCCG Species E TTGACCAGTTCTCTAGTTCG
  • 14.
    Distance based methods: Transformthe sequence data into pairwise distances and then use the matrix during tree building Example: 1. UPGMA 2. Neighbor-joining A B C D E Species A ---- 0.20 0.50 0.45 0.40 Species B 0.23 ---- 0.40 0.55 0.50 Species C 0.87 0.59 ---- 0.15 0.40 Species D 0.73 1.12 0.17 ---- 0.25 Species E 0.59 0.89 0.61 0.31 ----
  • 15.
  • 16.
    UPGMA: q Abbreviation of“Unweighted Pair Group Method with Arithmetic Mean” q Originally developed for numeric taxonomy in 1958 by Sokal and Michener q Simplest algorithm for tree construction, so it's fast!
  • 17.
    Example of UPGMA A BC D E A 0 B 20 0 C 60 50 0 D 100 90 40 0 E 90 80 50 30 0
  • 18.
    Example of UPGMA A BC D E A 0 B 20 0 C 60 50 0 D 100 90 40 0 E 90 80 50 30 0 New average Distance between C and AB is: C to AB = (60 + 50) / 2 = 55 Distance between D and AB is: D to AB = (100 + 90) / 2 = 95 Distance between E and AB is: E to AB = (90 + 80) / 2 = 85 13
  • 19.
    Example of UPGMA AB CD E AB 0 C 55 0 D 95 40 0 E 85 50 30 0
  • 20.
    Example of UPGMA AB CD E AB 0 C 55 0 D 95 40 0 E 85 50 30 0 New average Distance between AB and DE is: AB to DE = (95 + 85) / 2 = 90 Distance between C and DE is: C to DE = (40 + 50) / 2 = 45
  • 21.
    Example of UPGMA AB CDE AB 0 C 55 0 DE 90 45 0
  • 22.
    Example of UPGMA AB CDE AB 0 C 55 0 DE 90 45 0 New Average Distance between CDE and AB is: CDE to AB = (90 + 55) / 2 = 72.5
  • 23.
    Example of UPGMA AB CDE AB0 CDE 72.5 0 There are only two clusters. so this completes the calculation!
  • 24.
  • 25.
    - Limitations 1. Inaccurateevolutionary history 2. The data used is little noisy 3. Problem facing in single type of character basing 4. Homoplasy would be unlikely from natural selection 5. Length of branch doesn’t mean the timing passed
  • 26.
  • 27.
    - Fields ofstudy 1. Cladistics 2. Comparative phylogenetics 3. Computational phylogenetics 4. Evolutionary taxonomy 5. Evolutionary biology 6. Phylogenetics
  • 28.
    Applications: • Find outthe evolutionary history . • Can measure phylogenetic diversity using phylogenetic trees . • Search for natural products . • Infectious bacteria and viruses to trace their evolutionary histories.
  • 29.
    Applications: • Find outwhat trends they've undergone in their history . • To guide our search for new species. • Find out how our species spread geographically in their evolution. • To tell us when taxa originated and where.
  • 30.
    This is whatBio- Informatics Deals With! Thanks!