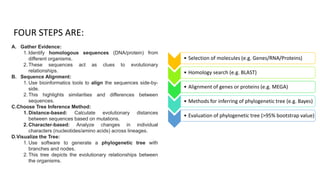
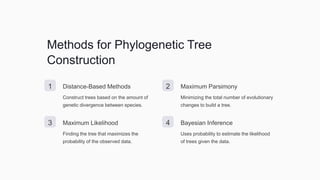
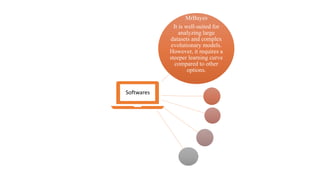
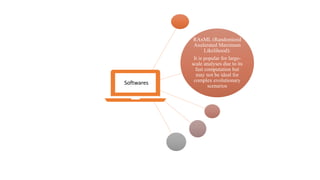
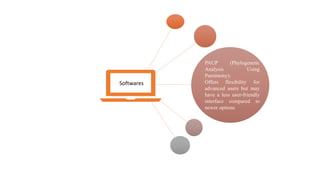
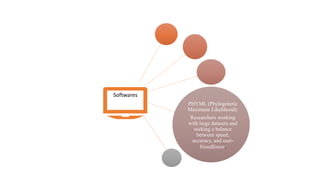
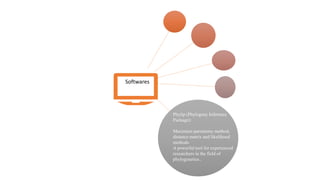
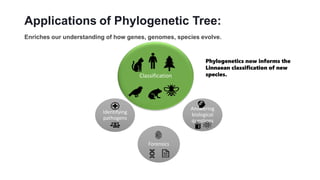
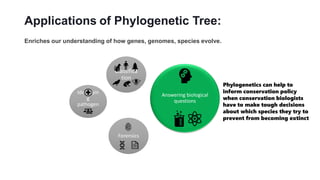
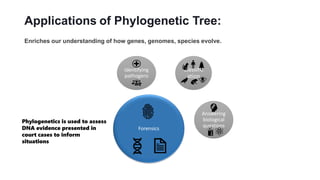
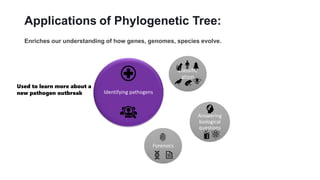
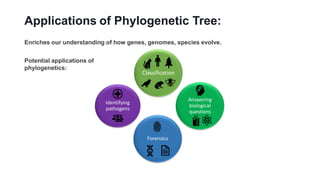
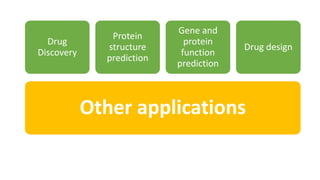
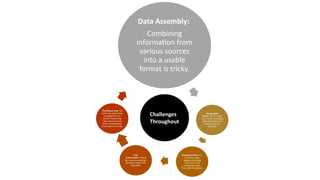
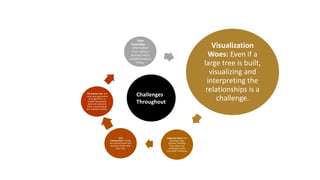
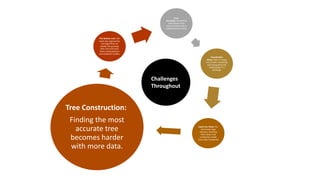
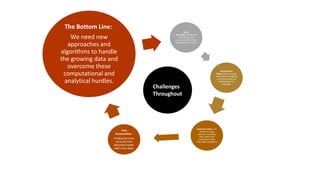
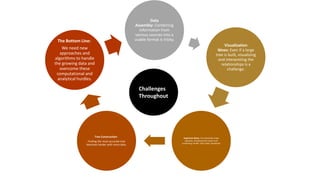
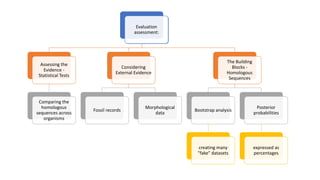
Phylogenetic Tree
Construction
By,
Anushka Singh
Samruddhi Gosavi
Shami Gurav
Tejas Somwanshi
Submitted To : Dr. Nandini Kotharkar
Introduction to
Phylogenetic Tree
Construction
Phylogenetic trees are used to represent the evolutionary relationships
between organisms. Phylogenetic trees, also known as the "Tree of
Life," are like intricate family trees depicting the evolutionary
relationships between organisms. These branching diagrams visualize
how different species arose from a common ancestor through countless
generations. Constructing these trees is no small feat, and it involves a
meticulous four-step process:
A. Gather Evidence:
1. Identify homologous sequences (DNA/protein) from
different organisms.
2. These sequences act as clues to evolutionary
relationships.
B. Sequence Alignment:
1. Use bioinformatics tools to align the sequences side-by-
side.
2. This highlights similarities and differences between
sequences.
C.Choose Tree Inference Method:
1. Distance-based: Calculate evolutionary distances
between sequences based on mutations.
2. Character-based: Analyze changes in individual
characters (nucleotides/amino acids) across lineages.
D.Visualize the Tree:
1. Use software to generate a phylogenetic tree with
branches and nodes.
2. This tree depicts the evolutionary relationships between
the organisms.
FOUR STEPS ARE:
• Selection of molecules (e.g. Genes/RNA/Proteins)
• Homology search (e.g. BLAST)
• Alignment of genes or proteins (e.g. MEGA)
• Methods for inferring of phylogenetic tree (e.g. Bayes)
• Evaluation of phylogenetic tree (>95% bootstrap value)
The Evolution of Taxonomy
Taxonomy, the science of categorizing and
classifying organisms, has evolved significantly over
time. It has been shaped by pivotal moments and
the contributions of great minds, each building
upon the work of their predecessors. Let's explore
the major milestones in the evolution of taxonomy
from the pre- Darwinian era to modern
computational methods.
History of Phylogenetic
Tree Construction.
Charles Darwin's
Contributions
Charles Darwin's work on the
theory of evolution laid the
groundwork for the concept
of evolutionary trees.
Computational
Advancements
The development of
computational methods in
the 20th century
revolutionized the
construction of phylogenetic
trees.
Modern Techniques
Today, advanced molecular
biology tools and DNA
sequencing have enhanced
the accuracy of phylogenetic
tree construction.
Types of Phylogenetic Trees
1 3
2
Cladograms
Chronograms indicate
the timing of
evolutionary events
and can be used to
estimate divergence
times.
Chronograms
Phylograms
Cladograms depict
evolutionary
relationships based on
shared characteristics
among species.
Phylograms show the
amount of evolutionary
change that has taken
place in a particular
lineage
Methods for Phylogenetic Tree
Construction
1 Distance-Based Methods
Construct trees based on the amount of
genetic divergence between species.
2 Maximum Parsimony
Minimizing the total number of evolutionary
changes to build a tree.
3 Maximum Likelihood
Finding the tree that maximizes the
probability of the observed data.
4 Bayesian Inference
Uses probability to estimate the likelihood
of trees given the data.
MrBayes
It is well-suited for
analyzing large
datasets and complex
evolutionary models.
However, it requires a
steeper learning curve
compared to other
options.
Softwares
RAxML (Randomized
Axelerated Maximum
Likelihood):
It is popular for large-
scale analyses due to its
fast computation but
may not be ideal for
complex evolutionary
scenarios
Softwares
Softwares
PAUP (Phylogenetic
Analysis Using
Parsimony):
Offers flexibility for
advanced users but may
have a less user-friendly
interface compared to
newer options
Softwares
PHYML (Phylogenetic
Maximum Likelihood):
Researchers working
with large datasets and
seeking a balance
between speed,
accuracy, and user-
friendliness.
Softwares
Phylip (Phylogeny Inference
Package):
Maximum parsimony method,
distance matrix and likelihood
methods
A powerful tool for experienced
researchers in the field of
phylogenetics..
Applications of Phylogenetic Tree:
Enriches our understanding of how genes, genomes, species evolve.
Classification
Answering
biological
questions
Forensics
Identifying
pathogens
Phylogenetics now informs the
Linnaean classification of new
species.
Applications of Phylogenetic Tree:
Enriches our understanding of how genes, genomes, species evolve.
Classifica
tion
Answering biological
questions
Forensics
Identifyin
g
pathogen
s
Phylogenetics can help to
inform conservation policy
when conservation biologists
have to make tough decisions
about which species they try to
prevent from becoming extinct
Applications of Phylogenetic Tree:
Enriches our understanding of how genes, genomes, species evolve.
Classific
ation
Answering
biological
questions
Forensics
Identifying
pathogens
Phylogenetics is used to assess
DNA evidence presented in
court cases to inform
situations
Applications of Phylogenetic Tree:
Enriches our understanding of how genes, genomes, species evolve.
Classific
ation
Answering
biological
questions
Forensics
Identifying pathogens
Used to learn more about a
new pathogen outbreak
Applications of Phylogenetic Tree:
Enriches our understanding of how genes, genomes, species evolve.
Potential applications of
phylogenetics:
Classification
Answering
biological
questions
Forensics
Identifying
pathogens
Other applications
Drug
Discovery
Protein
structure
prediction
Gene and
protein
function
prediction
Drug design
Data Assembly:
Combining
information from
various sources
into a usable
format is tricky.
Visualization
Woes: Even if a large
tree is built, visualizing
and interpreting the
relationships is a
challenge.
Supertree Woes: For
extremely large
datasets, breaking
them down and
combining smaller
trees adds complexity
Tree
Construction: Finding
the most accurate tree
becomes harder with
more data.
The Bottom Line: We
need new approaches
and algorithms to
handle the growing
data and overcome
these computational
and analytical hurdles.
Challenges
Throughout
Data
Assembly: Combining
information
from various
sources into a
usable format is
tricky.
Visualization
Woes: Even if a
large tree is built,
visualizing and
interpreting the
relationships is a
challenge.
Supertree Woes: For
extremely large
datasets, breaking
them down and
combining smaller
trees adds complexity
Tree
Construction: Finding
the most accurate tree
becomes harder with
more data.
The Bottom Line: We
need new approaches
and algorithms to
handle the growing
data and overcome
these computational
and analytical hurdles.
Challenges
Throughout
Data
Assembly: Combining
information from
various sources into a
usable format is tricky.
Visualization
Woes: Even if a large
tree is built, visualizing
and interpreting the
relationships is a
challenge.
Supertree Woes: For
extremely large
datasets, breaking
them down and
combining smaller
trees adds complexity
Tree
Construction: Finding
the most accurate tree
becomes harder with
more data.
The Bottom Line: We
need new approaches
and algorithms to
handle the growing
data and overcome
these computational
and analytical hurdles.
Challenges
Throughout
Data
Assembly: Combining
information from
various sources into a
usable format is tricky.
Visualization
Woes: Even if a large
tree is built, visualizing
and interpreting the
relationships is a
challenge.
Supertree Woes: For
extremely large
datasets, breaking
them down and
combining smaller
trees adds complexity
Tree Construction:
Finding the most
accurate tree
becomes harder
with more data.
The Bottom Line: We
need new approaches
and algorithms to
handle the growing
data and overcome
these computational
and analytical hurdles.
Challenges
Throughout
Data
Assembly: Combining
information from
various sources into a
usable format is tricky.
Visualization
Woes: Even if a large
tree is built, visualizing
and interpreting the
relationships is a
challenge.
Supertree Woes: For
extremely large
datasets, breaking
them down and
combining smaller
trees adds complexity
Tree
Construction:
Finding the most
accurate tree
becomes harder
with more data.
The Bottom Line:
We need new
approaches and
algorithms to handle
the growing data and
overcome these
computational and
analytical hurdles.
Challenges
Throughout
Data
Assembly: Combining
information from
various sources into a
usable format is tricky.
Visualization
Woes: Even if a large
tree is built, visualizing
and interpreting the
relationships is a
challenge.
Supertree Woes: For extremely large
datasets, breaking them down and
combining smaller trees adds complexity
Tree Construction:
Finding the most accurate tree
becomes harder with more data.
The Bottom Line:
We need new
approaches and
algorithms to handle
the growing data and
overcome these
computational and
analytical hurdles.
Challenges
Throughout
Assessing the
Evidence -
Statistical Tests
Comparing the
homologous
sequences across
organisms
Considering
External Evidence
Fossil records
Morphological
data
The Building
Blocks -
Homologous
Sequences
Bootstrap analysis
creating many
"fake" datasets
Posterior
probabilities
expressed as
percentages
Evaluation
assessment:
Phylogenetic tree construction step by step

Phylogenetic tree construction step by step

  • 1.
    Phylogenetic Tree Construction By, Anushka Singh SamruddhiGosavi Shami Gurav Tejas Somwanshi Submitted To : Dr. Nandini Kotharkar
  • 2.
    Introduction to Phylogenetic Tree Construction Phylogenetictrees are used to represent the evolutionary relationships between organisms. Phylogenetic trees, also known as the "Tree of Life," are like intricate family trees depicting the evolutionary relationships between organisms. These branching diagrams visualize how different species arose from a common ancestor through countless generations. Constructing these trees is no small feat, and it involves a meticulous four-step process:
  • 3.
    A. Gather Evidence: 1.Identify homologous sequences (DNA/protein) from different organisms. 2. These sequences act as clues to evolutionary relationships. B. Sequence Alignment: 1. Use bioinformatics tools to align the sequences side-by- side. 2. This highlights similarities and differences between sequences. C.Choose Tree Inference Method: 1. Distance-based: Calculate evolutionary distances between sequences based on mutations. 2. Character-based: Analyze changes in individual characters (nucleotides/amino acids) across lineages. D.Visualize the Tree: 1. Use software to generate a phylogenetic tree with branches and nodes. 2. This tree depicts the evolutionary relationships between the organisms. FOUR STEPS ARE: • Selection of molecules (e.g. Genes/RNA/Proteins) • Homology search (e.g. BLAST) • Alignment of genes or proteins (e.g. MEGA) • Methods for inferring of phylogenetic tree (e.g. Bayes) • Evaluation of phylogenetic tree (>95% bootstrap value)
  • 4.
    The Evolution ofTaxonomy Taxonomy, the science of categorizing and classifying organisms, has evolved significantly over time. It has been shaped by pivotal moments and the contributions of great minds, each building upon the work of their predecessors. Let's explore the major milestones in the evolution of taxonomy from the pre- Darwinian era to modern computational methods.
  • 5.
    History of Phylogenetic TreeConstruction. Charles Darwin's Contributions Charles Darwin's work on the theory of evolution laid the groundwork for the concept of evolutionary trees. Computational Advancements The development of computational methods in the 20th century revolutionized the construction of phylogenetic trees. Modern Techniques Today, advanced molecular biology tools and DNA sequencing have enhanced the accuracy of phylogenetic tree construction.
  • 6.
    Types of PhylogeneticTrees 1 3 2 Cladograms Chronograms indicate the timing of evolutionary events and can be used to estimate divergence times. Chronograms Phylograms Cladograms depict evolutionary relationships based on shared characteristics among species. Phylograms show the amount of evolutionary change that has taken place in a particular lineage
  • 7.
    Methods for PhylogeneticTree Construction 1 Distance-Based Methods Construct trees based on the amount of genetic divergence between species. 2 Maximum Parsimony Minimizing the total number of evolutionary changes to build a tree. 3 Maximum Likelihood Finding the tree that maximizes the probability of the observed data. 4 Bayesian Inference Uses probability to estimate the likelihood of trees given the data.
  • 8.
    MrBayes It is well-suitedfor analyzing large datasets and complex evolutionary models. However, it requires a steeper learning curve compared to other options. Softwares
  • 9.
    RAxML (Randomized Axelerated Maximum Likelihood): Itis popular for large- scale analyses due to its fast computation but may not be ideal for complex evolutionary scenarios Softwares
  • 10.
    Softwares PAUP (Phylogenetic Analysis Using Parsimony): Offersflexibility for advanced users but may have a less user-friendly interface compared to newer options
  • 11.
    Softwares PHYML (Phylogenetic Maximum Likelihood): Researchersworking with large datasets and seeking a balance between speed, accuracy, and user- friendliness.
  • 12.
    Softwares Phylip (Phylogeny Inference Package): Maximumparsimony method, distance matrix and likelihood methods A powerful tool for experienced researchers in the field of phylogenetics..
  • 13.
    Applications of PhylogeneticTree: Enriches our understanding of how genes, genomes, species evolve. Classification Answering biological questions Forensics Identifying pathogens Phylogenetics now informs the Linnaean classification of new species.
  • 14.
    Applications of PhylogeneticTree: Enriches our understanding of how genes, genomes, species evolve. Classifica tion Answering biological questions Forensics Identifyin g pathogen s Phylogenetics can help to inform conservation policy when conservation biologists have to make tough decisions about which species they try to prevent from becoming extinct
  • 15.
    Applications of PhylogeneticTree: Enriches our understanding of how genes, genomes, species evolve. Classific ation Answering biological questions Forensics Identifying pathogens Phylogenetics is used to assess DNA evidence presented in court cases to inform situations
  • 16.
    Applications of PhylogeneticTree: Enriches our understanding of how genes, genomes, species evolve. Classific ation Answering biological questions Forensics Identifying pathogens Used to learn more about a new pathogen outbreak
  • 17.
    Applications of PhylogeneticTree: Enriches our understanding of how genes, genomes, species evolve. Potential applications of phylogenetics: Classification Answering biological questions Forensics Identifying pathogens
  • 18.
  • 19.
    Data Assembly: Combining information from varioussources into a usable format is tricky. Visualization Woes: Even if a large tree is built, visualizing and interpreting the relationships is a challenge. Supertree Woes: For extremely large datasets, breaking them down and combining smaller trees adds complexity Tree Construction: Finding the most accurate tree becomes harder with more data. The Bottom Line: We need new approaches and algorithms to handle the growing data and overcome these computational and analytical hurdles. Challenges Throughout
  • 20.
    Data Assembly: Combining information from various sourcesinto a usable format is tricky. Visualization Woes: Even if a large tree is built, visualizing and interpreting the relationships is a challenge. Supertree Woes: For extremely large datasets, breaking them down and combining smaller trees adds complexity Tree Construction: Finding the most accurate tree becomes harder with more data. The Bottom Line: We need new approaches and algorithms to handle the growing data and overcome these computational and analytical hurdles. Challenges Throughout
  • 21.
    Data Assembly: Combining information from varioussources into a usable format is tricky. Visualization Woes: Even if a large tree is built, visualizing and interpreting the relationships is a challenge. Supertree Woes: For extremely large datasets, breaking them down and combining smaller trees adds complexity Tree Construction: Finding the most accurate tree becomes harder with more data. The Bottom Line: We need new approaches and algorithms to handle the growing data and overcome these computational and analytical hurdles. Challenges Throughout
  • 22.
    Data Assembly: Combining information from varioussources into a usable format is tricky. Visualization Woes: Even if a large tree is built, visualizing and interpreting the relationships is a challenge. Supertree Woes: For extremely large datasets, breaking them down and combining smaller trees adds complexity Tree Construction: Finding the most accurate tree becomes harder with more data. The Bottom Line: We need new approaches and algorithms to handle the growing data and overcome these computational and analytical hurdles. Challenges Throughout
  • 23.
    Data Assembly: Combining information from varioussources into a usable format is tricky. Visualization Woes: Even if a large tree is built, visualizing and interpreting the relationships is a challenge. Supertree Woes: For extremely large datasets, breaking them down and combining smaller trees adds complexity Tree Construction: Finding the most accurate tree becomes harder with more data. The Bottom Line: We need new approaches and algorithms to handle the growing data and overcome these computational and analytical hurdles. Challenges Throughout
  • 24.
    Data Assembly: Combining information from varioussources into a usable format is tricky. Visualization Woes: Even if a large tree is built, visualizing and interpreting the relationships is a challenge. Supertree Woes: For extremely large datasets, breaking them down and combining smaller trees adds complexity Tree Construction: Finding the most accurate tree becomes harder with more data. The Bottom Line: We need new approaches and algorithms to handle the growing data and overcome these computational and analytical hurdles. Challenges Throughout
  • 25.
    Assessing the Evidence - StatisticalTests Comparing the homologous sequences across organisms Considering External Evidence Fossil records Morphological data The Building Blocks - Homologous Sequences Bootstrap analysis creating many "fake" datasets Posterior probabilities expressed as percentages Evaluation assessment: