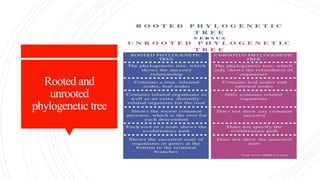
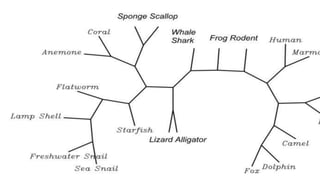
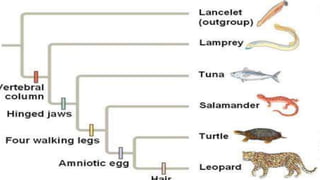
Phylogenetic tree
Nizad sultana ch
Deparment of Zoology
Phylogenetic
tree
A phylogenetic tree or evolutionary tree is a
branching diagram or "tree" showing
the evolutionary relationships among various
biological species or other entities—their phylogeny based
upon similarities and differences in their physical or genetic
characteristics. All life on Earth is part of a single
phylogenetic tree, indicating common ancestry.
History
 Early representations of "branching" phylogenetic
trees include a "paleontological chart" showing the
geological relationships among plants and animals
in the book Elementary Geology, by Edward
Hitchcock
 also produced one of the first illustrations and
crucially popularized the notion of an evolutionary
"tree" in his seminal book The Origin of Species.
Over a century later, evolutionary biologists still
use tree diagrams to depict evolution because such
diagrams effectively convey the concept
that speciation occurs through the adaptive and
semirandom splitting of lineages. Over time, species
classification has become less static and more
dynamic.
Rooted and
unrooted
phylogenetic tree
Properties of
phylogenetic
tree
 A rooted phylogenetic tree (see two graphics at top) is
a directed tree with a unique node — the root —
corresponding to the (usually imputed) most recent
common ancestor of all the entities at the leaves of the
tree. The root node does not have a parent node, but
serves as the parent of all other nodes in the tree. The
root is therefore a node of degree 2 while other internal
nodes have a minimum degree of 3 (where "degree" here
refers to the total number of incoming and outgoing
edges).
Unrooted tree
 Unrooted trees illustrate the relatedness of the leaf nodes
without making assumptions about ancestry. They do not
require the ancestral root to be known or inferred.Unrooted
trees can always be generated from rooted ones by simply
omitting the root. By contrast, inferring the root of an unrooted
tree requires some means of identifying ancestry. This is
normally done by including an outgroup in the input data so
that the root is necessarily between the outgroup and the rest of
the taxa in the tree, or by introducing additional assumptions
about the relative rates of evolution on each branch, such as an
application of the molecular clock hypothesis
Bifurcating
versus
multifurcating
 Bifurcating versus multifurcating
Both rooted and unrooted trees can be either bifurcating or
multifurcating.
 A rooted bifurcating tree has exactly two descendants
arising from each interior node (that is, it forms a binary
tree),
 An unrooted bifurcating tree takes the form of
an unrooted binary tree, a free tree with exactly three
neighbors at each internal node.
 In contrast, a rooted multifurcating tree may have more
than two children at some nodes and
 Unrooted multifurcating tree may have more than three
neighbors at some nodes.
Label versus
unlabeled
 Labeled versus unlabeled
 Both rooted and unrooted trees can be either labeled or
unlabeled.
 A labeled tree has specific values assigned to its leaves,
while
 An unlabeled tree, sometimes called a tree shape,
defines a topology only. Some sequence-based trees built
from a small genomic locus, such as Phylotree feature
internal nodes labeled with inferred ancestral haplotypes.
Special types of
tree
 Dendrogram
 A dendrogram is a general name for a tree, whether
phylogenetic or not, and hence also for the
diagrammatic representation of a phylogenetic tree.
 Cladogram
 A cladogram only represents a branching pattern;
i.e., its branch lengths do not represent time or
relative amount of character change, and its internal
nodes do not represent ancestors.
 Phylogram
 A phylogram is a phylogenetic tree that has branch
lengths proportional to the amount of character
change.
 Chronogram
 A chronogram is a phylogenetic tree that explicitly
represents time through its branch lengths.
 Dahlgrenogram
 A Dahlgrenogram is a diagram representing a cross
section of a phylogenetic tree.
Spindle diagram
 A spindle diagram, or bubble diagram, is often called a
romerogram, after its popularisation by the American
palaeontologist Alfred Romer.
 It represents taxonomic diversity (horizontal width)
against geological time (vertical axis) in order to reflect
the variation of abundance of various taxa through time.
 However, a spindle diagram is not an evolutionary
tree the taxonomic spindles obscure the actual
relationships of the parent taxon to the daughter
taxon[16] and have the disadvantage of involving
the paraphyly of the parental group. This type of diagram
is no longer used in the form originally proposed.
How to construct
phylogenetic tree
 Phylogenetic trees composed with a
nontrivial number of input sequences are
constructed using computational
phylogenetics methods.
 Distance-matrix methods such as neighbor-
joining or UPGMA, which calculate genetic
distance from multiple sequence
alignments, are simplest to implement, but
do not invoke an evolutionary model.
 Many sequence alignment methods such
as ClustalW also create trees by using the
simpler algorithms (i.e. those based on
distance) of tree construction.
 Maximum parsimony is another simple
method of estimating phylogenetic trees,
but implies an implicit model of evolution
(i.e. parsimony).
Advanced
methods
 More advanced methods use the optimality
criterion of maximum likelihood, often within a Bayesian
framework, and apply an explicit model of evolution to
phylogenetic tree estimation.
 Identifying the optimal tree using many of these
techniques is NP-hard,so heuristic search
and optimization methods are used in combination with
tree-scoring functions to identify a reasonably good tree
that fits the data.
Criteria for tree
construction
 Tree-building methods can be assessed on the basis
of several criteria:
 efficiency (how long does it take to compute the
answer, how much memory does it need?)
 power (does it make good use of the data, or is
information being wasted?)
 consistency (will it converge on the same answer
repeatedly, if each time given different data for the
same model problem?)
 robustness (does it cope well with violations of the
assumptions of the underlying model?)
 falsifiability (does it alert us when it is not good to
use, i.e. when assumptions are violated?)
Limitations of
phylogenetic
tree
 Although phylogenetic trees produced on the basis of
sequenced genes or genomic data in different species can
provide evolutionary insight, these analyses have
important limitations.
 Most importantly, the trees that they generate are not
necessarily correct – they do not necessarily accurately
represent the evolutionary history of the included taxa.
As with any scientific result, they are subject
to falsification by further study (e.g., gathering of
additional data, analyzing the existing data with
improved methods).
 The data on which they are based may be noisy;the
analysis can be confounded by genetic
recombination,horizontal gene
transfer,hybridisation between species that were not
nearest neighbors on the tree before hybridisation takes
place, convergent evolution, and conserved sequences.
 Also, there are problems in basing an analysis on a single
type of character, such as a single gene or protein or only on
morphological analysis, because such trees constructed from
another unrelated data source often differ from the first, and
therefore great care is needed in inferring phylogenetic
relationships among species. This is most true of genetic
material that is subject to lateral gene transfer
and recombination, where different haplotype blocks can
have different histories. In these types of analysis, the output
tree of a phylogenetic analysis of a single gene is an
estimate of the gene's phylogeny (i.e. a gene tree) and not
the phylogeny of the taxa (i.e. species tree) from which these
characters were sampled, though ideally, both should be very
close. For this reason, serious phylogenetic studies generally
use a combination of genes that come from different
genomic sources (e.g., from mitochondrial or plastid vs.
nuclear genomes), or genes that would be expected to
evolve under different selective regimes, so
that homoplasy (false homology) would be unlikely to result
from natural selection.
 When extinct species are included as terminal nodes in an
When extinct species are included as terminal nodes in an
analysis (rather than, for example, to constrain internal
nodes), they are considered not to represent direct
ancestors of any extant species. Extinct species do not
typically contain high-quality DNA. (rather than, for
example, to constrain internal nodes), they are considered
not to represent direct ancestors of any extant species.
Extinct species do not typically contain high-
quality DNA.
 Phylogenetic trees can also be inferred from a range of
other data types, including morphology, the presence or
absence of particular types of genes, insertion and
deletion events – and any other observation thought to
contain an evolutionary signal.
Thanks
You all

Phylogenetic tree and it's types

  • 1.
    Phylogenetic tree Nizad sultanach Deparment of Zoology
  • 2.
    Phylogenetic tree A phylogenetic treeor evolutionary tree is a branching diagram or "tree" showing the evolutionary relationships among various biological species or other entities—their phylogeny based upon similarities and differences in their physical or genetic characteristics. All life on Earth is part of a single phylogenetic tree, indicating common ancestry.
  • 3.
    History  Early representationsof "branching" phylogenetic trees include a "paleontological chart" showing the geological relationships among plants and animals in the book Elementary Geology, by Edward Hitchcock  also produced one of the first illustrations and crucially popularized the notion of an evolutionary "tree" in his seminal book The Origin of Species. Over a century later, evolutionary biologists still use tree diagrams to depict evolution because such diagrams effectively convey the concept that speciation occurs through the adaptive and semirandom splitting of lineages. Over time, species classification has become less static and more dynamic.
  • 4.
  • 5.
    Properties of phylogenetic tree  Arooted phylogenetic tree (see two graphics at top) is a directed tree with a unique node — the root — corresponding to the (usually imputed) most recent common ancestor of all the entities at the leaves of the tree. The root node does not have a parent node, but serves as the parent of all other nodes in the tree. The root is therefore a node of degree 2 while other internal nodes have a minimum degree of 3 (where "degree" here refers to the total number of incoming and outgoing edges).
  • 7.
    Unrooted tree  Unrootedtrees illustrate the relatedness of the leaf nodes without making assumptions about ancestry. They do not require the ancestral root to be known or inferred.Unrooted trees can always be generated from rooted ones by simply omitting the root. By contrast, inferring the root of an unrooted tree requires some means of identifying ancestry. This is normally done by including an outgroup in the input data so that the root is necessarily between the outgroup and the rest of the taxa in the tree, or by introducing additional assumptions about the relative rates of evolution on each branch, such as an application of the molecular clock hypothesis
  • 9.
    Bifurcating versus multifurcating  Bifurcating versusmultifurcating Both rooted and unrooted trees can be either bifurcating or multifurcating.  A rooted bifurcating tree has exactly two descendants arising from each interior node (that is, it forms a binary tree),  An unrooted bifurcating tree takes the form of an unrooted binary tree, a free tree with exactly three neighbors at each internal node.  In contrast, a rooted multifurcating tree may have more than two children at some nodes and  Unrooted multifurcating tree may have more than three neighbors at some nodes.
  • 10.
    Label versus unlabeled  Labeledversus unlabeled  Both rooted and unrooted trees can be either labeled or unlabeled.  A labeled tree has specific values assigned to its leaves, while  An unlabeled tree, sometimes called a tree shape, defines a topology only. Some sequence-based trees built from a small genomic locus, such as Phylotree feature internal nodes labeled with inferred ancestral haplotypes.
  • 11.
    Special types of tree Dendrogram  A dendrogram is a general name for a tree, whether phylogenetic or not, and hence also for the diagrammatic representation of a phylogenetic tree.  Cladogram  A cladogram only represents a branching pattern; i.e., its branch lengths do not represent time or relative amount of character change, and its internal nodes do not represent ancestors.  Phylogram  A phylogram is a phylogenetic tree that has branch lengths proportional to the amount of character change.
  • 14.
     Chronogram  Achronogram is a phylogenetic tree that explicitly represents time through its branch lengths.  Dahlgrenogram  A Dahlgrenogram is a diagram representing a cross section of a phylogenetic tree.
  • 15.
    Spindle diagram  Aspindle diagram, or bubble diagram, is often called a romerogram, after its popularisation by the American palaeontologist Alfred Romer.  It represents taxonomic diversity (horizontal width) against geological time (vertical axis) in order to reflect the variation of abundance of various taxa through time.  However, a spindle diagram is not an evolutionary tree the taxonomic spindles obscure the actual relationships of the parent taxon to the daughter taxon[16] and have the disadvantage of involving the paraphyly of the parental group. This type of diagram is no longer used in the form originally proposed.
  • 16.
    How to construct phylogenetictree  Phylogenetic trees composed with a nontrivial number of input sequences are constructed using computational phylogenetics methods.  Distance-matrix methods such as neighbor- joining or UPGMA, which calculate genetic distance from multiple sequence alignments, are simplest to implement, but do not invoke an evolutionary model.  Many sequence alignment methods such as ClustalW also create trees by using the simpler algorithms (i.e. those based on distance) of tree construction.  Maximum parsimony is another simple method of estimating phylogenetic trees, but implies an implicit model of evolution (i.e. parsimony).
  • 17.
    Advanced methods  More advancedmethods use the optimality criterion of maximum likelihood, often within a Bayesian framework, and apply an explicit model of evolution to phylogenetic tree estimation.  Identifying the optimal tree using many of these techniques is NP-hard,so heuristic search and optimization methods are used in combination with tree-scoring functions to identify a reasonably good tree that fits the data.
  • 18.
    Criteria for tree construction Tree-building methods can be assessed on the basis of several criteria:  efficiency (how long does it take to compute the answer, how much memory does it need?)  power (does it make good use of the data, or is information being wasted?)  consistency (will it converge on the same answer repeatedly, if each time given different data for the same model problem?)  robustness (does it cope well with violations of the assumptions of the underlying model?)  falsifiability (does it alert us when it is not good to use, i.e. when assumptions are violated?)
  • 19.
    Limitations of phylogenetic tree  Althoughphylogenetic trees produced on the basis of sequenced genes or genomic data in different species can provide evolutionary insight, these analyses have important limitations.  Most importantly, the trees that they generate are not necessarily correct – they do not necessarily accurately represent the evolutionary history of the included taxa. As with any scientific result, they are subject to falsification by further study (e.g., gathering of additional data, analyzing the existing data with improved methods).
  • 20.
     The dataon which they are based may be noisy;the analysis can be confounded by genetic recombination,horizontal gene transfer,hybridisation between species that were not nearest neighbors on the tree before hybridisation takes place, convergent evolution, and conserved sequences.
  • 21.
     Also, thereare problems in basing an analysis on a single type of character, such as a single gene or protein or only on morphological analysis, because such trees constructed from another unrelated data source often differ from the first, and therefore great care is needed in inferring phylogenetic relationships among species. This is most true of genetic material that is subject to lateral gene transfer and recombination, where different haplotype blocks can have different histories. In these types of analysis, the output tree of a phylogenetic analysis of a single gene is an estimate of the gene's phylogeny (i.e. a gene tree) and not the phylogeny of the taxa (i.e. species tree) from which these characters were sampled, though ideally, both should be very close. For this reason, serious phylogenetic studies generally use a combination of genes that come from different genomic sources (e.g., from mitochondrial or plastid vs. nuclear genomes), or genes that would be expected to evolve under different selective regimes, so that homoplasy (false homology) would be unlikely to result from natural selection.
  • 22.
     When extinctspecies are included as terminal nodes in an When extinct species are included as terminal nodes in an analysis (rather than, for example, to constrain internal nodes), they are considered not to represent direct ancestors of any extant species. Extinct species do not typically contain high-quality DNA. (rather than, for example, to constrain internal nodes), they are considered not to represent direct ancestors of any extant species. Extinct species do not typically contain high- quality DNA.
  • 23.
     Phylogenetic treescan also be inferred from a range of other data types, including morphology, the presence or absence of particular types of genes, insertion and deletion events – and any other observation thought to contain an evolutionary signal.
  • 24.