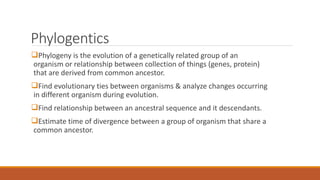
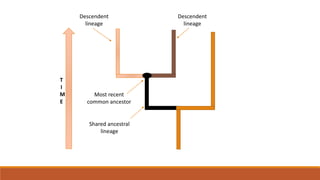
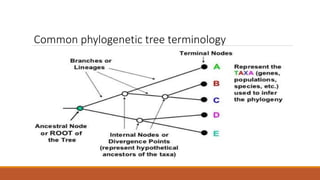
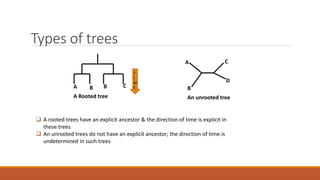
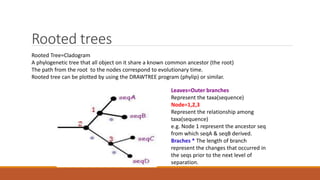
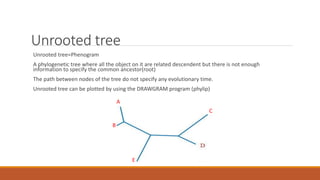
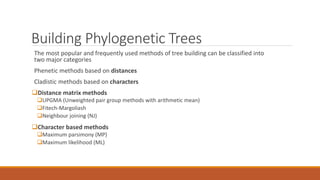
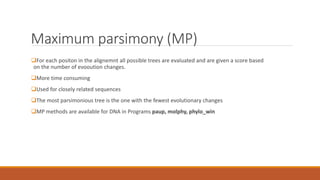
Phylogenetic Tree Evolution
Md Omama jawaid
PG Diploma in computational Biology
Amity University Lucknow
Omama.jawaid@gmail.com
Phylogentics
Phylogeny is the evolution of a genetically related group of an
organism or relationship between collection of things (genes, protein)
that are derived from common ancestor.
Find evolutionary ties between organisms & analyze changes occurring
in different organism during evolution.
Find relationship between an ancestral sequence and it descendants.
Estimate time of divergence between a group of organism that share a
common ancestor.
Phylogenetic tree
A phylogenetic tree is a model about the evolutionary relationship between operational
taxonomic units(OTUs) based on homologous character.
Dandrogram: general term for a branching diagram
Cladogram: branching diagram without branch length estimates
Phylogram or phylogenetic tree: branching diagram with branch length estimates
A tree is composed of nodes and branches & one bracnch connects any two adjacent nodes.
Nodes represent the taxonomic units.
E.G. Two very similar sequence will be neighbours on the outer branches and will be connected
by a common internal branch.
Most recent
common ancestor
Shared ancestral
lineage
Descendent
lineage
Descendent
lineage
T
I
M
E
Common phylogenetic tree terminology
Types of trees
A B B C
A C
B
D
T
I
M
E
A Rooted tree An unrooted tree
 A rooted trees have an explicit ancestor & the direction of time is explicit in
these trees
 An unrooted trees do not have an explicit ancestor; the direction of time is
undetermined in such trees
Rooted trees
Leaves=Outer branches
Represent the taxa(sequence)
Node=1,2,3
Represent the relationship among
taxa(sequence)
e.g. Node 1 represent the ancestor seq
from which seqA & seqB derived.
Braches * The length of branch
represent the changes that occurred in
the seqs prior to the next level of
separation.
Rooted Tree=Cladogram
A phylogenetic tree that all object on it share a known common ancestor (the root)
The path from the root to the nodes correspond to evolutionary time.
Rooted tree can be plotted by using the DRAWTREE program (phylip) or similar.
Unrooted tree
Unrooted tree=Phenogram
A phylogenetic tree where all the object on it are related descendent but there is not enough
information to specify the common ancestor(root)
The path between nodes of the tree do not specify any evolutionary time.
Unrooted tree can be plotted by using the DRAWGRAM program (phylip)
E
B
A
C
Software
Some programs for phylogenetic analysis
A multiple alignment program:
Clustal, T-Coffee, MAFFT, Muscle…
A phylogenetic program:
Phylip, PAUP*, MacClade, BioEdit…
Visualizing the tree:
TreeView, Njplot
https://evolution.genetics.washington.edu/phylip/software.html
Selecting sequence
The rate of mutation is assumed to be the same in both
coding and non-coding region
However there is a difference in substitution rate
Non-coding DNA region have more substituion than coding
regions.
Protien are much more conserved since they need to
conseve their function
It is better to use sequence that mutate slowly (protein)
than DNA. If the gene are very small or they mutate slowly,
then it cam use for building tree.
Building Phylogenetic Trees
The most popular and frequently used methods of tree building can be classified into
two major categories
Phenetic methods based on distances
Cladistic methods based on characters
Distance matrix methods
UPGMA (Unweighted pair group methods with arithmetic mean)
Fitech-Margoliash
Neighbour joining (NJ)
Character based methods
Maximum parsimony (MP)
Maximum likelihood (ML)
Distance based methods
Tree are calculated by similiarities of sequences and are based on distance
Some sequences more similar than others
Closely related sequences should be close in the tree
Only use the distances between sequences
All methods start with a distance matrix
UPGMA Vs Fitch Margoliash Method
UPGMA Methods
Unweighted Pair Group Method with Arithmetic Mean
Unweighted: The distances are used as they are
Pair: Find the two closest elements
Group: Put them together in a new group
Arithmetic Mean: Gives distances from the new group
Fitch-Margoliash Methods
More complicated than UPGMA
Does not assume a molecular clock
Produces an unrooted scaled tree
Neighbour joining
This methods tries to correct the UPGMA method for its assumption that the rate of evolutions
is the same in all taxa.
But it assumes an additive tree
◦ Distance between two leaves is the sum of the edges
Find the closest pair that is most apart from the rest of the tree
Connect pair and update distances
◦ A little advanced: Take the overall distance to the rest of the tree into account
◦ Corrects for varying mutation
Fast and can give good results
Character methods
Tree are calculated by considering the various possible pathways of evolution.
This methods uses each alignment positions as evolutionary information to build a tree.
All information at hand
More advanced, slower, but also more accurate
Maximum Parsimony (MP)
◦ Occam’s razor: Simplest explanation
Maximum Likelihood (ML)
◦ Advanced statistical method
◦ Most probable tree given the data and the model
Maximum parsimony (MP)
For each positon in the alignemnt all possible trees are evaluated and are given a score based
on the number of evooution changes.
More time consuming
Used for closely related sequences
The most parsimonious tree is the one with the fewest evolutionary changes
MP methods are available for DNA in Programs paup, molphy, phylo_win
Maximum Likelihood
This methods also uses each position in an alignment, evaluate all possible trees and calcultes
the likelihood for each tree.
The tree with the maximum likelihood is the most probable tree.
Slowest methods but gives the best result
Used for any set of sequence.
Maximum likelikhood methods can found in phylip, paup or puzzle
Thank you

Phylogenetic Tree evolution

  • 1.
    Phylogenetic Tree Evolution MdOmama jawaid PG Diploma in computational Biology Amity University Lucknow Omama.jawaid@gmail.com
  • 2.
    Phylogentics Phylogeny is theevolution of a genetically related group of an organism or relationship between collection of things (genes, protein) that are derived from common ancestor. Find evolutionary ties between organisms & analyze changes occurring in different organism during evolution. Find relationship between an ancestral sequence and it descendants. Estimate time of divergence between a group of organism that share a common ancestor.
  • 3.
    Phylogenetic tree A phylogenetictree is a model about the evolutionary relationship between operational taxonomic units(OTUs) based on homologous character. Dandrogram: general term for a branching diagram Cladogram: branching diagram without branch length estimates Phylogram or phylogenetic tree: branching diagram with branch length estimates A tree is composed of nodes and branches & one bracnch connects any two adjacent nodes. Nodes represent the taxonomic units. E.G. Two very similar sequence will be neighbours on the outer branches and will be connected by a common internal branch.
  • 4.
    Most recent common ancestor Sharedancestral lineage Descendent lineage Descendent lineage T I M E
  • 5.
  • 6.
    Types of trees AB B C A C B D T I M E A Rooted tree An unrooted tree  A rooted trees have an explicit ancestor & the direction of time is explicit in these trees  An unrooted trees do not have an explicit ancestor; the direction of time is undetermined in such trees
  • 7.
    Rooted trees Leaves=Outer branches Representthe taxa(sequence) Node=1,2,3 Represent the relationship among taxa(sequence) e.g. Node 1 represent the ancestor seq from which seqA & seqB derived. Braches * The length of branch represent the changes that occurred in the seqs prior to the next level of separation. Rooted Tree=Cladogram A phylogenetic tree that all object on it share a known common ancestor (the root) The path from the root to the nodes correspond to evolutionary time. Rooted tree can be plotted by using the DRAWTREE program (phylip) or similar.
  • 8.
    Unrooted tree Unrooted tree=Phenogram Aphylogenetic tree where all the object on it are related descendent but there is not enough information to specify the common ancestor(root) The path between nodes of the tree do not specify any evolutionary time. Unrooted tree can be plotted by using the DRAWGRAM program (phylip) E B A C
  • 9.
    Software Some programs forphylogenetic analysis A multiple alignment program: Clustal, T-Coffee, MAFFT, Muscle… A phylogenetic program: Phylip, PAUP*, MacClade, BioEdit… Visualizing the tree: TreeView, Njplot https://evolution.genetics.washington.edu/phylip/software.html
  • 10.
    Selecting sequence The rateof mutation is assumed to be the same in both coding and non-coding region However there is a difference in substitution rate Non-coding DNA region have more substituion than coding regions. Protien are much more conserved since they need to conseve their function It is better to use sequence that mutate slowly (protein) than DNA. If the gene are very small or they mutate slowly, then it cam use for building tree.
  • 11.
    Building Phylogenetic Trees Themost popular and frequently used methods of tree building can be classified into two major categories Phenetic methods based on distances Cladistic methods based on characters Distance matrix methods UPGMA (Unweighted pair group methods with arithmetic mean) Fitech-Margoliash Neighbour joining (NJ) Character based methods Maximum parsimony (MP) Maximum likelihood (ML)
  • 12.
    Distance based methods Treeare calculated by similiarities of sequences and are based on distance Some sequences more similar than others Closely related sequences should be close in the tree Only use the distances between sequences All methods start with a distance matrix
  • 13.
    UPGMA Vs FitchMargoliash Method UPGMA Methods Unweighted Pair Group Method with Arithmetic Mean Unweighted: The distances are used as they are Pair: Find the two closest elements Group: Put them together in a new group Arithmetic Mean: Gives distances from the new group Fitch-Margoliash Methods More complicated than UPGMA Does not assume a molecular clock Produces an unrooted scaled tree
  • 14.
    Neighbour joining This methodstries to correct the UPGMA method for its assumption that the rate of evolutions is the same in all taxa. But it assumes an additive tree ◦ Distance between two leaves is the sum of the edges Find the closest pair that is most apart from the rest of the tree Connect pair and update distances ◦ A little advanced: Take the overall distance to the rest of the tree into account ◦ Corrects for varying mutation Fast and can give good results
  • 15.
    Character methods Tree arecalculated by considering the various possible pathways of evolution. This methods uses each alignment positions as evolutionary information to build a tree. All information at hand More advanced, slower, but also more accurate Maximum Parsimony (MP) ◦ Occam’s razor: Simplest explanation Maximum Likelihood (ML) ◦ Advanced statistical method ◦ Most probable tree given the data and the model
  • 16.
    Maximum parsimony (MP) Foreach positon in the alignemnt all possible trees are evaluated and are given a score based on the number of evooution changes. More time consuming Used for closely related sequences The most parsimonious tree is the one with the fewest evolutionary changes MP methods are available for DNA in Programs paup, molphy, phylo_win
  • 17.
    Maximum Likelihood This methodsalso uses each position in an alignment, evaluate all possible trees and calcultes the likelihood for each tree. The tree with the maximum likelihood is the most probable tree. Slowest methods but gives the best result Used for any set of sequence. Maximum likelikhood methods can found in phylip, paup or puzzle
  • 18.