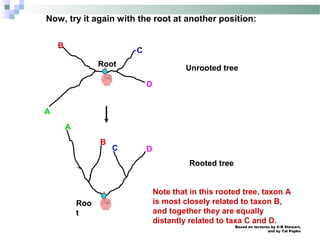
Phylogenetic
analyses
The aim:
To construct a visual representation (a
tree) to describe the assumed evolution
occurring between and among different
groups (individuals, populations, species,
etc.) and to study the reliability of the
consensus tree.
Based on lectures by C-B Stewart,
and by Tal Pupko
What is phylogenetic analysis and why
should we perform it?
Phylogenetic analysis has two major components:
1. Phylogeny inference or “tree building” —
the inference of the branching orders, and
ultimately the evolutionary relationships,
between “taxa” (entities such as genes,
populations, species, etc.)
2. Character and rate analysis —
using phylogenies as analytical frameworks
for rigorous understanding of the evolution of
various traits or conditions of interest
Based on lectures by C-B Stewart,
and by Tal Pupko
Ancestral Node
or ROOT of
the Tree
Internal Nodes or
Divergence Points
(represent hypothetical
ancestors of the taxa)
Branches or
Lineages
Terminal Nodes
A
B
C
D
E
Represent the
TAXA (genes,
populations,
species, etc.)
used to infer
the phylogeny
Common Phylogenetic Tree Terminology
Phylogenetic trees diagram the evolutionary
relationships between the taxa
((A,(B,C)),(D,E)) = The above phylogeny as nested parentheses
Taxon A
Taxon B
Taxon C
Taxon E
Taxon D
No meaning to the
spacing between the
taxa, or to the order in
which they appear from
top to bottom.
This dimension either can have no scale (for ‘cladograms’),
can be proportional to genetic distance or amount of change
(for ‘phylograms’ or ‘additive trees’), or can be proportional
to time (for ‘ultrametric trees’ or true evolutionary trees).
These say that B and C are more closely related to each other than either is to A,
and that A, B, and C form a clade that is a sister group to the clade composed of
D and E. If the tree has a time scale, then D and E are the most closely related.
Based on lectures by C-B Stewart,
and by Tal Pupko
A few examples of what can be inferred
from phylogenetic trees built from DNA
or protein sequence data:
 Which species are the closest living relatives of
modern humans?
 Did the infamous Florida Dentist infect his
patients with HIV?
 What were the origins of specific transposable
elements?
 Plus countless others…..
Which species are the closest living
relatives of modern humans?
Mitochondrial DNA, most nuclear DNA-
encoded genes, and DNA/DNA
hybridization all show that bonobos and
chimpanzees are related more closely to
humans than either are to gorillas.
The pre-molecular view was that the great
apes (chimpanzees, gorillas and
orangutans) formed a clade separate from
humans, and that humans diverged from
the apes at least 15-30 MYA.
MYA
Chimpanzees
Orangutans Humans
Bonobos
GorillasHumans
Bonobos
Gorillas Orangutans
Chimpanzees
MYA
015-30014
Did the Florida Dentist infect his patients with HIV?
DENTIST
DENTIST
Patient D
Patient F
Patient C
Patient A
Patient G
Patient B
Patient E
Patient A
Local control 2
Local control 3
Local control 9
Local control 35
Local control 3
Yes:
The HIV sequences
from
these patients fall
within
the clade of HIV
sequences found in
the dentist.No
No
From Ou et al. (1992) and Page & Holmes (1998)
Phylogenetic tree
of HIV sequences
from the DENTIST,
his Patients, & Local
HIV-infected People:
Based on lectures by C-B Stewart,
and by Tal Pupko
A few examples of what can be learned from
character analysis using phylogenies as analytical
frameworks:
• When did specific episodes of positive Darwinian
selection occur during evolutionary history?
• Which genetic changes are unique to the human
lineage?
• What was the most likely geographical location of
the common ancestor of the African apes and
humans?
• Plus countless others…..
Based on lectures by C-B Stewart,
and by Tal Pupko
The number of unrooted trees increases in a greater
than exponential manner with number of taxa
(2N - 5)!! = # unrooted trees for N taxa
CA
B D
A B
C
A D
B E
C
A D
B E
C
F
Based on lectures by C-B Stewart,
and by Tal Pupko
Inferring evolutionary relationships between
the taxa requires rooting the tree:
To root a tree mentally,
imagine that the tree is
made of string. Grab the
string at the root and
tug on it until the ends of
the string (the taxa) fall
opposite the root: A
B
C
Root D
A B C D
Root
Note that in this rooted tree,
taxon A is no more closely
related to taxon B than it is to
C or D.
Rooted tree
Unrooted tree
Based on lectures by C-B Stewart,
and by Tal Pupko
Now, try it again with the root at another position:
A
B
C
Root
D
Unrooted tree
Note that in this rooted tree, taxon A
is most closely related to taxon B,
and together they are equally
distantly related to taxa C and D.
C D
Roo
t
Rooted tree
A
B
Based on lectures by C-B Stewart,
and by Tal Pupko
An unrooted, four-taxon tree theoretically can be rooted in five
different places to produce five different rooted trees
The unrooted tree 1:
A C
B D
Rooted tree 1d
C
D
A
B
4
Rooted tree 1c
A
B
C
D
3
Rooted tree 1e
D
C
A
B
5
Rooted tree 1b
A
B
C
D
2
Rooted tree 1a
B
A
C
D
1
These trees show five different evolutionary relationships among the taxa!
Based on lectures by C-B Stewart,
and by Tal Pupko
By outgroup:
Uses taxa (the “outgroup”) that are
known to fall outside of the group of
interest (the “ingroup”). Requires
some prior knowledge about the
relationships among the taxa. The
outgroup can either be species (e.g.,
birds to root a mammalian tree) or
previous gene duplicates (e.g.,
α-globins to root β-globins).
There are two major ways to root trees:
A
B
C
D
10
2
3
5
2
By midpoint or distance:
Roots the tree at the midway point
between the two most distant taxa in
the tree, as determined by branch
lengths. Assumes that the taxa are
evolving in a clock-like manner. This
assumption is built into some of the
distance-based tree building methods.
outgroup
d (A,D) = 10 + 3 + 5 = 18
Midpoint = 18 / 2 = 9
COMPUTATIONAL METHOD
Clustering algorithmOptimality criterion
DATATYPE
Character
s
Distances
PARSIMONY
MAXIMUM LIKELIHOOD
UPGMA
NEIGHBOR-JOINING
MINIMUM EVOLUTION
LEAST SQUARES
Classification of phylogenetic inference methods
Based on lectures by C-B Stewart,
and by Tal Pupko
Parsimony methods:
Optimality criterion: The ‘most-parsimonious’ tree is the one that
requires the fewest number of evolutionary events (e.g., nucleotide
substitutions, amino acid replacements) to explain the sequences.
Advantages:
• Are simple, intuitive, and logical (many possible by ‘pencil-and-paper’).
• Can be used on molecular and non-molecular (e.g., morphological) data.
• Can tease apart types of similarity (shared-derived, shared-ancestral, homoplasy)
• Can be used for character (can infer the exact substitutions) and rate analysis.
• Can be used to infer the sequences of the extinct (hypothetical) ancestors.
Disadvantages:
• Are simple, intuitive, and logical (derived from “Medieval logic”, not statistics!)
• Can be fooled by high levels of homoplasy (‘same’ events).
• Can become positively misleading in the “Felsenstein Zone”:
[See Stewart (1993) for a simple explanation of parsimony analysis, and Swofford
et al. (1996) for a detailed explanation of various parsimony methods.]
A B C D
A 0
B 8 0
C 7 9 0
D 12 14 11 0
Table 2:
OUT A B C D r r/2
A 8 7 12 27 13.5
B 9 14 31 15.5
C 11 27 13.5
D 37 18.5
Transformed distance matrix:
A B C D
A 8 7 12
B -21 9 14
C -20 -20 11
D -20 -20 -21
C D Node 1 r r/1
C 11 4 15 15
D -6.5 9 20 20
Node 1 -10 -7.5 13 13
Reduced matrix with with node 1(A & B) and remaining OTUs
D Node 2 r
D 8
Node 2

Phylogenetic analyses1

  • 1.
  • 2.
    The aim: To constructa visual representation (a tree) to describe the assumed evolution occurring between and among different groups (individuals, populations, species, etc.) and to study the reliability of the consensus tree.
  • 3.
    Based on lecturesby C-B Stewart, and by Tal Pupko What is phylogenetic analysis and why should we perform it? Phylogenetic analysis has two major components: 1. Phylogeny inference or “tree building” — the inference of the branching orders, and ultimately the evolutionary relationships, between “taxa” (entities such as genes, populations, species, etc.) 2. Character and rate analysis — using phylogenies as analytical frameworks for rigorous understanding of the evolution of various traits or conditions of interest
  • 4.
    Based on lecturesby C-B Stewart, and by Tal Pupko Ancestral Node or ROOT of the Tree Internal Nodes or Divergence Points (represent hypothetical ancestors of the taxa) Branches or Lineages Terminal Nodes A B C D E Represent the TAXA (genes, populations, species, etc.) used to infer the phylogeny Common Phylogenetic Tree Terminology
  • 5.
    Phylogenetic trees diagramthe evolutionary relationships between the taxa ((A,(B,C)),(D,E)) = The above phylogeny as nested parentheses Taxon A Taxon B Taxon C Taxon E Taxon D No meaning to the spacing between the taxa, or to the order in which they appear from top to bottom. This dimension either can have no scale (for ‘cladograms’), can be proportional to genetic distance or amount of change (for ‘phylograms’ or ‘additive trees’), or can be proportional to time (for ‘ultrametric trees’ or true evolutionary trees). These say that B and C are more closely related to each other than either is to A, and that A, B, and C form a clade that is a sister group to the clade composed of D and E. If the tree has a time scale, then D and E are the most closely related.
  • 6.
    Based on lecturesby C-B Stewart, and by Tal Pupko A few examples of what can be inferred from phylogenetic trees built from DNA or protein sequence data:  Which species are the closest living relatives of modern humans?  Did the infamous Florida Dentist infect his patients with HIV?  What were the origins of specific transposable elements?  Plus countless others…..
  • 7.
    Which species arethe closest living relatives of modern humans? Mitochondrial DNA, most nuclear DNA- encoded genes, and DNA/DNA hybridization all show that bonobos and chimpanzees are related more closely to humans than either are to gorillas. The pre-molecular view was that the great apes (chimpanzees, gorillas and orangutans) formed a clade separate from humans, and that humans diverged from the apes at least 15-30 MYA. MYA Chimpanzees Orangutans Humans Bonobos GorillasHumans Bonobos Gorillas Orangutans Chimpanzees MYA 015-30014
  • 8.
    Did the FloridaDentist infect his patients with HIV? DENTIST DENTIST Patient D Patient F Patient C Patient A Patient G Patient B Patient E Patient A Local control 2 Local control 3 Local control 9 Local control 35 Local control 3 Yes: The HIV sequences from these patients fall within the clade of HIV sequences found in the dentist.No No From Ou et al. (1992) and Page & Holmes (1998) Phylogenetic tree of HIV sequences from the DENTIST, his Patients, & Local HIV-infected People:
  • 9.
    Based on lecturesby C-B Stewart, and by Tal Pupko A few examples of what can be learned from character analysis using phylogenies as analytical frameworks: • When did specific episodes of positive Darwinian selection occur during evolutionary history? • Which genetic changes are unique to the human lineage? • What was the most likely geographical location of the common ancestor of the African apes and humans? • Plus countless others…..
  • 10.
    Based on lecturesby C-B Stewart, and by Tal Pupko The number of unrooted trees increases in a greater than exponential manner with number of taxa (2N - 5)!! = # unrooted trees for N taxa CA B D A B C A D B E C A D B E C F
  • 11.
    Based on lecturesby C-B Stewart, and by Tal Pupko Inferring evolutionary relationships between the taxa requires rooting the tree: To root a tree mentally, imagine that the tree is made of string. Grab the string at the root and tug on it until the ends of the string (the taxa) fall opposite the root: A B C Root D A B C D Root Note that in this rooted tree, taxon A is no more closely related to taxon B than it is to C or D. Rooted tree Unrooted tree
  • 12.
    Based on lecturesby C-B Stewart, and by Tal Pupko Now, try it again with the root at another position: A B C Root D Unrooted tree Note that in this rooted tree, taxon A is most closely related to taxon B, and together they are equally distantly related to taxa C and D. C D Roo t Rooted tree A B
  • 13.
    Based on lecturesby C-B Stewart, and by Tal Pupko An unrooted, four-taxon tree theoretically can be rooted in five different places to produce five different rooted trees The unrooted tree 1: A C B D Rooted tree 1d C D A B 4 Rooted tree 1c A B C D 3 Rooted tree 1e D C A B 5 Rooted tree 1b A B C D 2 Rooted tree 1a B A C D 1 These trees show five different evolutionary relationships among the taxa!
  • 14.
    Based on lecturesby C-B Stewart, and by Tal Pupko By outgroup: Uses taxa (the “outgroup”) that are known to fall outside of the group of interest (the “ingroup”). Requires some prior knowledge about the relationships among the taxa. The outgroup can either be species (e.g., birds to root a mammalian tree) or previous gene duplicates (e.g., α-globins to root β-globins). There are two major ways to root trees: A B C D 10 2 3 5 2 By midpoint or distance: Roots the tree at the midway point between the two most distant taxa in the tree, as determined by branch lengths. Assumes that the taxa are evolving in a clock-like manner. This assumption is built into some of the distance-based tree building methods. outgroup d (A,D) = 10 + 3 + 5 = 18 Midpoint = 18 / 2 = 9
  • 15.
    COMPUTATIONAL METHOD Clustering algorithmOptimalitycriterion DATATYPE Character s Distances PARSIMONY MAXIMUM LIKELIHOOD UPGMA NEIGHBOR-JOINING MINIMUM EVOLUTION LEAST SQUARES Classification of phylogenetic inference methods
  • 16.
    Based on lecturesby C-B Stewart, and by Tal Pupko Parsimony methods: Optimality criterion: The ‘most-parsimonious’ tree is the one that requires the fewest number of evolutionary events (e.g., nucleotide substitutions, amino acid replacements) to explain the sequences. Advantages: • Are simple, intuitive, and logical (many possible by ‘pencil-and-paper’). • Can be used on molecular and non-molecular (e.g., morphological) data. • Can tease apart types of similarity (shared-derived, shared-ancestral, homoplasy) • Can be used for character (can infer the exact substitutions) and rate analysis. • Can be used to infer the sequences of the extinct (hypothetical) ancestors. Disadvantages: • Are simple, intuitive, and logical (derived from “Medieval logic”, not statistics!) • Can be fooled by high levels of homoplasy (‘same’ events). • Can become positively misleading in the “Felsenstein Zone”: [See Stewart (1993) for a simple explanation of parsimony analysis, and Swofford et al. (1996) for a detailed explanation of various parsimony methods.]
  • 25.
    A B CD A 0 B 8 0 C 7 9 0 D 12 14 11 0 Table 2: OUT A B C D r r/2 A 8 7 12 27 13.5 B 9 14 31 15.5 C 11 27 13.5 D 37 18.5
  • 26.
    Transformed distance matrix: AB C D A 8 7 12 B -21 9 14 C -20 -20 11 D -20 -20 -21 C D Node 1 r r/1 C 11 4 15 15 D -6.5 9 20 20 Node 1 -10 -7.5 13 13 Reduced matrix with with node 1(A & B) and remaining OTUs
  • 27.
    D Node 2r D 8 Node 2