The document discusses scoring systems for sequence alignment, including substitution matrices such as PAM and BLOSUM, which are used to score matches, mismatches, and gaps in nucleotides and amino acids. It explains the differences between transitions and transversions, as well as how PAM matrices are derived from evolutionary relationships while BLOSUM matrices are based on multiple sequence alignments. Higher PAM numbers correlate with greater evolutionary distance, and BLOSUM matrices reflect actual percentage values of sequence identities.
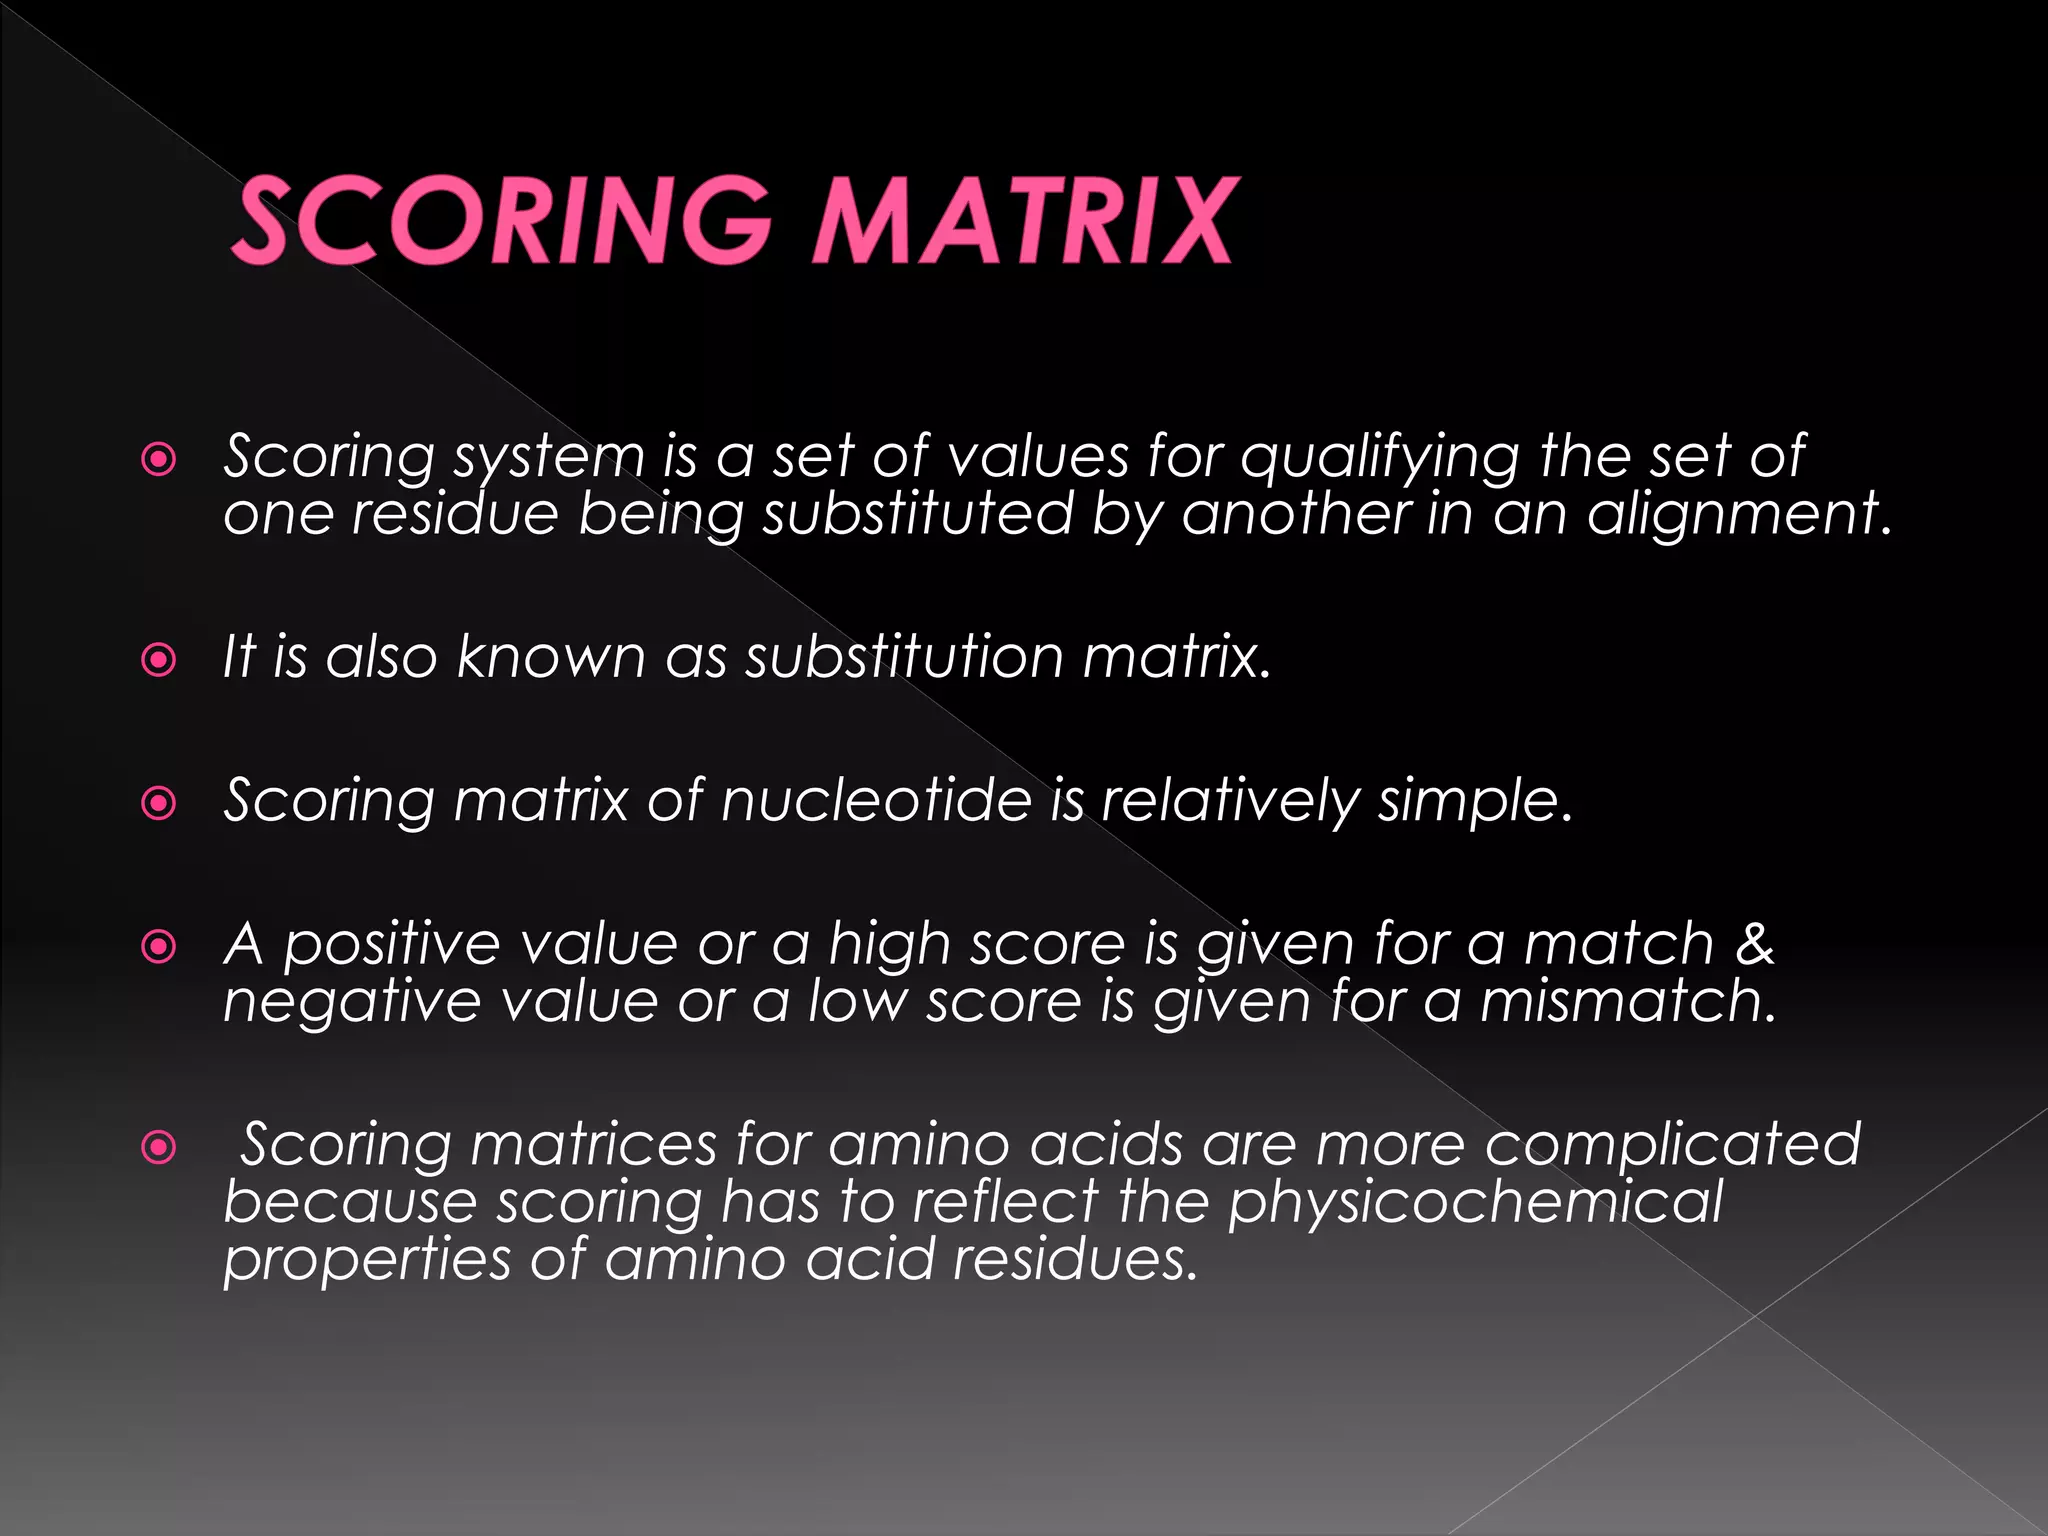
Scoring systemis a set of values for qualifying the set of
one residue being substituted by another in an alignment.
It is also known as substitution matrix.
Scoring matrix of nucleotide is relatively simple.
A positive value or a high score is given for a match &
negative value or a low score is given for a mismatch.
Scoring matrices for amino acids are more complicated
because scoring has to reflect the physicochemical
properties of amino acid residues.
3.
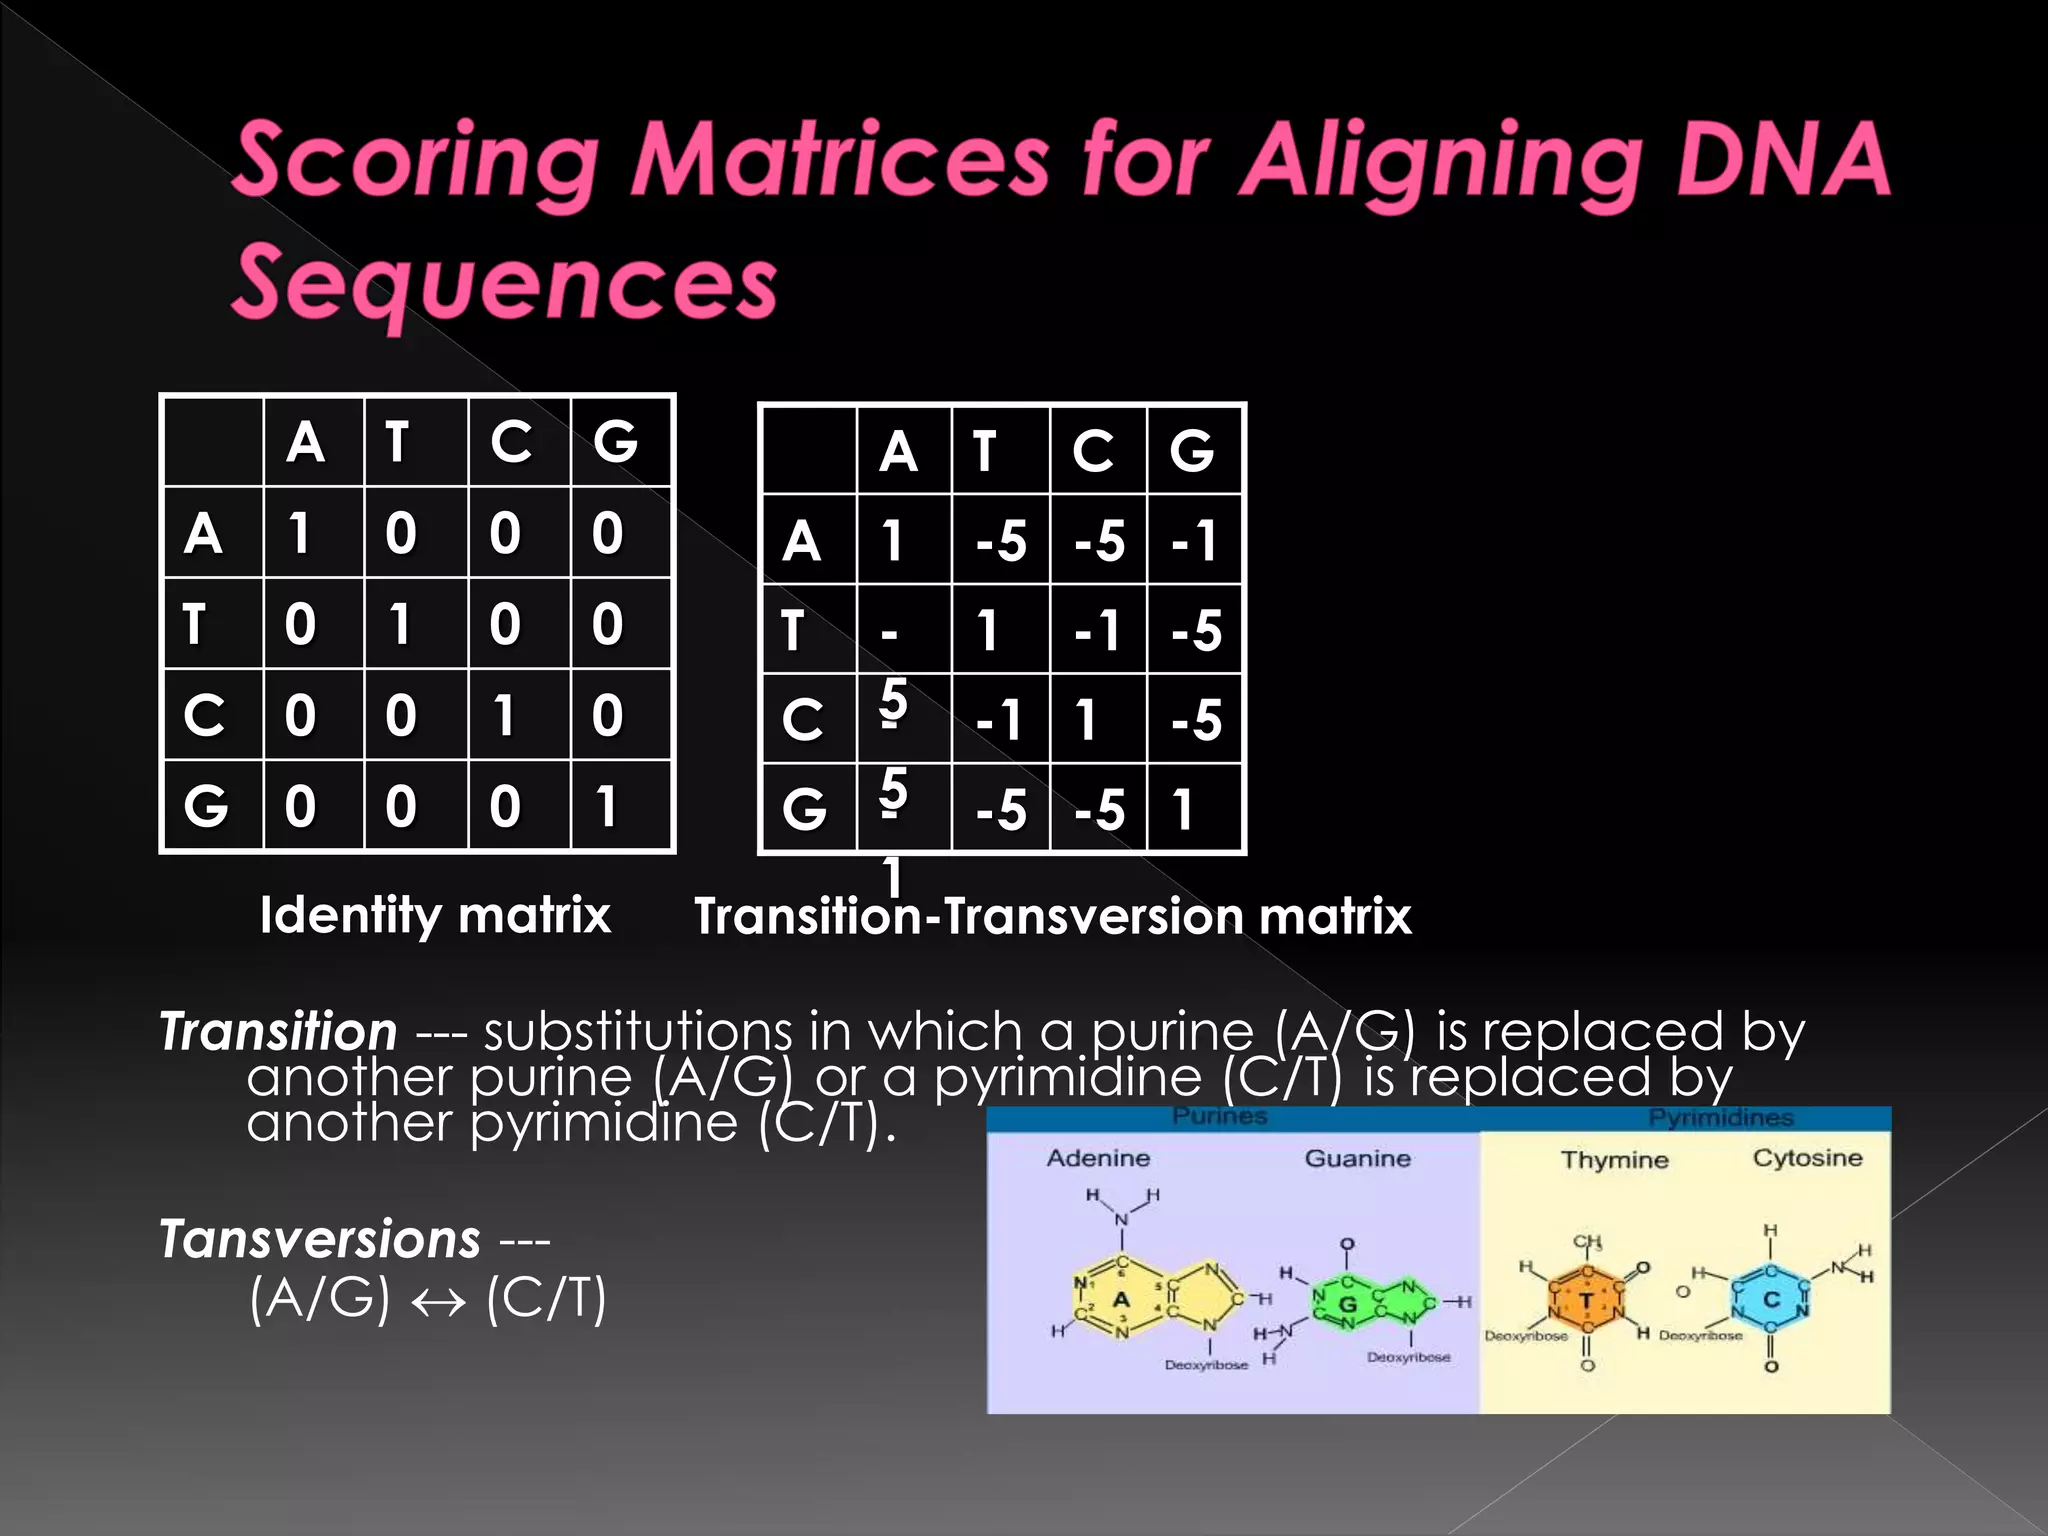
Transition --- substitutionsin which a purine (A/G) is replaced by
another purine (A/G) or a pyrimidine (C/T) is replaced by
another pyrimidine (C/T).
Tansversions ---
(A/G) (C/T)
1000G
0100C
0010T
0001A
GCTA
Identity matrix
1-5-5-
1
G
-51-1-
5
C
-5-11-
5
T
-1-5-51A
GCTA
Transition-Transversion matrix
PAM - pointaccepted mutation based on
global alignment [evolutionary model]
BLOSUM - Block substitutions based on
local alignments [similarity among
conserved sequences]
6.
First givenby Dayhoff who compiled alignment of 71
groups of very closely related protein sequences.
PAM- Point Accepted Mutation.
PAM matrix were derived based on evolutionary
divergence between sequences of protein structure.
Construction of PAM1 matrix involves alignment of full
length sequence & subsequent construction of
phylogenic trees using parsimony principle.
7.
Ancestral sequenceinformation is used to count the number
of substitution along each branch of tree.
Positive scores in the matrix denotes substitutions occurring
more frequently than expected among evolutionary
conserved replacements.
Negative score corresponds to substution which occurs less
frequently.
A PAM is defined as 1% amino acid change or one mutation
per 100 residues.
The increasing PAM numbers correlate with increasing PAM
units & thus evolutionary distances of protein sequences.
8.
Constructed basedon the phylogenetic
relationships prior to scoring mutations;
Difficulty of determining ancestral
relationships among sequences;
Based on a small set of closely related
proteins;
9.
It isa series of block amino acid substitution matrix.
Derived on the basis of direct observation for every
possible amino acid substitution in multiple sequence
alignment.
Sequence pattern is also called as block.
Ungapped alignments are less than 60 amino acid in
length.
BLOSUM matrix are actual % values of sequence
selected for construction of matrix.
10.
BLOSUM 62indicates that sequence selected for
constructing the matrix is an average share of 62%.
BLOSUM share for a particular residue pair is derived
from the log ratio of observed residue substitution
versus the expected probability of particular residue.
Lower the number of BLOSUM more divergent species
are present.
11.
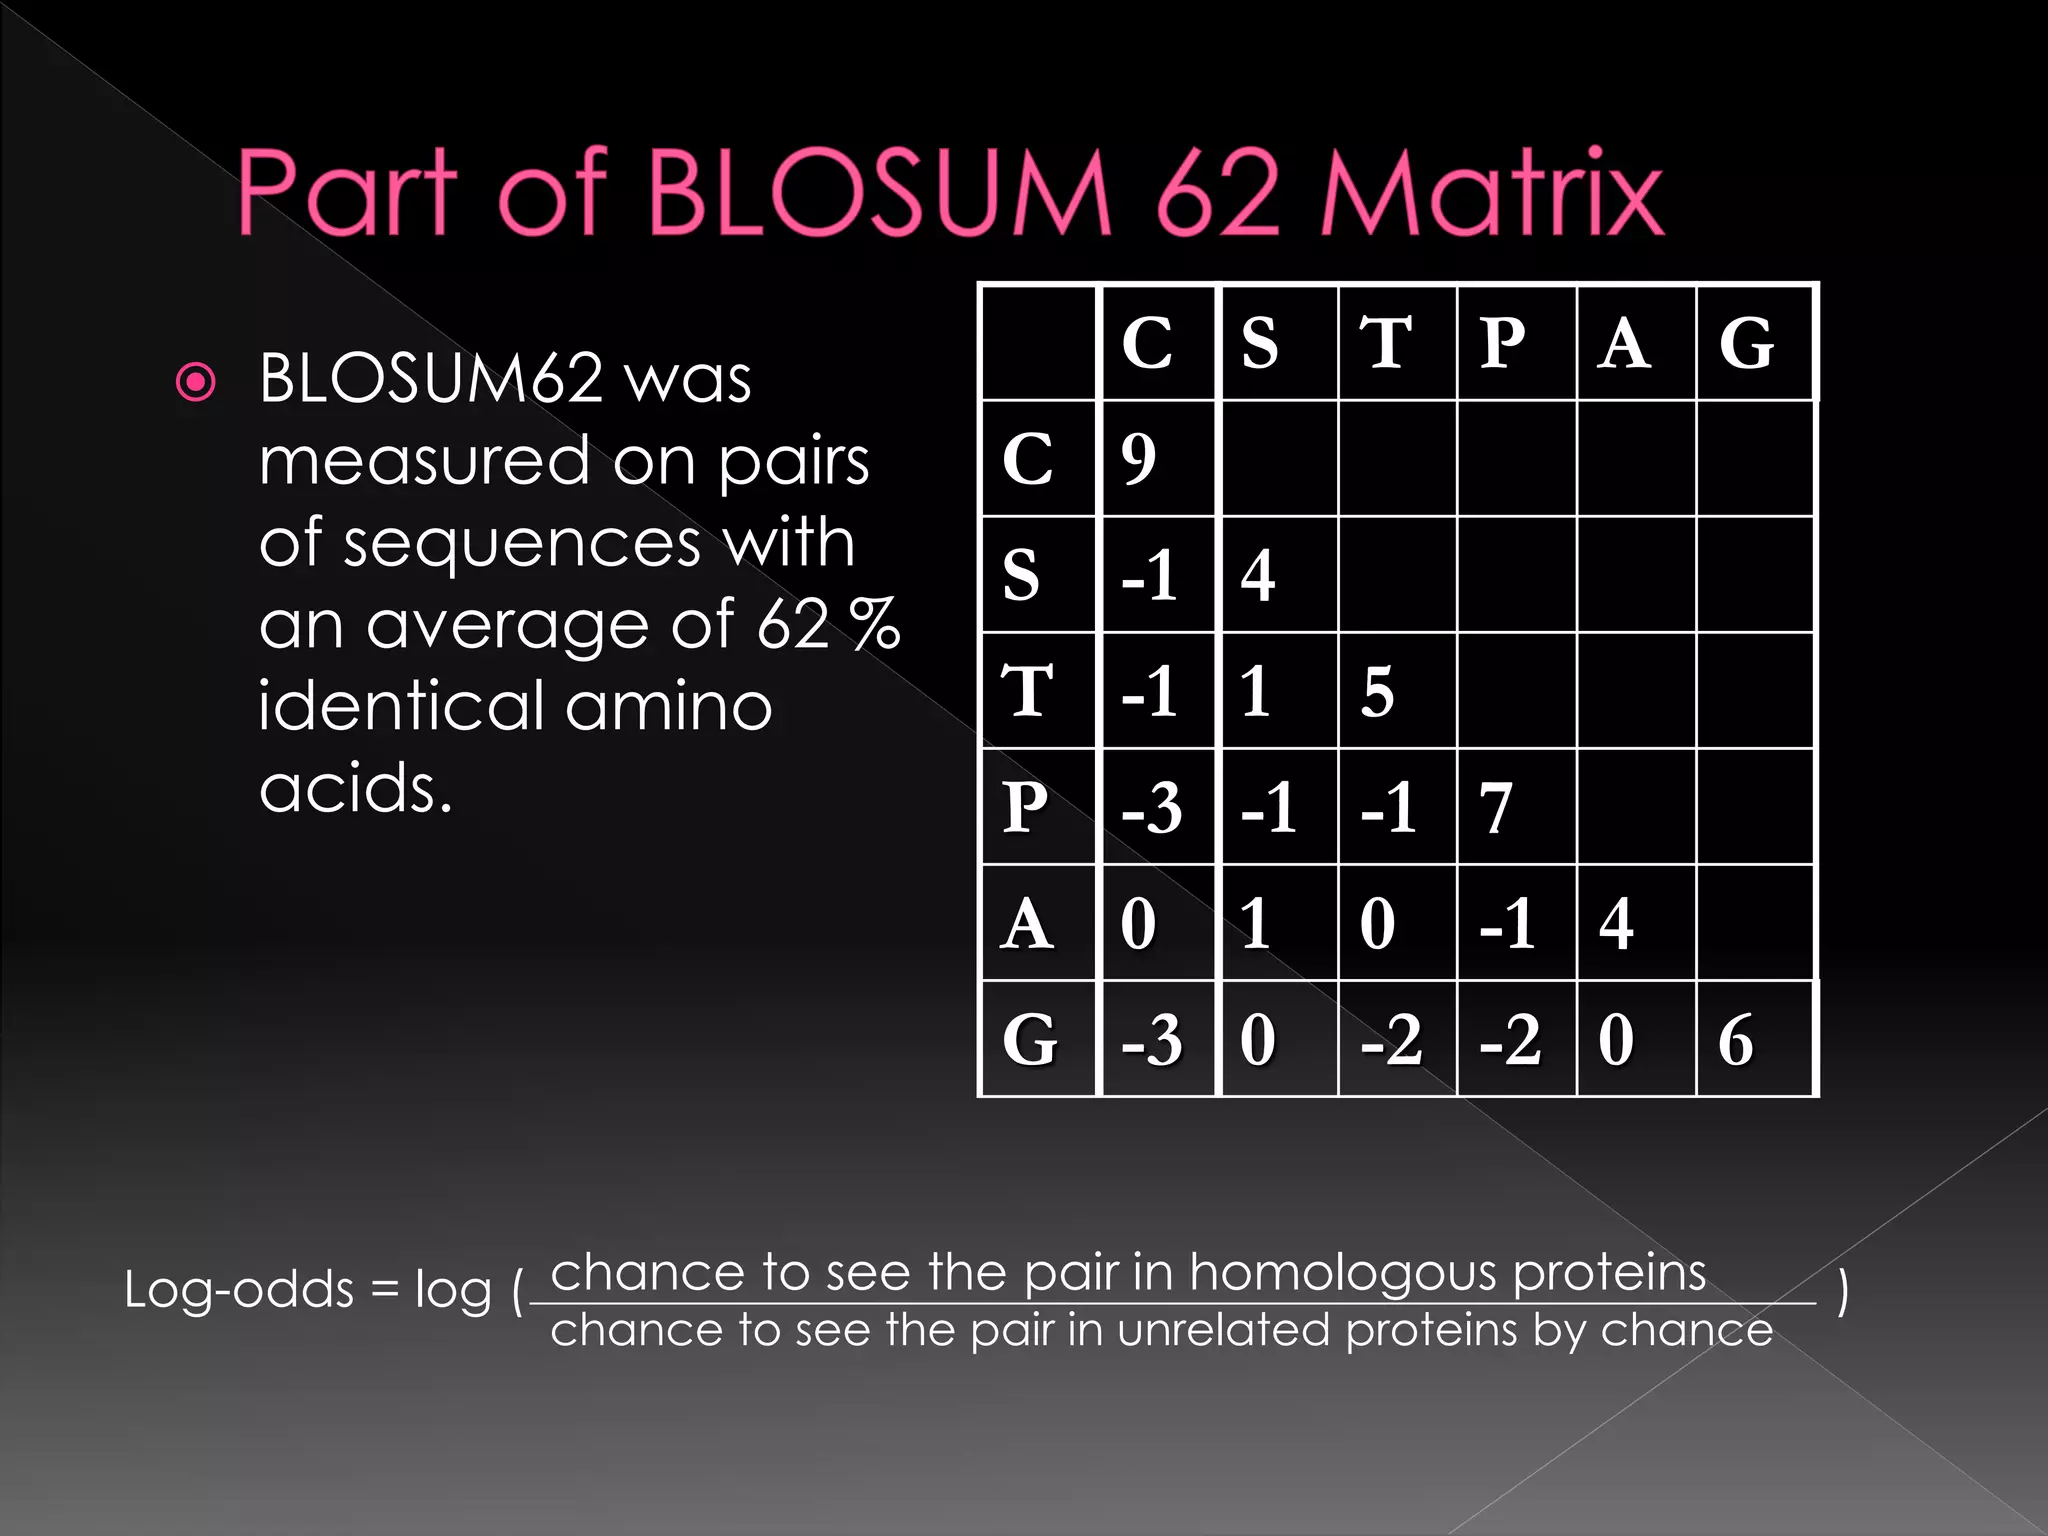
C S TP A G
C 9
S -1 4
T -1 1 5
P -3 -1 -1 7
A 0 1 0 -1 4
G -3 0 -2 -2 0 6
BLOSUM62 was
measured on pairs
of sequences with
an average of 62 %
identical amino
acids.
Log-odds = log ( )chance to see the pair in homologous proteins
chance to see the pair in unrelated proteins by chance
12.
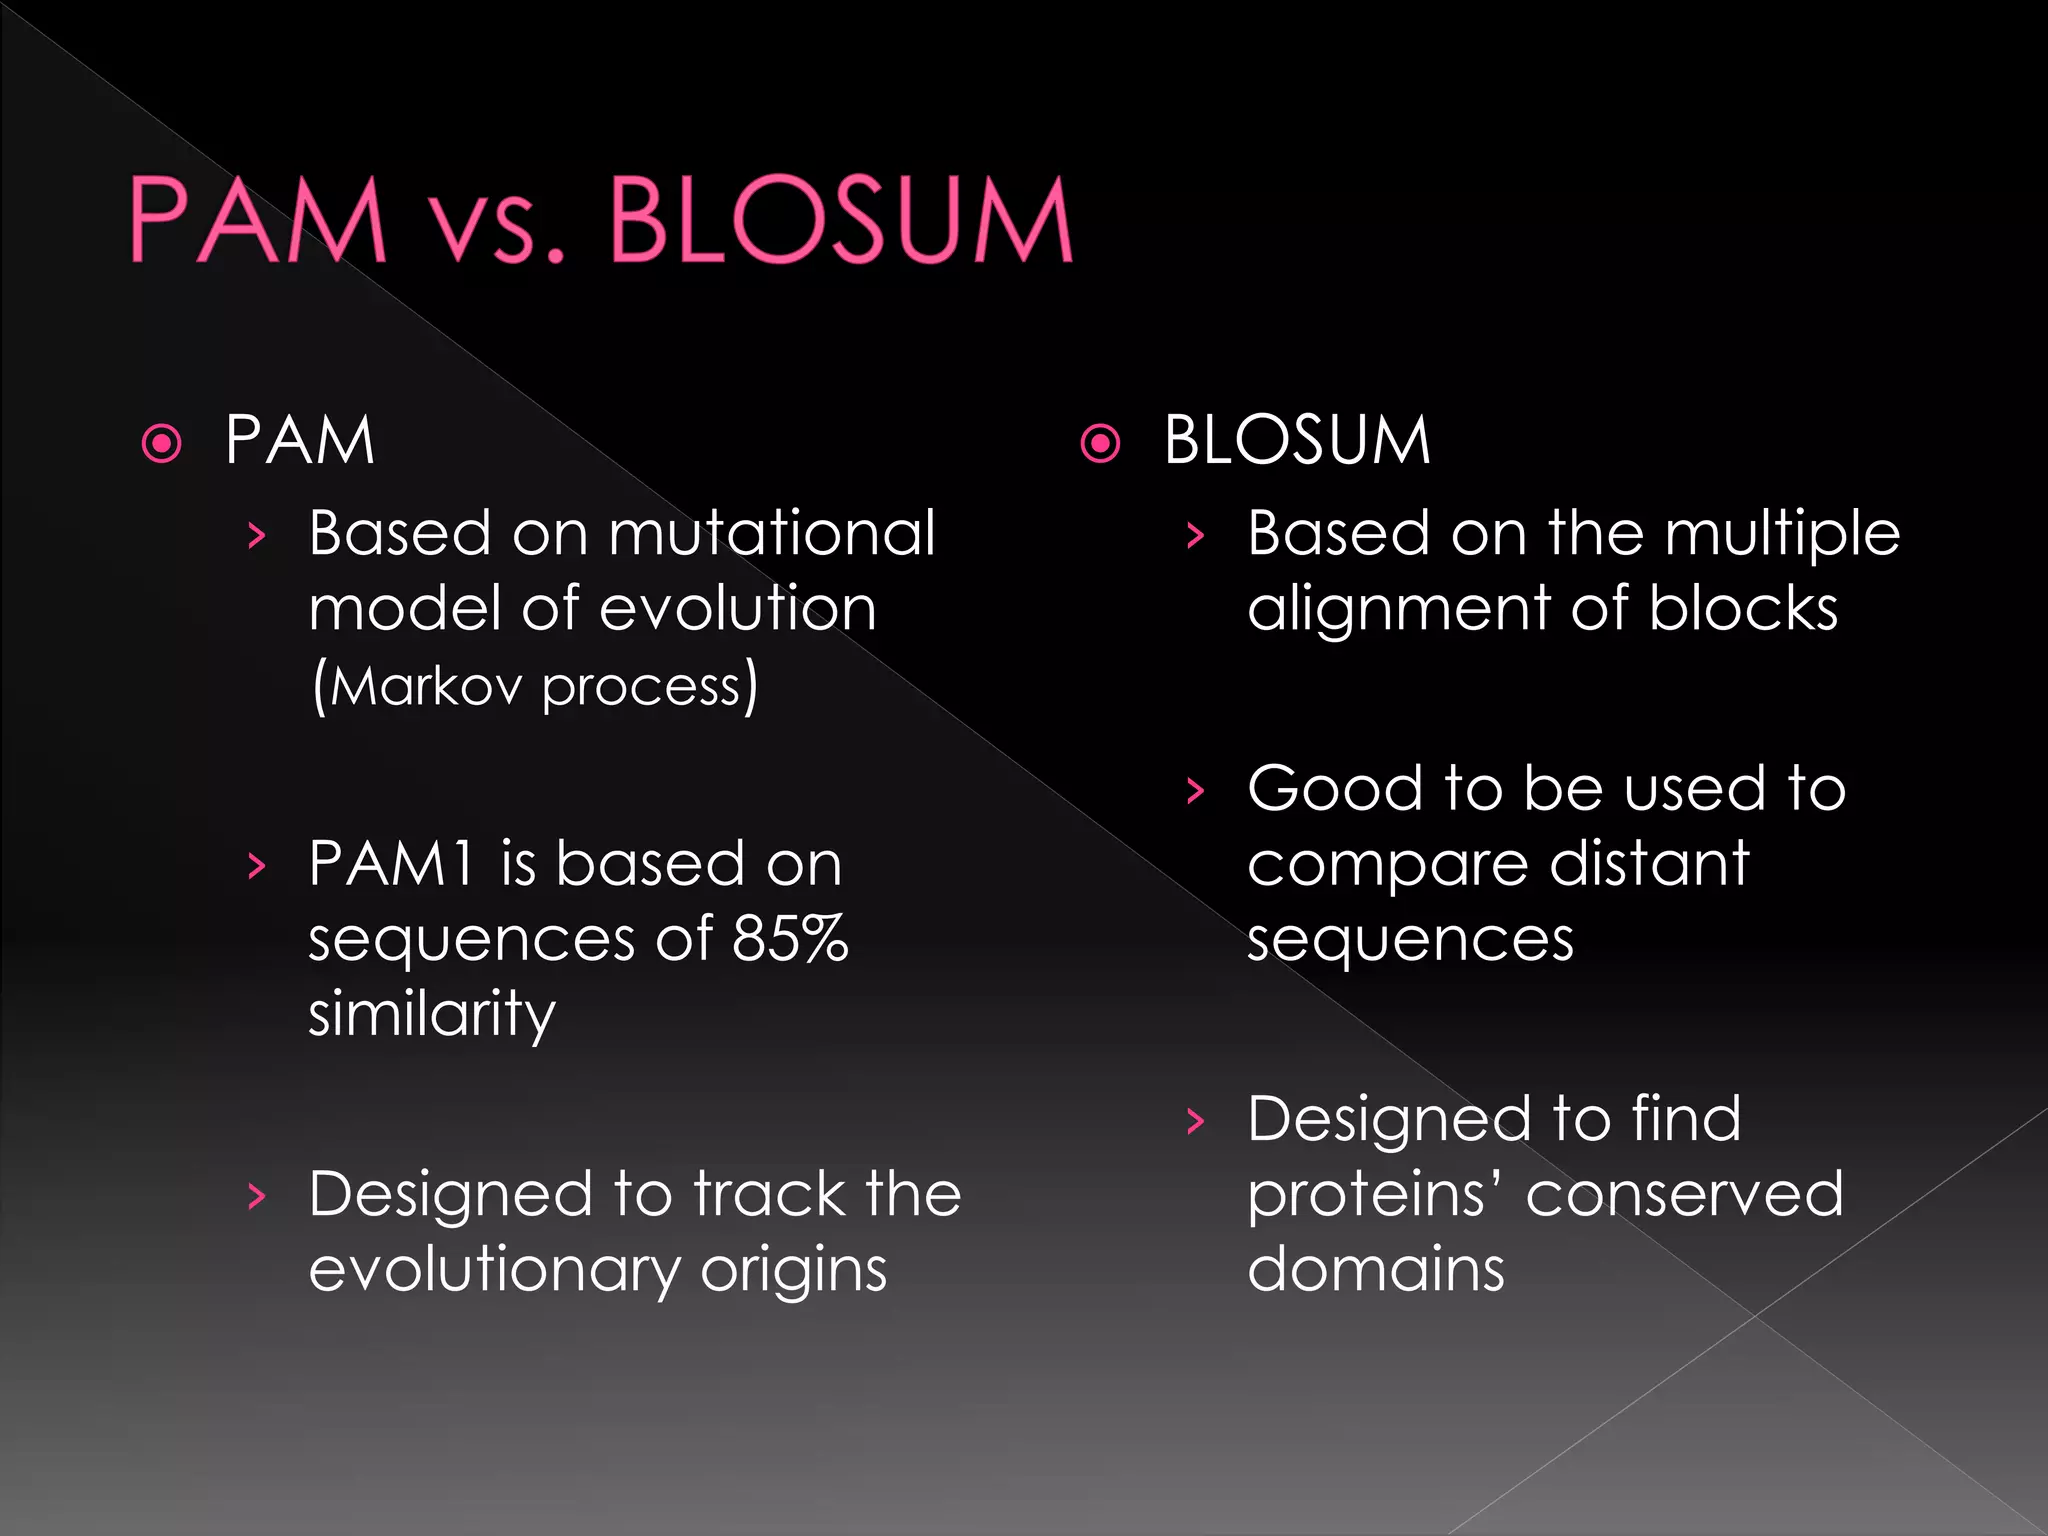
PAM
› Basedon mutational
model of evolution
(Markov process)
› PAM1 is based on
sequences of 85%
similarity
› Designed to track the
evolutionary origins
BLOSUM
› Based on the multiple
alignment of blocks
› Good to be used to
compare distant
sequences
› Designed to find
proteins’ conserved
domains
![PAM - point accepted mutation based on
global alignment [evolutionary model]
BLOSUM - Block substitutions based on
local alignments [similarity among
conserved sequences]](https://image.slidesharecdn.com/scoringmatrices-150923184207-lva1-app6891/75/Scoring-matrices-5-2048.jpg)


![Bio info statistical-methods[1]](https://cdn.slidesharecdn.com/ss_thumbnails/bioinfo-statisticalmethods1-150123025112-conversion-gate02-thumbnail.jpg?width=640&height=640&fit=bounds)


