The document discusses Nuclear Magnetic Resonance (NMR) spectroscopy, outlining its historical development and fundamental principles, including the interaction between electromagnetic radiation and atomic nuclei. It details the instrumentation involved in NMR, relaxation processes, and factors influencing chemical shifts, as well as the applications of NMR in various fields such as pharmaceutical development and chemical research. Key concepts such as shielding, deshielding, spin-spin coupling, and chemical shifts are also highlighted.


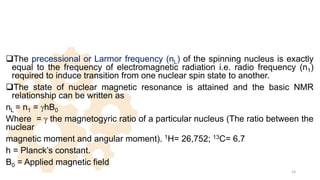
![• d is a dimensionless quantity, independent of the measurement frequency or the
magnetic field strength, characteristic of the observed nucleus in its
environment.
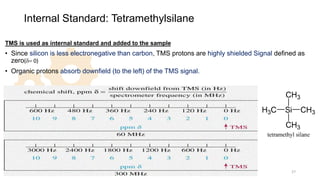
• Chemical shifts are calculated by measuring the frequency n cycles per second,
or hertz Hz) of interest relative to the frequency of the internal standard, nTMS
divided by the frequency of the instrument (n0 in MHz=106 Hz).
• d=[(n-nTMS) x 106]/v0]
• Another alternative system used for used for defining the position of the
resonance relative to reference is assigned tau (t) scale On this scale, the
reference is assigned the arbitrary position 10 and the values of other
resonances are given by. 26](https://image.slidesharecdn.com/nmrnew-240116170124-247e8b5b/85/NMR-principle-chemical-shift-valu-13-C-application-26-320.jpg)


![Polymer [ बहुलक ] Chemistry Notes PDF - Irfanullah Mehar - JJ Sir Chemistry.pdf](https://cdn.slidesharecdn.com/ss_thumbnails/polymerchemistrynotespdf-irfanullahmehar-jjsirchemistry-260210172118-3f9b37f7-thumbnail.jpg?width=640&height=640&fit=bounds)


