Download to read offline

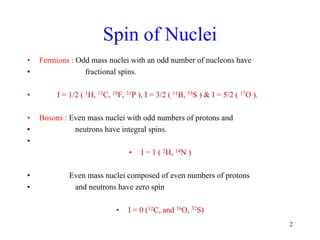
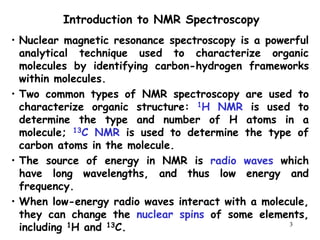
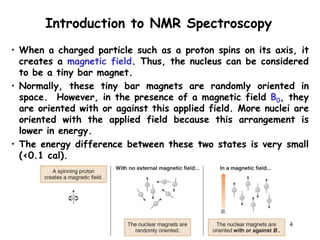
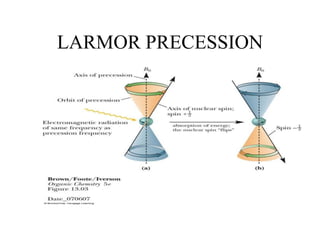
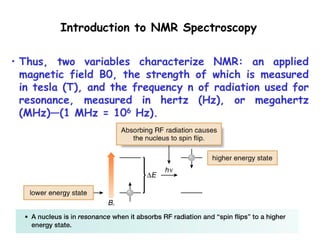
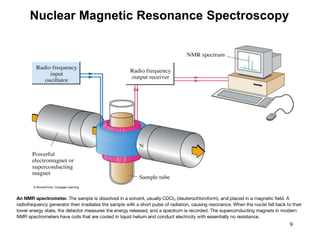
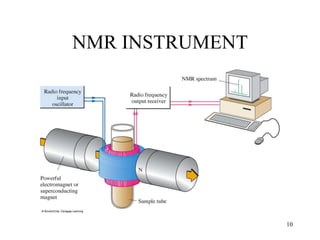
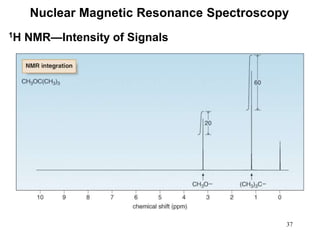
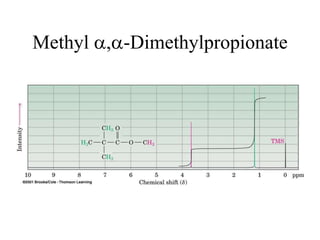
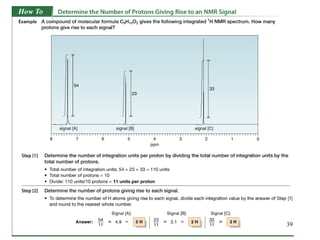
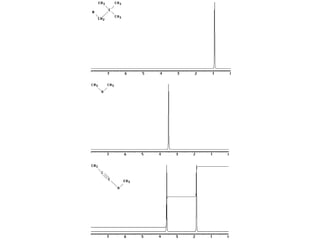
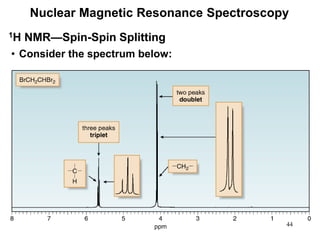

1. Nuclear magnetic resonance spectroscopy uses radio waves and strong magnetic fields to analyze organic molecules. It can identify carbon-hydrogen frameworks and determine the number and type of hydrogen and carbon atoms in a molecule. 2. When nuclei with an odd number of protons and/or neutrons are placed in a strong magnetic field, their spins can be either aligned with or against the field. This creates two energy states that radio waves can excite between. 3. The frequency at which excitation occurs depends on the magnetic field strength and the local electronic environment of the nucleus. This frequency corresponds to absorption peaks in the NMR spectrum and provides information about the structure of the molecule.


![CTEV [ clubfoot] DR ARUN LAL ,DR MOHAMED ASHRAF travancore medical college k...](https://cdn.slidesharecdn.com/ss_thumbnails/ctevclubfootdrarunlaldrmohamedashraftravancoremedicalcollegekollamkeralaindia-260208063247-18fc466c-thumbnail.jpg?width=640&height=640&fit=bounds)