Downloaded 86 times


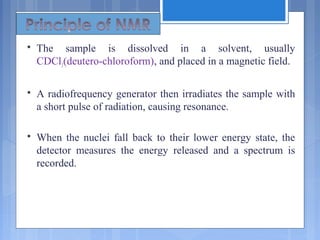
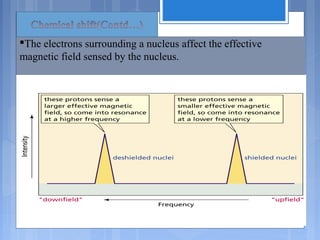
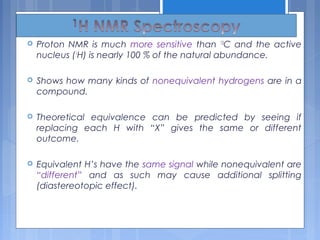
![ The relative energy of resonance of a particular nucleus resulting
from its local environment is called chemical shift.
NMR spectra show applied field strength increasing from left to
right.
Left part is downfield, the right is upfield.
Nuclei that absorb on upfield side are strongly shielded where
nuclei that absorb on downfield side is weakly shielded.
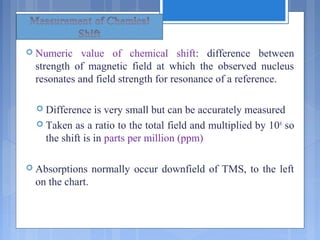
Chart calibrated versus a reference point, set as 0,
tetramethylsilane [TMS].](https://image.slidesharecdn.com/nmrtheory-160423064737/85/Nmr-theory-18-320.jpg)

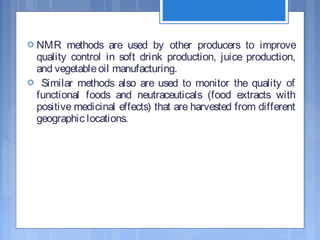
![Applicationsin food
The determination of fat or oil content in fresh food with
high water content is possible when pulsed-field-gradient
spin-echo-method isused.
NMR is used to suppress unwanted signals in studies of
water droplet size distribution in oil (margarine, butter)
[Fourel et al., 1995]
measurements of oil droplet size distribution on oil-in-water
emulsion (mayonnaise, dressings) [Goudappel et al., 2001].
measurements and difusion experiments are very useful for
characterizing gels(e.g. yogurts)[Hinrichset al., 2003].](https://image.slidesharecdn.com/nmrtheory-160423064737/85/Nmr-theory-29-320.jpg)


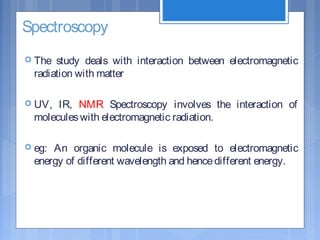
The document discusses nuclear magnetic resonance (NMR) spectroscopy, including its history, principles, instrumentation, and applications. It describes how NMR spectroscopy can be used to characterize organic molecules by identifying carbon-hydrogen frameworks. It explains the basic principles of NMR, such as how atomic nuclei absorb and emit radio frequencies in magnetic fields, producing spectra that reveal the molecule's structure. The document also provides examples of how NMR spectroscopy is used in food analysis applications such as determining fat content and verifying vegetable oil identity.


![Noesy [autosaved]](https://cdn.slidesharecdn.com/ss_thumbnails/noesyautosaved-200728183752-thumbnail.jpg?width=640&height=640&fit=bounds)


