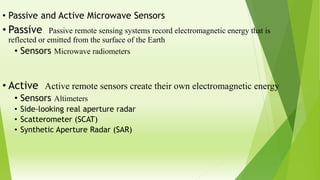
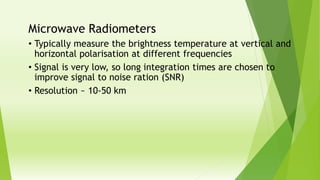
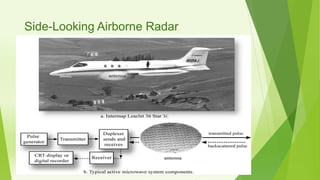
Microwave remote sensing uses both passive and active sensors operating within the wavelength range of 1mm to 1m. Passive sensors such as microwave radiometers record naturally emitted energy, while active sensors like synthetic aperture radar (SAR) generate their own electromagnetic signals. SAR is an example of side-looking radar that uses signal processing to synthesize a very long antenna and improve azimuth resolution. Radar imagery exhibits characteristics like penetration of vegetation and clouds, day/night imaging, and sensitivity to surface properties. However, it also shows distortions from terrain relief and speckle noise from signal interference.
Basic Concepts, Explanation, and Application. Fundamental Remote Sensing; Advantage/ disadvantages, Imaging/non Imaging sensors, RAR and SAR, SAR Geometry, Resolutions in the microwave, Geometric Distortions in SAR, Polarization in SAR, Target Interaction, SAR Interferometry
What is Remote Sensing?
Process of Remote Sensing
Electromagnetic Radiations
Electromagnetic Spectrum
Interaction with Atmosphere
Radiations-Target Interactions
Passive Vs Active Sensing
A remote sensing system uses a detector to sense the reflected or emitted energy from the earth's surface, perhaps modified by the intervening atmosphere. The sensor can be on a satellite, aircraft, or drone. The sensor turns the energy into a voltage, which an analog to digital converter turns into a single integer value (called the Digital Number, or DN) for the energy. Alternatively a digital detector can store the DN directly. We can then display this value with an appropriate color to build up an image of the region sensed by the system. The DN represents the energy sensed by the sensor in a particular part of the electromagnetic spectrum, emitted or reflected from a particular region. The principles can also be applied to sonar imagery, especially useful in water where sound penetrates readily whereas electromagnetic energy attenuates rapidly.
Definitions,
Remote sensing systems can be active or passive: active systems put out their own source of energy (a large "flash bulb") whereas passive systems use solar energy reflected from the surface or thermal energy emitted by the surface. Active systems can achieve higher resolution.
Satellite resolution considers four things: spatial, spectral, radiometric, and temporal resolution.
Electromagnetic radiation and the atmosphere control many aspects of a remote sensing system.
Satellite orbits determine many characteristics of the imagery, what the satellite sees, and how often it revisits an area.
The signal to noise ratio is important for the design of remote sensing systems.
Satellite band tradeoffs.
Interpreting satellite reflectance patterns and images uses various statistical measures to assess surface properties in the image.
The colors used on the display are gray shading for single bands, and RGB for multi-band composites. We can also perform image merge and sharpening to combine the advantages of both panchromatic (higher spatial resolution) and color imagery (better differentiation of surface materials).
Keys for image analysis
Hyperspectral imagery
Spectral reflectance library--different materials reflect radiation differently
This is all about remote sensing. Remote sensing is the acquisition of information about an object or phenomenon without making physical contact with the object and thus in contrast to on-site observation, especially the Earth.Remote sensing is the process of detecting and monitoring the physical characteristics of an area by measuring its reflected and emitted radiation at a distance from the targeted area. Special cameras collect remotely sensed imagesof the Earth, which help researchers "sense" things about the Earth.
hyperspectral remote sensing and its geological applicationsabhijeet_banerjee
this is an introductory presentation on hyperspectral remote sensing, which essential deals with the distinguishing features, imaging spectrometers and its types, and some of the geological applications of hyperspectral remote sensing.
Remote sensing application in agriculture & forestry_Dr Menon A R R (The Kera...India Water Portal
This presentation by Dr A R R Menon, Emeritus scientist, CED on Remote Sensing applications in agriculture and forestry was made at at the Kerala Environment Congress, Trivandrum organised by the Centre for Environment and Development
Application of Remote Sensing in AgricultureUTTAM KUMAR
Remote sensing has been found to be a valuable tool in evaluation, monitoring and management of land, water and crop resources. The launching of the Indian remote sensing satellite (IRS) has enhanced the capabilities for better utilization of this technology and significant progress has been made in soil and land cover mapping, land degradation studies, monitoring of waste land, assessment of crop conditions crop acreage and production estimates
Optical and Microwave Remote Sensing for Crop Monitoring in MexicoCIMMYT
Remote sensing –Beyond images
Mexico 14-15 December 2013
The workshop was organized by CIMMYT Global Conservation Agriculture Program (GCAP) and funded by the Bill & Melinda Gates Foundation (BMGF), the Mexican Secretariat of Agriculture, Livestock, Rural Development, Fisheries and Food (SAGARPA), the International Maize and Wheat Improvement Center (CIMMYT), CGIAR Research Program on Maize, the Cereal System Initiative for South Asia (CSISA) and the Sustainable Modernization of the Traditional Agriculture (MasAgro)
In India, agriculture is one of the major application areas of the remote sensing technology. Various national level agricultural applications have been developed which showcases the use of remote sensing data provided by the sensors/satellites launched by the country’s space agency, Indian Space Research Organisation (ISRO)
Surface Soil Moisture and Groundwater Assessment and Monitoring using Remote ...Jenkins Macedo
This preview is part of the requirement for a comprehensive analysis of remotely sensed surface soil moisture and groundwater assessment and monitoring for global environmental and climate change presented by Christina Geller, candidate for the degree of MSc in Geographic Information Science for Development, and Environment and Jenkins Macedo, candidate for the MS in Environmental Science and Policy at the Department of International Development, Community, and Environmental at Clark University.
Water scarcity is the lack of fresh water resources to meet the standard water demand. There are two type of water scarcity. One is physical. The other is economic water scarcity.
Saudi Arabia stands as a titan in the global energy landscape, renowned for its abundant oil and gas resources. It's the largest exporter of petroleum and holds some of the world's most significant reserves. Let's delve into the top 10 oil and gas projects shaping Saudi Arabia's energy future in 2024.
Quality defects in TMT Bars, Possible causes and Potential Solutions.PrashantGoswami42
Maintaining high-quality standards in the production of TMT bars is crucial for ensuring structural integrity in construction. Addressing common defects through careful monitoring, standardized processes, and advanced technology can significantly improve the quality of TMT bars. Continuous training and adherence to quality control measures will also play a pivotal role in minimizing these defects.
About
Indigenized remote control interface card suitable for MAFI system CCR equipment. Compatible for IDM8000 CCR. Backplane mounted serial and TCP/Ethernet communication module for CCR remote access. IDM 8000 CCR remote control on serial and TCP protocol.
• Remote control: Parallel or serial interface.
• Compatible with MAFI CCR system.
• Compatible with IDM8000 CCR.
• Compatible with Backplane mount serial communication.
• Compatible with commercial and Defence aviation CCR system.
• Remote control system for accessing CCR and allied system over serial or TCP.
• Indigenized local Support/presence in India.
• Easy in configuration using DIP switches.
Technical Specifications
Indigenized remote control interface card suitable for MAFI system CCR equipment. Compatible for IDM8000 CCR. Backplane mounted serial and TCP/Ethernet communication module for CCR remote access. IDM 8000 CCR remote control on serial and TCP protocol.
Key Features
Indigenized remote control interface card suitable for MAFI system CCR equipment. Compatible for IDM8000 CCR. Backplane mounted serial and TCP/Ethernet communication module for CCR remote access. IDM 8000 CCR remote control on serial and TCP protocol.
• Remote control: Parallel or serial interface
• Compatible with MAFI CCR system
• Copatiable with IDM8000 CCR
• Compatible with Backplane mount serial communication.
• Compatible with commercial and Defence aviation CCR system.
• Remote control system for accessing CCR and allied system over serial or TCP.
• Indigenized local Support/presence in India.
Application
• Remote control: Parallel or serial interface.
• Compatible with MAFI CCR system.
• Compatible with IDM8000 CCR.
• Compatible with Backplane mount serial communication.
• Compatible with commercial and Defence aviation CCR system.
• Remote control system for accessing CCR and allied system over serial or TCP.
• Indigenized local Support/presence in India.
• Easy in configuration using DIP switches.
Overview of the fundamental roles in Hydropower generation and the components involved in wider Electrical Engineering.
This paper presents the design and construction of hydroelectric dams from the hydrologist’s survey of the valley before construction, all aspects and involved disciplines, fluid dynamics, structural engineering, generation and mains frequency regulation to the very transmission of power through the network in the United Kingdom.
Author: Robbie Edward Sayers
Collaborators and co editors: Charlie Sims and Connor Healey.
(C) 2024 Robbie E. Sayers
TECHNICAL TRAINING MANUAL GENERAL FAMILIARIZATION COURSEDuvanRamosGarzon1
AIRCRAFT GENERAL
The Single Aisle is the most advanced family aircraft in service today, with fly-by-wire flight controls.
The A318, A319, A320 and A321 are twin-engine subsonic medium range aircraft.
The family offers a choice of engines
Forklift Classes Overview by Intella PartsIntella Parts
Discover the different forklift classes and their specific applications. Learn how to choose the right forklift for your needs to ensure safety, efficiency, and compliance in your operations.
For more technical information, visit our website https://intellaparts.com
Cosmetic shop management system project report.pdfKamal Acharya
Buying new cosmetic products is difficult. It can even be scary for those who have sensitive skin and are prone to skin trouble. The information needed to alleviate this problem is on the back of each product, but it's thought to interpret those ingredient lists unless you have a background in chemistry.
Instead of buying and hoping for the best, we can use data science to help us predict which products may be good fits for us. It includes various function programs to do the above mentioned tasks.
Data file handling has been effectively used in the program.
The automated cosmetic shop management system should deal with the automation of general workflow and administration process of the shop. The main processes of the system focus on customer's request where the system is able to search the most appropriate products and deliver it to the customers. It should help the employees to quickly identify the list of cosmetic product that have reached the minimum quantity and also keep a track of expired date for each cosmetic product. It should help the employees to find the rack number in which the product is placed.It is also Faster and more efficient way.
Industrial Training at Shahjalal Fertilizer Company Limited (SFCL)MdTanvirMahtab2
This presentation is about the working procedure of Shahjalal Fertilizer Company Limited (SFCL). A Govt. owned Company of Bangladesh Chemical Industries Corporation under Ministry of Industries.
Immunizing Image Classifiers Against Localized Adversary Attacksgerogepatton
This paper addresses the vulnerability of deep learning models, particularly convolutional neural networks
(CNN)s, to adversarial attacks and presents a proactive training technique designed to counter them. We
introduce a novel volumization algorithm, which transforms 2D images into 3D volumetric representations.
When combined with 3D convolution and deep curriculum learning optimization (CLO), itsignificantly improves
the immunity of models against localized universal attacks by up to 40%. We evaluate our proposed approach
using contemporary CNN architectures and the modified Canadian Institute for Advanced Research (CIFAR-10
and CIFAR-100) and ImageNet Large Scale Visual Recognition Challenge (ILSVRC12) datasets, showcasing
accuracy improvements over previous techniques. The results indicate that the combination of the volumetric
input and curriculum learning holds significant promise for mitigating adversarial attacks without necessitating
adversary training.
COLLEGE BUS MANAGEMENT SYSTEM PROJECT REPORT.pdfKamal Acharya
The College Bus Management system is completely developed by Visual Basic .NET Version. The application is connect with most secured database language MS SQL Server. The application is develop by using best combination of front-end and back-end languages. The application is totally design like flat user interface. This flat user interface is more attractive user interface in 2017. The application is gives more important to the system functionality. The application is to manage the student’s details, driver’s details, bus details, bus route details, bus fees details and more. The application has only one unit for admin. The admin can manage the entire application. The admin can login into the application by using username and password of the admin. The application is develop for big and small colleges. It is more user friendly for non-computer person. Even they can easily learn how to manage the application within hours. The application is more secure by the admin. The system will give an effective output for the VB.Net and SQL Server given as input to the system. The compiled java program given as input to the system, after scanning the program will generate different reports. The application generates the report for users. The admin can view and download the report of the data. The application deliver the excel format reports. Because, excel formatted reports is very easy to understand the income and expense of the college bus. This application is mainly develop for windows operating system users. In 2017, 73% of people enterprises are using windows operating system. So the application will easily install for all the windows operating system users. The application-developed size is very low. The application consumes very low space in disk. Therefore, the user can allocate very minimum local disk space for this application.
2. • Passive and Active Microwave Sensors
• Passive Passive remote sensing systems record electromagnetic energy that is
reflected or emitted from the surface of the Earth
• Sensors Microwave radiometers
• Active Active remote sensors create their own electromagnetic energy
• Sensors Altimeters
• Side-looking real aperture radar
• Scatterometer (SCAT)
• Synthetic Aperture Radar (SAR)
4. Microwave Radiometers
• Typically measure the brightness temperature at vertical and
horizontal polarisation at different frequencies
• Signal is very low, so long integration times are chosen to
improve signal to noise ration (SNR)
• Resolution ~ 10-50 km
5. CryoSat
Launch in spring 2010
CryoSat will measures the thickness of
the polar ice sheets and floating sea
ice with a radar altimeter called SIRAL
(Synthetic Aperture Radar
Interferometry Radar Altimeter)
7. •Scatterometers
• Scatterometers are side-looking real aperture radars
designed to achieve a high radiometric accuracy
• retrieve wind fields over the oceans > several look directions
during one overpass
8. Synthetic Aperture Radar (SAR)
To improve the azimuth resolution, a very long
antenna is synthesized electronically. Many pulses
are sent towards the object.
Due to the motion of the platform the frequency of the
echoes is Doppler shifted.
9. Characteristics of radar remote
sensing
Advantages compared to optical remote sensing
all weather capability (small sensitivity of clouds, light rain)
day and night operation (independence of sun illumination)
no effects of atmospheric constituents (multi temporal analysis)
sensitivity to dielectric properties (water content , biomass, ice)
sensitivity to surface roughness ( ocean wind speed)
sensitivity to man made objects
sensitivity to target structure (use of polarimetry)
subsurface penetration
10. Characteristics of radar remote sensing
Inconvenients
Complex interactions (difficulty in understanding, complex processing)
Speckle effects (difficulty in visual interpretation)
topograhic effects
effect of surface roughness
11. Penetration Depth
The penetration of microwaves into vegetation, soil and snow generally increases with wavelength
Response of a pine forest in X-, C- and L-band
12. RADAR Wavelengths and Frequencies
used in Active Microwave Remote
Sensing Investigations
Band Designations
(common wavelengths Wavelength Frequency
shown in parentheses) in cm in GHz
_______________________________________________
Frequency band
Ka
K
Ku
X
C
S
L
P
Wavelength (cm)
0.8-1.1
1.1-1.7
1.7-2.4
2.4-3.8
3.8-7.5
7.5-15
15 -30
30 -100
13. Primary Advantages of RADAR
Remote Sensing of the
Environment
• Active microwave energy penetrates clouds and can be an
all-weather remote sensing system.
• Synoptic views of large areas, for mapping at 1:25,000 to
1:400,000; cloud-shrouded countries may be imaged.
• Coverage can be obtained at user-specified times, even at
night.
• Permits imaging at shallow look angles, resulting in different
perspectives that cannot always be obtained using aerial
photography.
• Senses in wavelengths outside the visible and infrared regions
of the electromagnetic spectrum, providing information on
surface roughness, dielectric properties, and moisture
content.
14. Secondary Advantages of RADAR
Remote Sensing of the Environment
May penetrate vegetation, sand, and surface layers of snow.
• Has its own illumination, and the angle of illumination can be controlled.
• Enables resolution to be independent of distance to the object, with the
size of a resolution cell being as small as 1 x 1 m.
• Images can be produced from different types of polarized energy (HH,
HV, VV, VH).
• May operate simultaneously in several wavelengths (frequencies) and
thus has multi-frequency potential.
• Can measure ocean wave properties, even from orbital altitudes.
• Can produce overlapping images suitable for stereoscopic viewing and
radargrammetry.
• Supports interferometric operation using two antennas for 3-D mapping,
and analysis of incident-angle signatures of objects.
15. Radar
Nomenclature
nadir
azimuth flight direction
look direction
range (near and far)
depression angle (γ)
incidence angle (θ)
altitude aboveground-
level, H
polarization
pulse of microwave energy
Altitude above ground
16. The aircraft travels in a straight
line that is
called the azimuth flight direction
direction.
The terrain illuminated nearest
the aircraft in the line of sight is
called the near-range.
The farthest point of terrain
illuminated by the pulse
of energy is called the far-range.
17. The range or look direction for any radar image is
the direction of the radar illumination that is at right angles to the
direction the aircraft or spacecraft is traveling.
Generally, objects that trend (or strike) in a
direction that is orthogonal (perpendicular) to the
range or look direction are enhanced much more
than those objects in the terrain that lie parallel
to the look direction.
Consequently, linear features that appear dark or are
imperceptible in a radar image using one look direction may
appear bright in another radar image with a different look
direction.
Range Direction
18. The incident angle (θ) is the angle between the radar
pulse of EMR and line perpendicular to the Earth’s
surface where it makes contact. When the
terrain is flat, the incident angle (θ) is the
complement (θ = 90 - g) of the depression angle(γ). If the
terrain is sloped, there is no
relationship between depression angle and
incident angle. The incident angle best describes the
relationship between the radar beam and surface slope.
• Many mathematical radar studies assume the terrain surface
is flat (horizontal) therefore, the incident angle is assumed to
be the complement of the depression angle.
19. Unpolarized energy vibrates in all possible
directions perpendicular to the direction of
travel.
• Radar antennas send and receive polarized
energy. This means that the pulse of energy
is filtered so that its electrical wave
vibrations are only in a single plane that is
perpendicular to the direction of travel.
The pulse of electromagnetic energy sent out
by the antenna may be vertically or horizontally
polarized.
20. It is possible to:
• send vertically polarized energy and receive only
vertically polarized energy (designated VV),
• send horizontal and receive horizontally
polarized energy (HH),
• send horizontal and receive vertically polarized
energy (HV), or
• send vertical and receive horizontally polarized
energy (VH).
• HH and VV configurations produce
like-polarized radar imagery.
• HV and VH configurations produce
cross-polarized imagery.
21. RADAR Resolution
To determine the spatial resolution at any point
in a radar image, it is necessary to compute the
resolution in two dimensions: the range and
azimuth resolutions.
Radar is in effect a ranging device that measures the distance
to objects in the terrain by means of sending out and receiving
pulses of active microwave energy.
The range resolution in the across-track
direction is proportional to the length of the
microwave pulse.
The shorter the pulse length, the finer the range
resolution. Pulse length is a function of the speed of
light (c) multiplied by the duration of the transmission
(t).
22. Range Resolution
The range resolution (Rr) at any point between the near
and far-range of the illuminated strip can be computed if
the depression angle (γ) of the sensor at that location
and the pulse length (τ) are known.
It is possible to convert pulse length into distance by
multiplying it times the speed of light (c = 3 x 10⁸ m sec-
1). The resulting
distance is measured in the slant-range previously
discussed. Because we want to know the range resolution
in the ground-range (not the slant-range) it is necessary
to convert slant-range to ground-range by dividing the
slant-range distance by the cosine of the depression angle
(γ). Therefore, the equation for
computing the range resolution is:
____τ x c______
Rr = 2 cos γ
23. To know both the length and width of the
resolution element, we must also
compute the width of the resolution
element in the direction the aircraft or
spacecraft is flying — the azimuth
direction.
Azimuth
Resolution
Azimuth resolution (Ra) is
determined by computing the
width of the terrain strip that is
illuminated by the radar
beam.
24. • Real aperture active microwave radars produce a lobe shaped
beam which is narrower in the near-range and
spreads out in the far-range.
Basically, the angular beam width is directly proportional
to the wavelength of the transmitted pulse of energy, i.e.,
the longer the wavelength, the wider the beam width, and
the shorter the wavelength, the narrower the beam width.
Therefore, in real aperture (brute force) radars a shorter
wavelength pulse will result in improved azimuth
resolution.
Unfortunately, the shorter the wavelength, the poorer the
atmospheric and vegetation penetration capability.
25. Fortunately, the beam width is also inversely
proportional to antenna length (L).
This means that the longer the radar antenna,
the narrower the beam width and the higher
the azimuth resolution. The relationship
between wavelength (λ) and antenna length
(L) is summarized below, which can be used to
compute the azimuth resolution:
Ra = S x λ
L
where S is the slant-range distance to the
point of interest.
26. GEOMETRIC DISTORTIONS
The radar is fundamentally a distance measuring device (i.e. measuring
range). Slant-range scale distortion occurs because the radar is
measuring the distance to features in slant-range rather than the true
horizontal distance along the ground. This results in a varying image
scale, moving from near to far range. Although targets A1 and B1 are
the same size on the ground, their apparent dimensions in slant range
(A2 and B2) are different. This causes targets in the near range to
appear compressed relative to the far range. Using trigonometry,
ground-range distance can be calculated from the slant-range distance
and platform altitude to convert to the proper ground-range format.
27. Similar to the distortions encountered when using cameras and scanners,
radar images are also subject to geometric distortions due to relief
displacement.
Radar foreshortening and layover are two consequences which result from
relief displacement.
Foreshortening
28. Foreshortening
When the radar beam reaches the base of a tall feature tilted towards the
radar (e.g. a mountain) before it reaches the top foreshortening will occur.
Again, because the radar measures distance in slant-range, the slope (A to
B) will appear compressed and the length of the slope will be represented
incorrectly (A' to B'). Depending on the angle of the hillside or mountain
slope in relation to the incidence angle of the radar beam, the severity of
foreshortening will vary. Maximum foreshortening occurs when the radar
beam is perpendicular to the slope such that the slope, the base, and the
top are imaged simultaneously (C to D). The length of the slope will be
reduced to an effective length of zero in slant range (C'D').
29. Layover
Layover occurs when the radar beam reaches the top of a tall feature
(B) before it reaches the base (A). The return signal from the top of the
feature will be received before the signal from the bottom. As a result,
the top of the feature is displaced towards the radar from its true
position on the ground, and "lays over" the base of the feature (B' to A').
Layover effects on a radar image look very similar to effects due to
foreshortening. As with foreshortening, layover is most severe for small
incidence angles, at the near range of a swath, and in mountainous
terrain.
30. Shadowing
Both foreshortening and layover result in radar shadow. Radar shadow occurs when
the radar beam is not able to illuminate the ground surface. Shadows occur in the
down range dimension (i.e. towards the far range), behind vertical features or
slopes with steep sides. Since the radar beam does not illuminate the surface,
shadowed regions will appear dark on an image as no energy is available to be
backscattered. As incidence angle increases from near to far range, so will shadow
effects as the radar beam looks more and more obliquely at the surface. This
image illustrates radar shadow effects on the right side of the hillsides which are
being illuminated from the left.
Red surfaces are completely in shadow. Black areas in
image are shadowed and contain no information.
31. Did you know?
"...look to the left, look to the right, stand up, sit down..."
...although a radar's side-looking geometry can result in several image effects such as
foreshortening, layover, and shadow, this geometry is exactly what makes radar so useful for terrain
analysis. These effects, if not too severe, actually enhance the visual appearance of relief and
terrain structure, making radar imagery excellent for applications such as topographic mapping and
identifying geologic structure.
32. RADAR Image Speckle
Speckle is a grainy salt-and-pepper pattern in
radar imagery present due to the coherent
nature of the radar wave, which causes
random constructive and destructive
interference, and hence random bright and
dark areas in a radar image.
The speckle can be reduced by processing separate portions of an
aperture and recombining these portions so that interference does not
occur. This process, called multiple looks or non-coherent integration,
produces a more pleasing appearance, and in some cases may aid in
interpretation of the image but at a cost of degraded resolution.