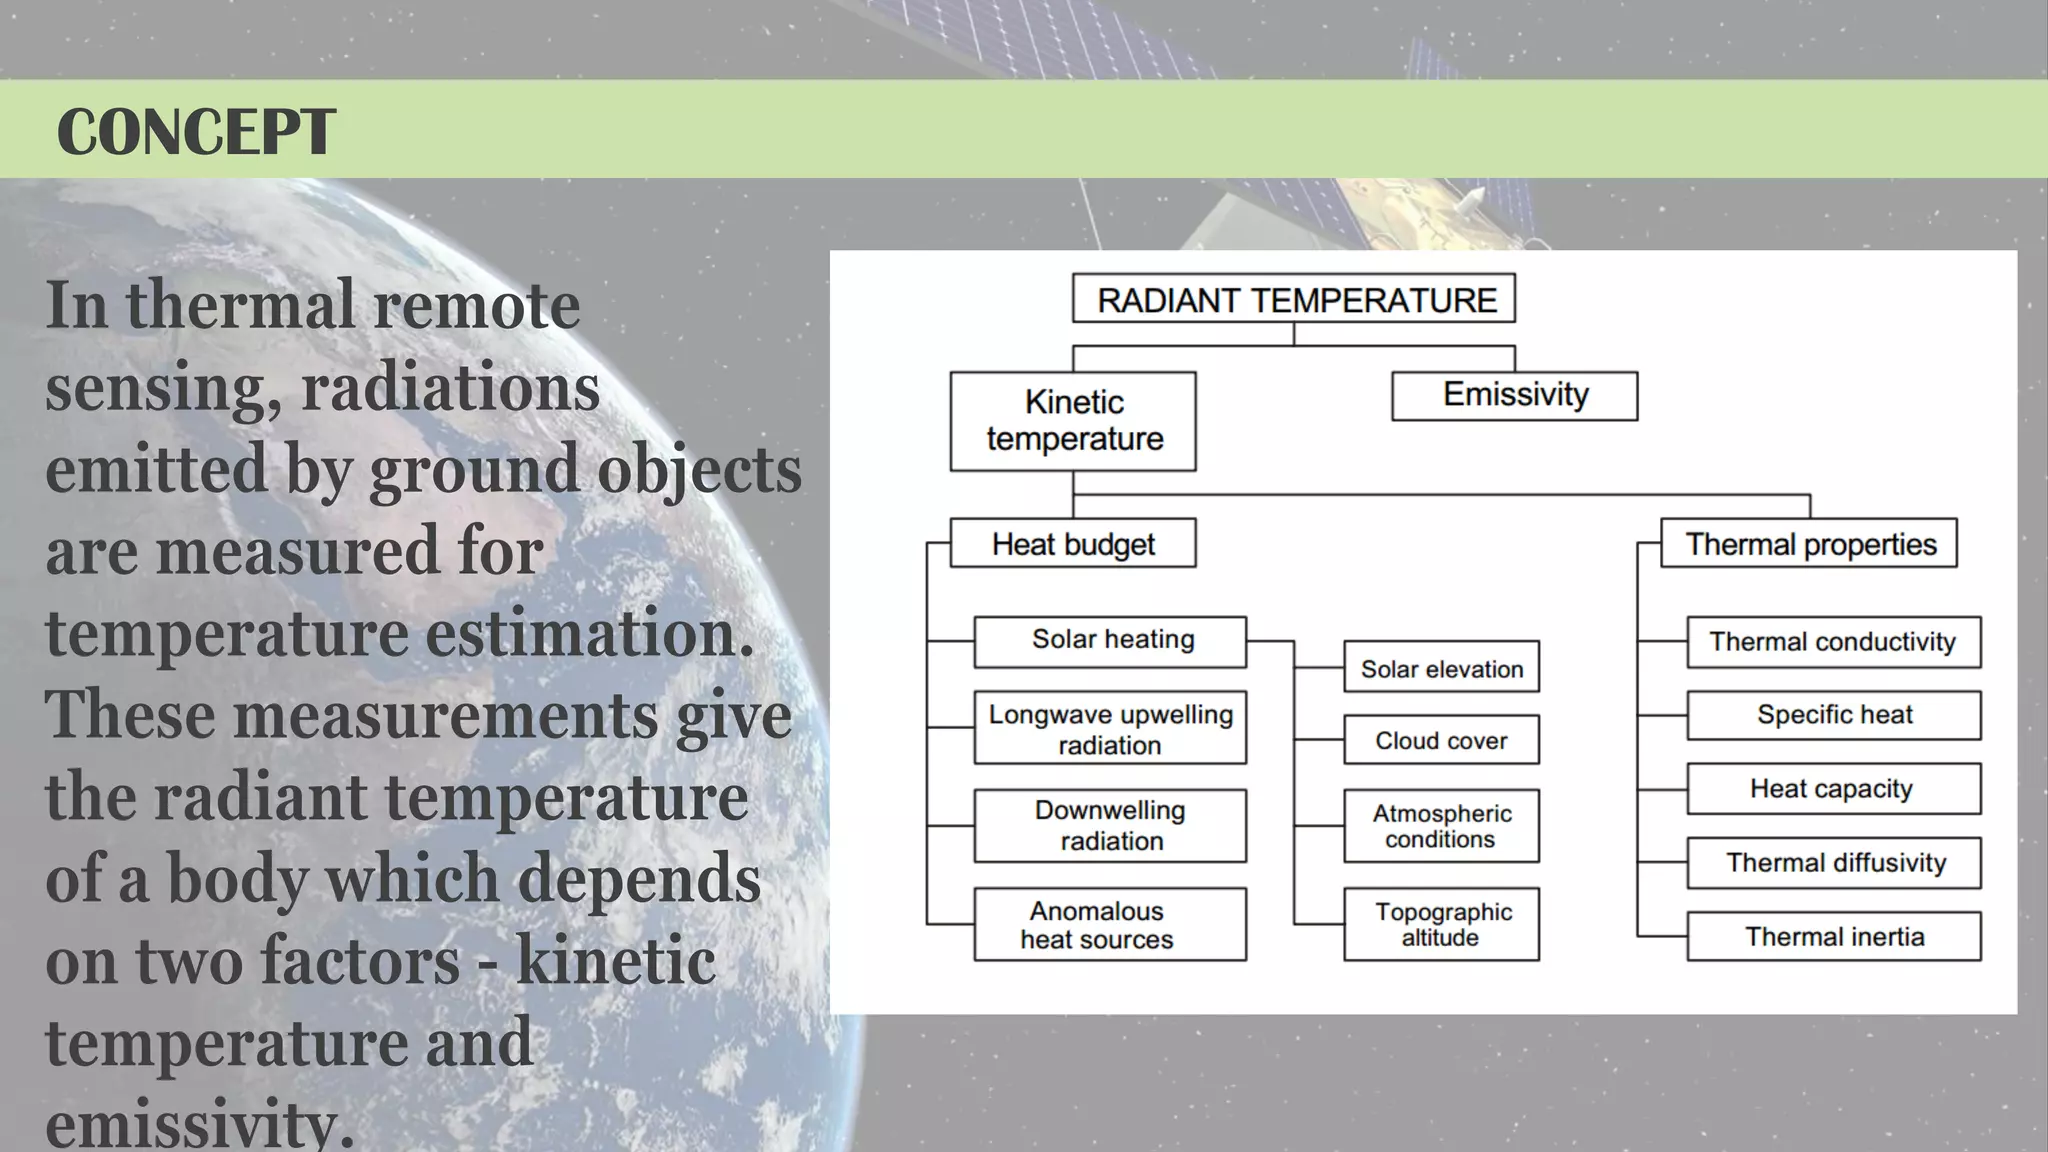
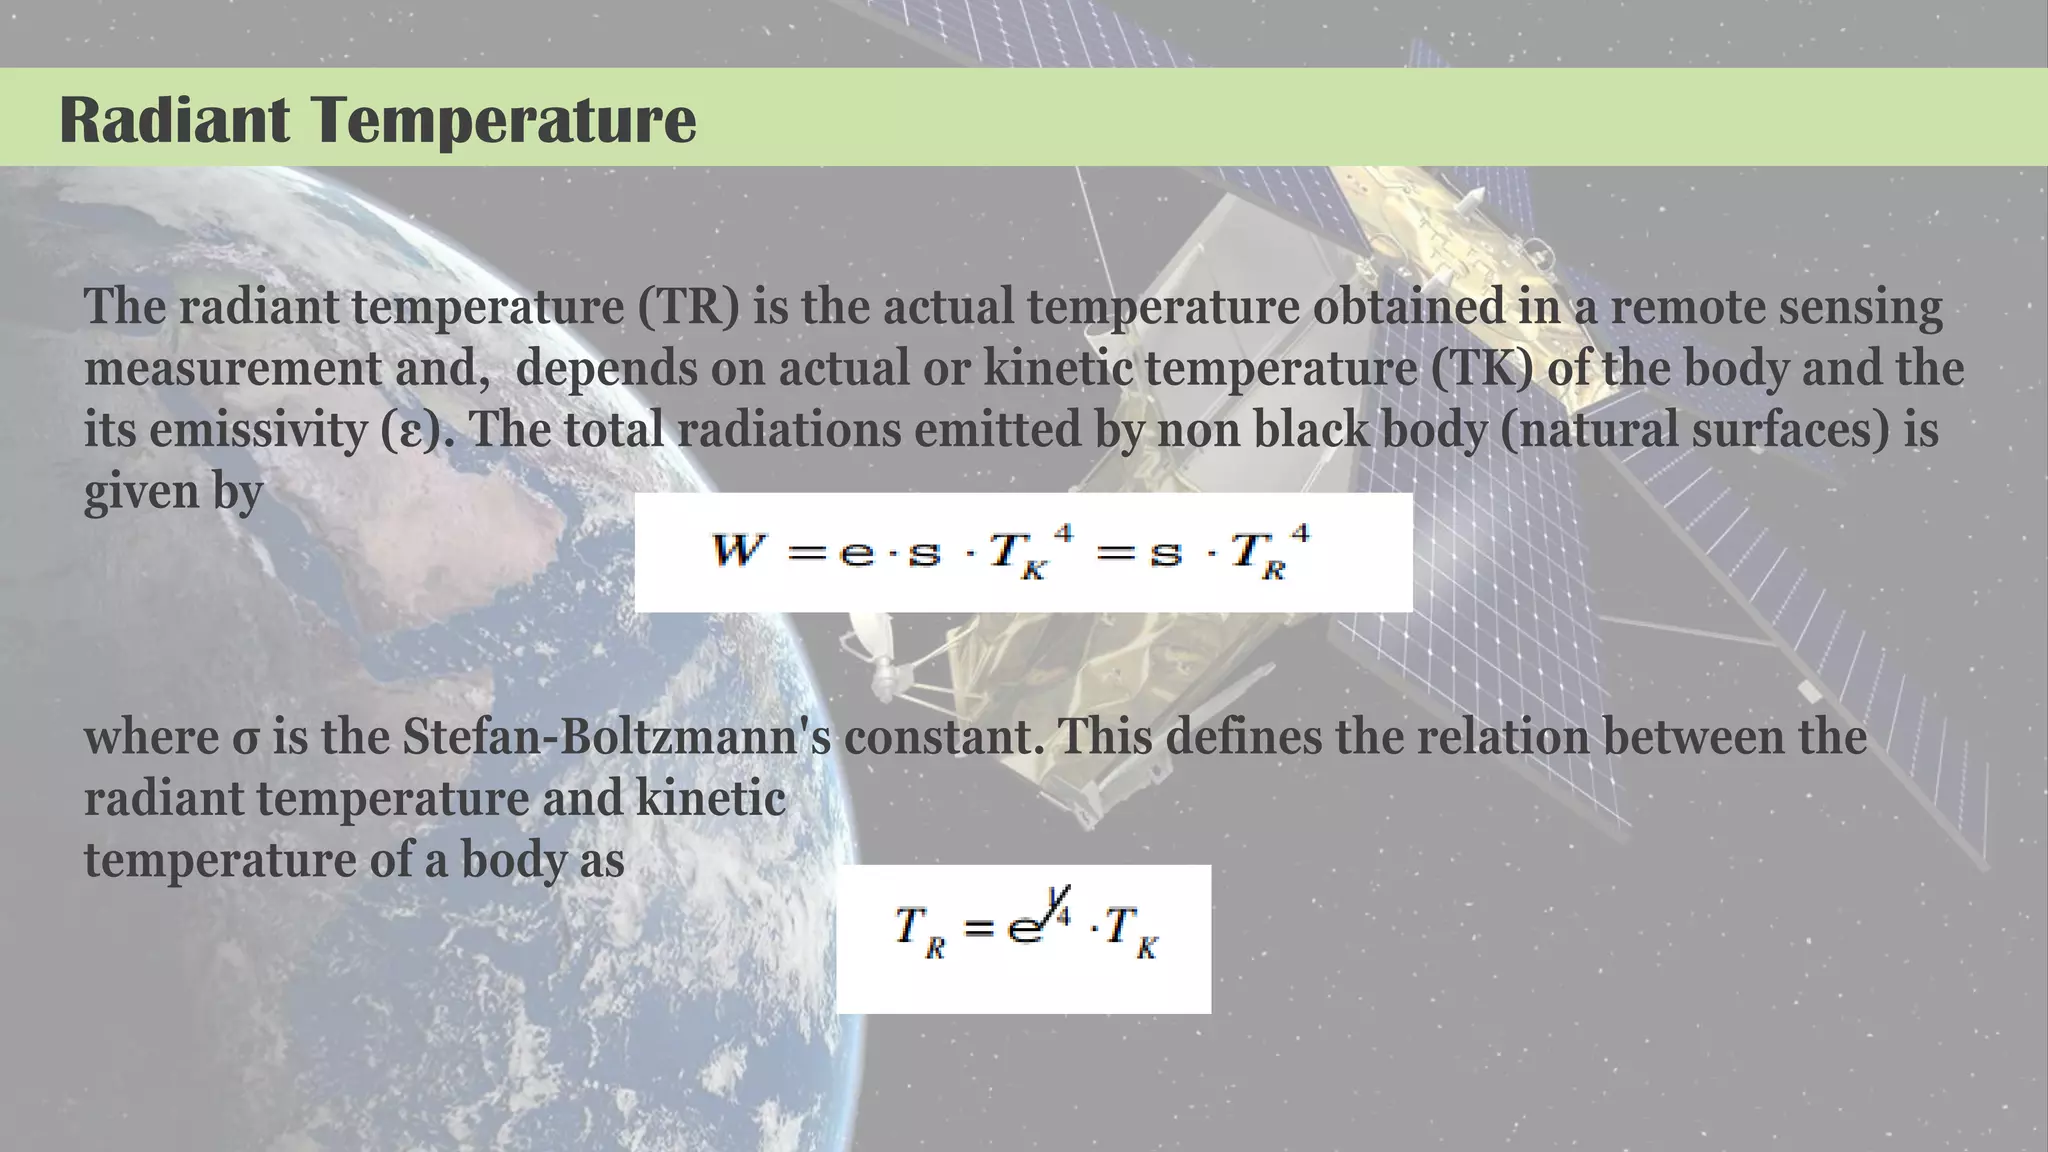
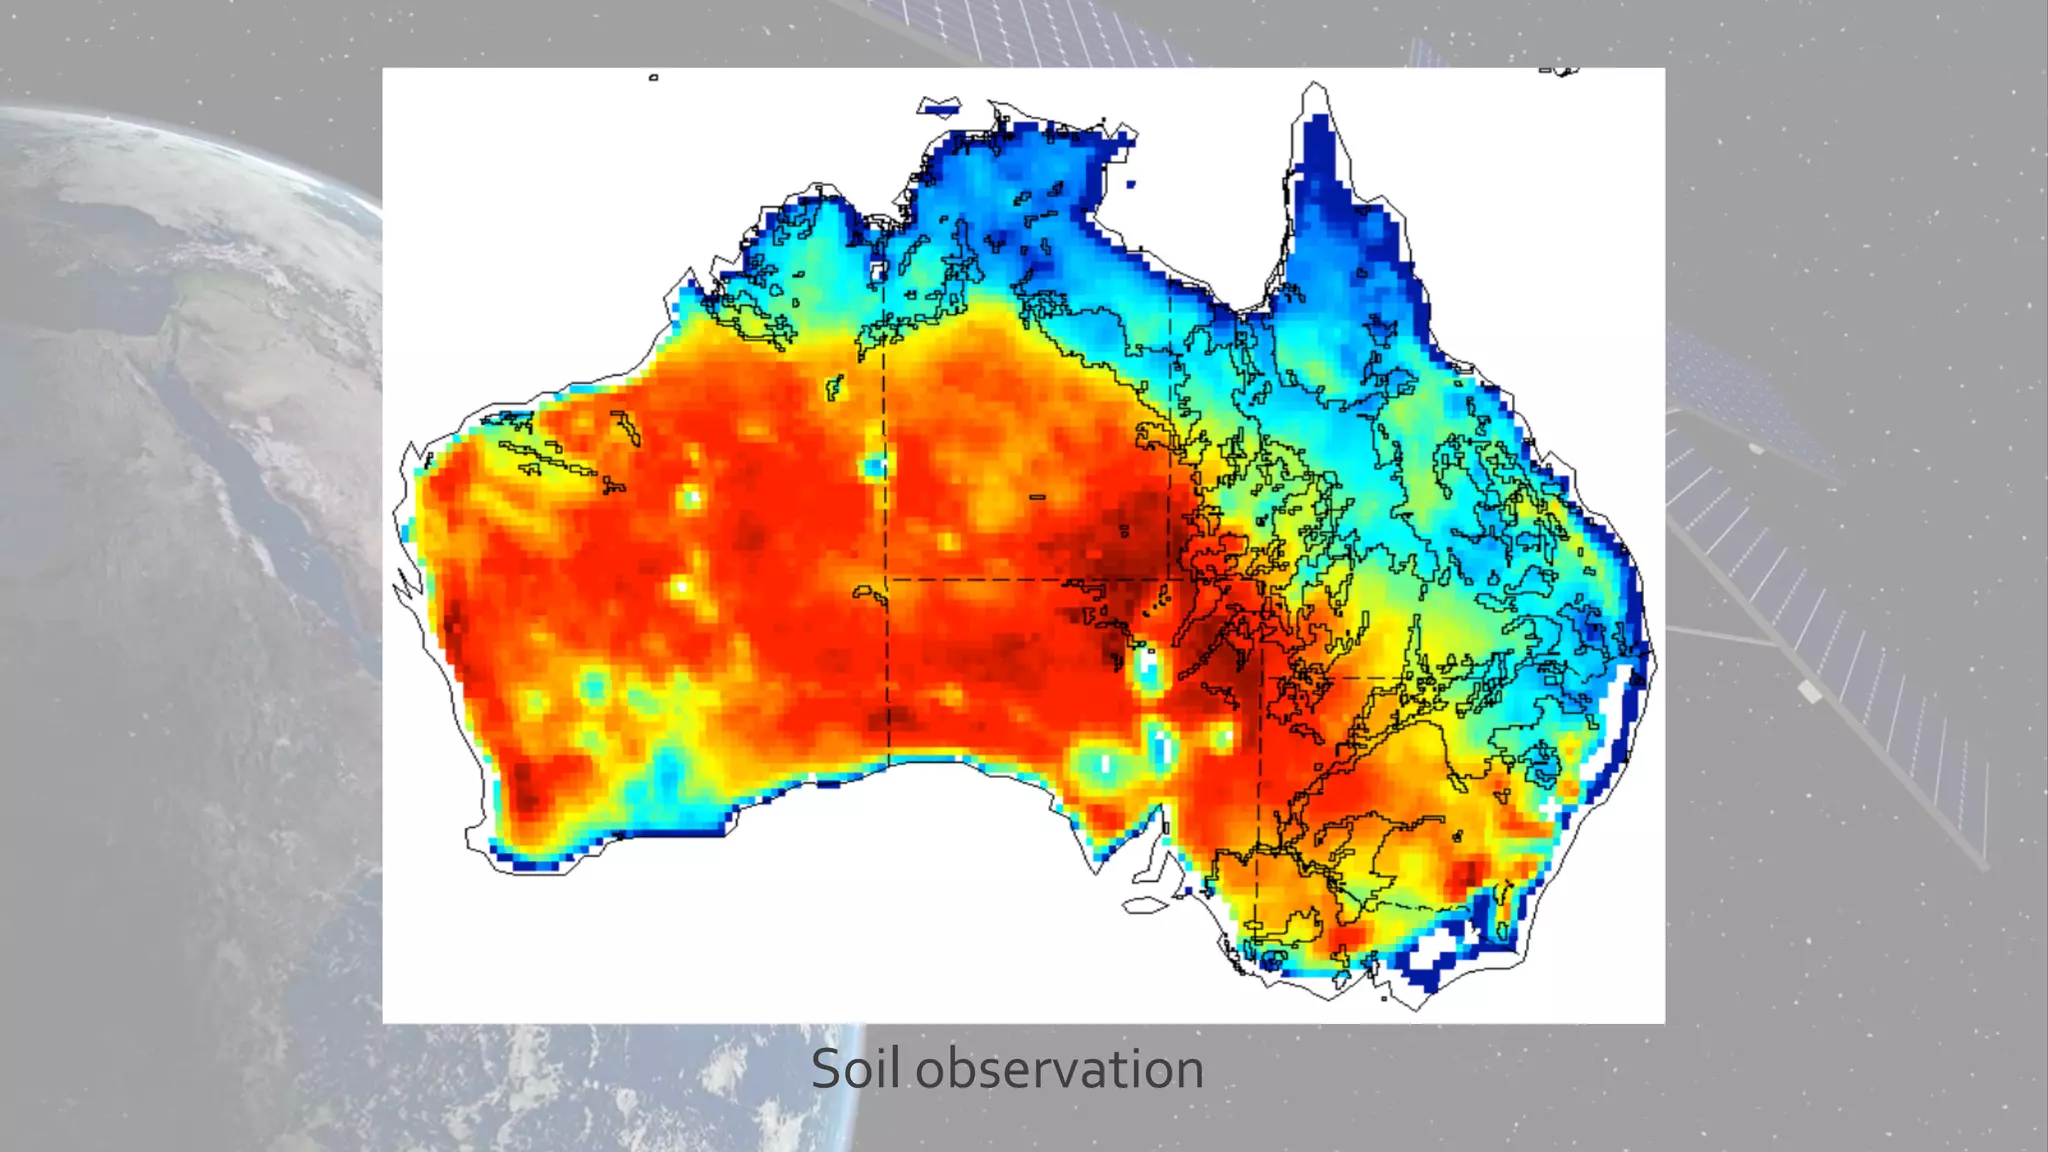
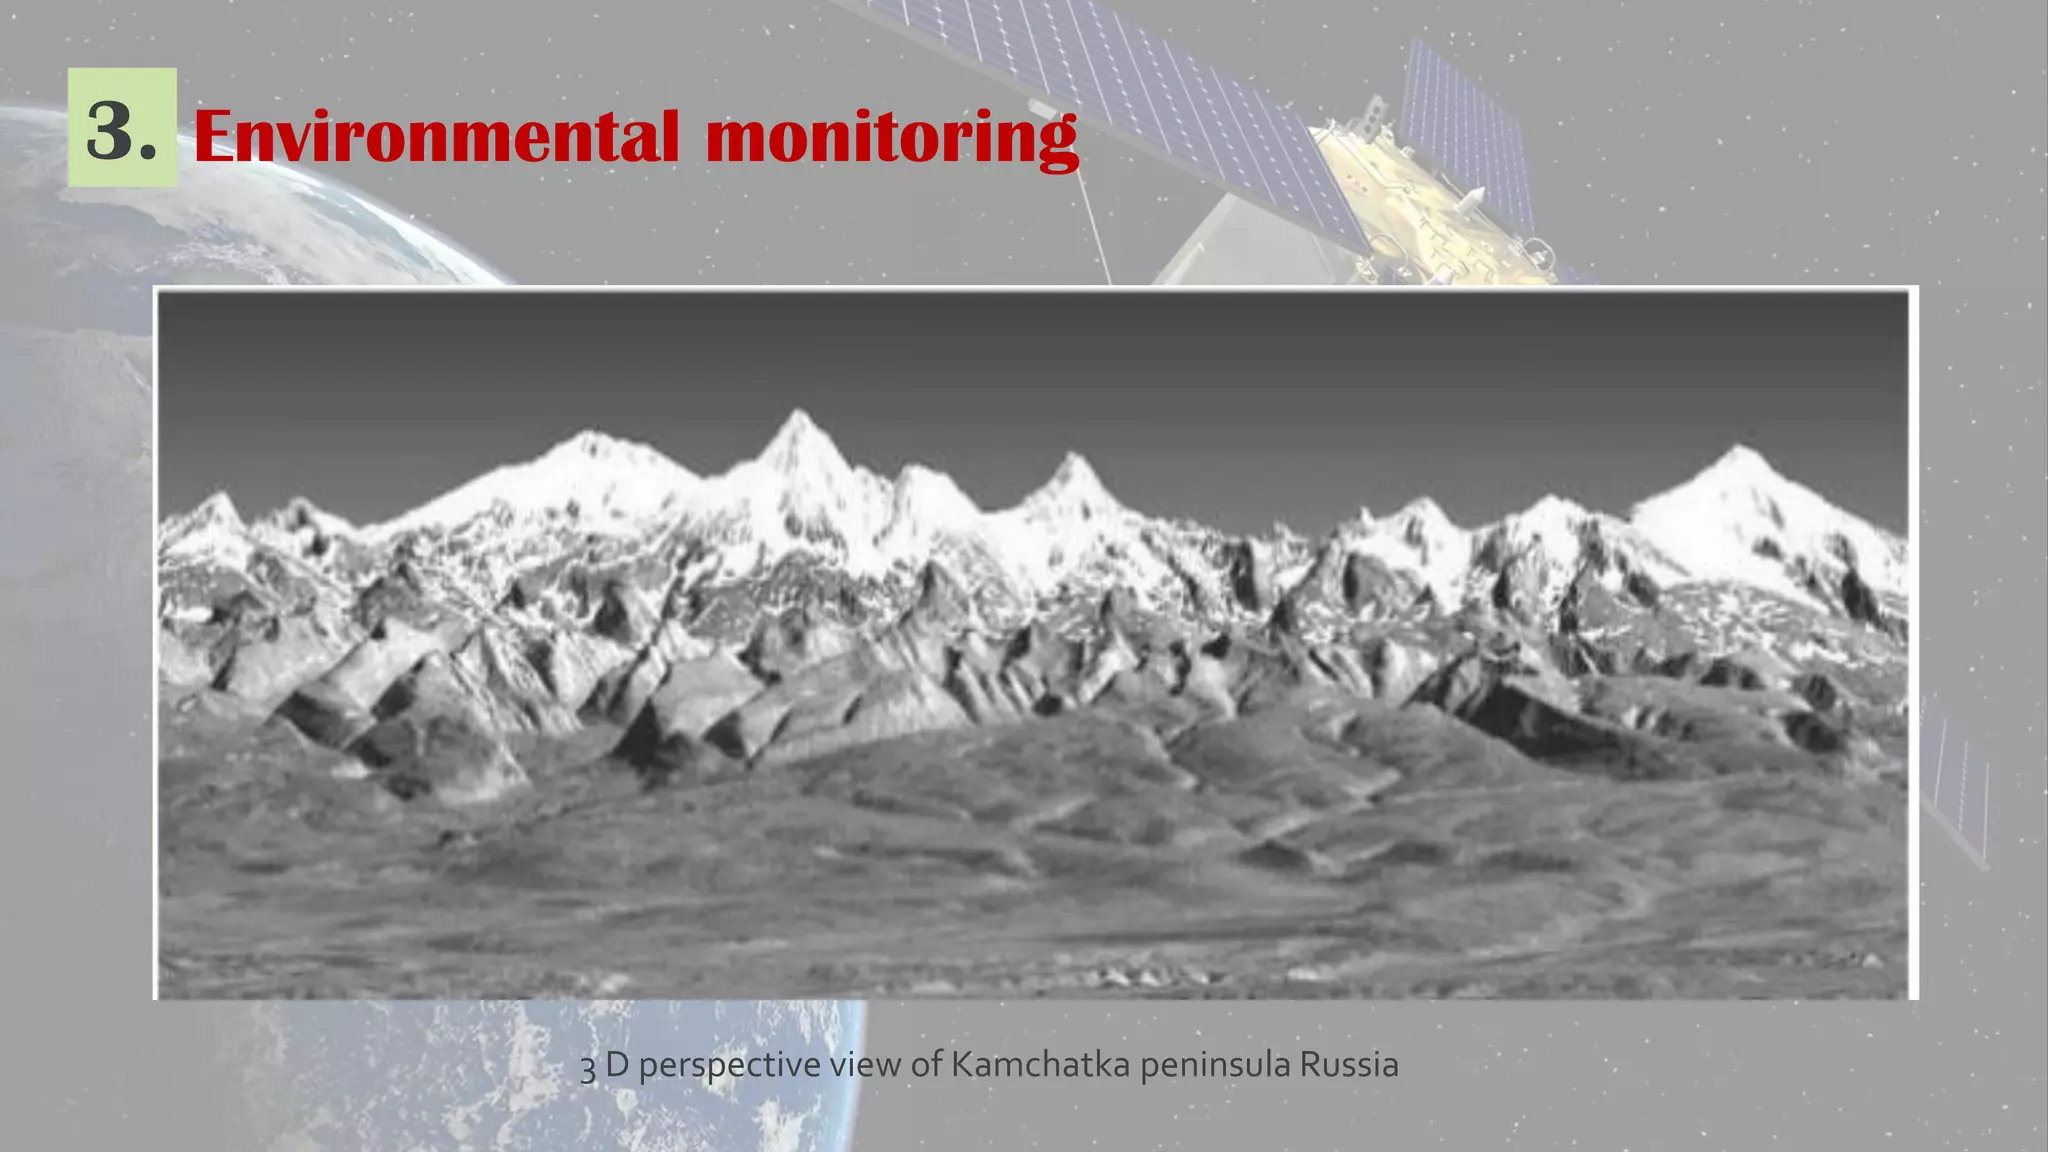
What is Remote Sensing?
Process of Remote Sensing
Electromagnetic Radiations
Electromagnetic Spectrum
Interaction with Atmosphere
Radiations-Target Interactions
Passive Vs Active Sensing
What is Remote Sensing?
Process of Remote Sensing
Electromagnetic Radiations
Electromagnetic Spectrum
Interaction with Atmosphere
Radiations-Target Interactions
Passive Vs Active Sensing
A remote sensing system uses a detector to sense the reflected or emitted energy from the earth's surface, perhaps modified by the intervening atmosphere. The sensor can be on a satellite, aircraft, or drone. The sensor turns the energy into a voltage, which an analog to digital converter turns into a single integer value (called the Digital Number, or DN) for the energy. Alternatively a digital detector can store the DN directly. We can then display this value with an appropriate color to build up an image of the region sensed by the system. The DN represents the energy sensed by the sensor in a particular part of the electromagnetic spectrum, emitted or reflected from a particular region. The principles can also be applied to sonar imagery, especially useful in water where sound penetrates readily whereas electromagnetic energy attenuates rapidly.
Definitions,
Remote sensing systems can be active or passive: active systems put out their own source of energy (a large "flash bulb") whereas passive systems use solar energy reflected from the surface or thermal energy emitted by the surface. Active systems can achieve higher resolution.
Satellite resolution considers four things: spatial, spectral, radiometric, and temporal resolution.
Electromagnetic radiation and the atmosphere control many aspects of a remote sensing system.
Satellite orbits determine many characteristics of the imagery, what the satellite sees, and how often it revisits an area.
The signal to noise ratio is important for the design of remote sensing systems.
Satellite band tradeoffs.
Interpreting satellite reflectance patterns and images uses various statistical measures to assess surface properties in the image.
The colors used on the display are gray shading for single bands, and RGB for multi-band composites. We can also perform image merge and sharpening to combine the advantages of both panchromatic (higher spatial resolution) and color imagery (better differentiation of surface materials).
Keys for image analysis
Hyperspectral imagery
Spectral reflectance library--different materials reflect radiation differently
The presentation introduces remote sensing technology and how it is used in studying atmospheric aerosols. Remote Sensing technology uses the optical property of aerosols to detect the presence and the type of aerosol. The type or the characteristics of an aerosol is determined by seven factors which are interpreted from the satellite image. The satellite image is retrieved from geosynchronous and polar satellites, of which the latter is preferred for aerosol applications.
In addition, features and terminologies associated with remote sensing, satellite and aerosol optical properties are discussed. This project emphasizes on an interactive material that is best supplemented with lecture video. It is not designed to be conventional lecture slide. Point to note: the question mark appearing in bottom of the slides indicates the author raised a question during the lecture.
This presentation was delivered in coming-of-age lecture style, in contrast to old-school conventional style. This presentation stimulates audiences to think and act than a banal display of abstract data. The lecture videos can be found at:
[1] Part-1/2 (52 minutes): https://youtu.be/-O_mYoeg-us
[2] Part-2/2 (51 minutes): https://youtu.be/IhHHHZYcY0o
This presentation is done as a part of graduate course titled Aerosol Mechanics in Spring 2016. The author was pursuing MS in Environmental Engineering Sciences at University of Florida during the making of this project.
The presentation looks into the principle and uses of multi-spectral imaging (MSI) systems. Hyperspectral imaging, an extention of MSI was also covered herein. Moreover, the components of the system were highlighted with special attention paid to the detector (or image sensor). Finally, a few application in the Bioresource Engineering domain was covered
Monahan - Perception & Interaction With Environmental Resourcesgabriellebastien
Green Exchange - Harvard Extension Environmental Club - April 15, 2015
How do perception and culture influence the way we interact with environmental resources? Presenter Kyle Monahan explores this question by analyzing two case studies: the ceramic water filter technology and its interaction with the cultural definition of clean water, and the disparities of water use in China on both the local (cognitive perception) and the provincial (social perception) levels. Kyle is a PhD student at Tufts University in Environmental Health Engineering, a Water Diplomacy NSF IGERT Fellow and has extensive research experience in sustainable water treatments.
hyperspectral remote sensing and its geological applicationsabhijeet_banerjee
this is an introductory presentation on hyperspectral remote sensing, which essential deals with the distinguishing features, imaging spectrometers and its types, and some of the geological applications of hyperspectral remote sensing.
This paper reviews in brief about solar radiation and pyranometer to measure the same.In order
to assess the availability of solar energy arriving on the earth, measurement of solar radiation at some locations
is essential. From measurements, empirical models are developed to predict the availability of solar energy at
other locations.[8] The common, commercial pyranometer design uses a thermopile, setting up a voltage
proportional to the radiation based on temperature readings. This necessitates temperature
compensation.Using photovoltaic silicon cells, instead of thermocouples, the global irradiance as well as its
direct and diffuse components to great accuracy can be measured. Pyranometer is basically just comprised of
two solar cells and a voltage amplifier.
This is all about remote sensing. Remote sensing is the acquisition of information about an object or phenomenon without making physical contact with the object and thus in contrast to on-site observation, especially the Earth.Remote sensing is the process of detecting and monitoring the physical characteristics of an area by measuring its reflected and emitted radiation at a distance from the targeted area. Special cameras collect remotely sensed imagesof the Earth, which help researchers "sense" things about the Earth.
Geothermal exploration using remote sensing techniquesSepideh Abadpour
On these slides, I have spoken about applications of remote sensing in geothermal exploration. Unfortunately I've done it when I was pursuing my bachelors, so the citations are not correct but it will give you some ideas.
Any feedback is welcome
physics of remote sensing,ideal remote sensing,swath,platform,sensor,orbit and its characteristics,electromagnetic radiations,EMR solar radiations and its application,shortwave and long waves,spectrul reflectance curve, resolution AND multi concept,FCC,
Instruments for solar radiation measurement
Empirical equation for prediction of availability of solar radiation
Radiation on tilted surface
Types of solar collectors
kushsshah.blogspot.com
This presentation covers the principles of remote sensing and reflectance profiling and explains how the concept of spectral signature is utilized in entomology research
How to Split Bills in the Odoo 17 POS ModuleCeline George
Bills have a main role in point of sale procedure. It will help to track sales, handling payments and giving receipts to customers. Bill splitting also has an important role in POS. For example, If some friends come together for dinner and if they want to divide the bill then it is possible by POS bill splitting. This slide will show how to split bills in odoo 17 POS.
Unit 8 - Information and Communication Technology (Paper I).pdfThiyagu K
This slides describes the basic concepts of ICT, basics of Email, Emerging Technology and Digital Initiatives in Education. This presentations aligns with the UGC Paper I syllabus.
Palestine last event orientationfvgnh .pptxRaedMohamed3
An EFL lesson about the current events in Palestine. It is intended to be for intermediate students who wish to increase their listening skills through a short lesson in power point.
How to Make a Field invisible in Odoo 17Celine George
It is possible to hide or invisible some fields in odoo. Commonly using “invisible” attribute in the field definition to invisible the fields. This slide will show how to make a field invisible in odoo 17.
The French Revolution, which began in 1789, was a period of radical social and political upheaval in France. It marked the decline of absolute monarchies, the rise of secular and democratic republics, and the eventual rise of Napoleon Bonaparte. This revolutionary period is crucial in understanding the transition from feudalism to modernity in Europe.
For more information, visit-www.vavaclasses.com
Read| The latest issue of The Challenger is here! We are thrilled to announce that our school paper has qualified for the NATIONAL SCHOOLS PRESS CONFERENCE (NSPC) 2024. Thank you for your unwavering support and trust. Dive into the stories that made us stand out!
The Art Pastor's Guide to Sabbath | Steve ThomasonSteve Thomason
What is the purpose of the Sabbath Law in the Torah. It is interesting to compare how the context of the law shifts from Exodus to Deuteronomy. Who gets to rest, and why?
Instructions for Submissions thorugh G- Classroom.pptxJheel Barad
This presentation provides a briefing on how to upload submissions and documents in Google Classroom. It was prepared as part of an orientation for new Sainik School in-service teacher trainees. As a training officer, my goal is to ensure that you are comfortable and proficient with this essential tool for managing assignments and fostering student engagement.
This is a presentation by Dada Robert in a Your Skill Boost masterclass organised by the Excellence Foundation for South Sudan (EFSS) on Saturday, the 25th and Sunday, the 26th of May 2024.
He discussed the concept of quality improvement, emphasizing its applicability to various aspects of life, including personal, project, and program improvements. He defined quality as doing the right thing at the right time in the right way to achieve the best possible results and discussed the concept of the "gap" between what we know and what we do, and how this gap represents the areas we need to improve. He explained the scientific approach to quality improvement, which involves systematic performance analysis, testing and learning, and implementing change ideas. He also highlighted the importance of client focus and a team approach to quality improvement.
Students, digital devices and success - Andreas Schleicher - 27 May 2024..pptxEduSkills OECD
Andreas Schleicher presents at the OECD webinar ‘Digital devices in schools: detrimental distraction or secret to success?’ on 27 May 2024. The presentation was based on findings from PISA 2022 results and the webinar helped launch the PISA in Focus ‘Managing screen time: How to protect and equip students against distraction’ https://www.oecd-ilibrary.org/education/managing-screen-time_7c225af4-en and the OECD Education Policy Perspective ‘Students, digital devices and success’ can be found here - https://oe.cd/il/5yV
2. Thermal remote sensing.
What is it??
Thermal remote sensing is the branch of remote sensing that deals with the
acquisition, processing and interpretation of data acquired primarily in the thermal
infrared (TIR) region of the electromagnetic (EM) spectrum. In thermal remote
sensing we measure the radiations 'emitted' from the surface of the target, as
opposed to optical remote sensing where we measure the radiations 'reflected' by
the target under consideration.
In the TIR region of the EM spectrum, the radiations emitted by the earth due to
its thermal state are far more intense than the solar reflected radiations and
therefore, sensors operating in this wavelength region primarily detect thermal
radiative properties of the ground material.
3.
4. CONCEPT
In thermal remote
sensing, radiations
emitted by ground objects
are measured for
temperature estimation.
These measurements give
the radiant temperature
of a body which depends
on two factors - kinetic
temperature and
emissivity.
5. Wavelength or spectral range
The infrared portion of the electromagnetic spectrum is usually considered
to be from 0.7 to 1,000 µm. Within this infrared portion, there are various
nomenclatures and little consensus among various groups to define the sub
boundaries. In terrestrial remote sensing the region of 3 to 35 µm is
popularly called thermal-infrared.
Within the thermal infrared an excellent atmospheric window lies between
8-14 µm wavelength. Poorer windows lie in 3-5 µm and 17-25 µm.
Interpretation of the data in 3-5 µm is complicated due to overlap with
solar reflection in day imagery and 17-25 µm region is still not well
investigated. Thus 8-14 µm region has been of greatest interest for thermal
remote sensing.
6. Spectral Emissivity and Kinetic Temperature
Thermal remote sensing exploits the fact that everything above absolute
zero (0 K or -273.15 °C or –459 °F) emits radiation in the infrared range of
the electromagnetic spectrum. How much energy is radiated, and at which
wavelengths, depends on the emissivity of the surface and on its kinetic
temperature. Emissivity is the emitting ability of a real material compared
to that of a black body , and is a spectral property that varies with
composition of material and geometric configuration of the surface.
Emissivity denoted by epsilon (ε) is a ratio and varies between 0 and 1. For
most natural materials, it ranges between 0.7 and 0.95. Kinetic temperature
is the surface temperature of a body/ground and is a measure of the amount
of heat energy contained in it . It is measured in different units, such as in
Kelvin (K); degrees Centigrade (°C); degrees Fahrenheit (°F).
7. Radiant Temperature
The radiant temperature (TR) is the actual temperature obtained in a remote sensing
measurement and, depends on actual or kinetic temperature (TK) of the body and the
its emissivity (ε). The total radiations emitted by non black body (natural surfaces) is
given by
where σ is the Stefan-Boltzmann's constant. This defines the relation between the
radiant temperature and kinetic
temperature of a body as
8. Issues
Due to the fundamental difference between remote sensing in the thermal
infrared region and the other regions of the EM spectrum, there are some
issues peculiar and pertinent for thermal remote sensing.
1. Data acquisition: Modes and platforms
Active versus passive mode: Most of the thermal sensors acquire data passively, i.e. they
measure the radiations emitted naturally by the target/ground. Data can also be acquired
in theTIR actively deploying laser beams (LIDAR).
Broad band versus multispectral mode: For the broad band thermal sensing, in general
the 8 to 14 µm atmospheric window is utilized. However, some space borne thermal
sensors such as LandsatThematic Mapper Band 6 operate in the wavelength range of 10.4
to 12.6 µm to avoid the ozone absorption peak which is located at 9.6 µm.
9. Daytime versus night-time acquisition: Thermal data can be acquired during the day
and during the night. For some applications it is useful to have data from both the times.
However, for many applications night-time or more specifically pre-dawn images are
preferred as during this time the effect of differential solar heating is the minimal.
Spatial resolution and geometric correction2.
As the sensors measure emitted radiations, there is also a heating effect and constant
cooling of the sensors is required.This poses a physical limit to the measuring capability
of the sensors and therefore the spatial resolution of the acquired data.The coarse
spatial resolution, specially of satellite borne broad band thermal data poses some
additional problems in geometrically registering it to other data, specially when the
latter have much higher spatial resolution. Identification of corresponding reliable
control points on data sets with such wide differences in spatial resolution is not only
difficult but when tried may result in unacceptable transformation results.
10. APPLICATIONS
• Identification of geological units and structures
• Soil moisture studies
• Hydrology
• Coastal zones
• Volcanology
• Forest fires
• Coal fires
• Seismology
• Environmental modelling
• Meteorology
• Medical sciences
• Vetenary sciences
• Intelligence / military applications
• Heat loss from buildings
• Others
11. Environmental applications
1. urban climates
The surface temperature is of prime importance to the study of urban climatology. It
modulates the air temperature of the lowest layers of the urban atmosphere, is central
to the energy balance of the surface, helps to determine the internal climates of
buildings and affects the energy exchanges that affect the comfort of city dwellers.
Surface and atmospheric modifications due to urbanization generally lead to a modified
thermal climate that is warmer than the surrounding non-urbanized areas, particularly
at night. This phenomenon is the urban heat island (UHI).
With the advent of thermal remote sensing technology, remote observation of UHIs
became
possible using satellite and aircraft platforms and has provided new avenues for the
observation of UHIs and the study of their causation through the combination of
thermal remote sensing and urban micrometeorology.
12.
13.
14. 2. Soil Properties
The feasibility of the thermal infrared (TIR) wavelength region (within the
atmospheric window between 8 and 11.5 μm) together with the traditional solar
reflective wavelengths is used for quantifying soil properties for coarse-textured soils.
Soil properties are predicted using multivariate analysis techniques (partial least
square regression). The spectra were resampled to operational imaging spectroscopy
sensor characteristics (HyMAP and TASI-600). To assess the relevance of specific
wavelength regions in the prediction, the drivers of the PLS models were interpreted
with respect to the spectral characteristics of the soils’ chemical and physical
composition
It can also be used to measure soil moisture.