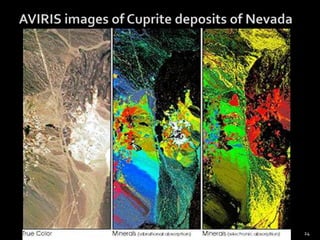
HYPERSPECTRAL REMOTE SENSING& itsGEOLOGICAL APPLICATIONS1
Hyperspectral sensors, or imaging spectrometers, are instruments that acquire images in many, very narrow, contiguous spectral bands throughout the visible, near-IR, mid-IR, and thermal IR portions of the spectrum.
These systems typically collect 200 or more bands of data, which enables the construction of an effectively continuous reflectance or emittance spectrum for every pixel in the scene.
These systems can discriminate among earth surface features that have diagnostic absorption and reflection characteristics over narrow wavelength intervals that are “lost” within the relatively coarse bandwidths of conventional multispectral scanners.2What is Hyperspectral Remote Sensing???
A hyperspectral cubeCertain objects leave unique 'fingerprints' across the electromagnetic spectrum.
These 'fingerprints' are known as spectral signatures and enable identification of the materials that make up a scanned object. For example, having the spectral signature for oil helps mineralogists find new oil fields.3
Hyperspectral versus multispectral remote sensingHyperspectral Imaging is related to multispectral imaging. The distinction between hyperspectral and multispectral is usually defined as the number of spectral bands.
Multispectral data contains from tens to hundreds of bands. Hyperspectral data contains hundreds to thousands of bands.
However, hyperspectral imaging may be best defined by the manner in which the data is collected. Hyperspectral data is a set of contiguous bands (usually by one sensor). Multispectral is a set of optimally chosen spectral bands that are typically not contiguous and can be collected from multiple sensors.4
5
Acquisition and processing of hyperspectral data (imaging spectroscopy)Hyperspectral sensors collect information as a set of 'images'.
Each image represents a range of the electromagnetic spectrum and is also known as a spectral band.
These 'images' are then combined and form a three dimensional hyperspectral cube for processing and analysis.
Hyperspectral cubes are generated from airborne sensors like the NASA’s Airborne Visible/Infrared Imaging Spectrometer (AVIRIS), or from satellites like NASA’s Hyperion.However, for many development and validation studies handheld sensors are used.6
7
continuedThe precision of these sensors is typically measured in spectral resolution, which is the width of each band of the spectrum that is captured.
 If the scanner picks up on a large number of fairly narrow frequency bands, it is possible to identify objects even if said objects are only captured in a handful of pixels.
However, spatial resolution is a factor in addition to spectral resolution. If the pixels are too large, then multiple objects are captured in the same pixel and become difficult to identify.
 If the pixels are too small, then the energy captured by each sensor-cell is low, and the decreased signal-to-noise ratio reduces the reliability of measured features.
MicroMSI, Opticks and Envi are three remote sensing applications that support the processing and analysis of hyperspectral data.8
Imaging SpectrometersAn imaging spectrometer is an instrument used in the field of imaging spectroscopy to acquire a spectrally-resolved image of an object or scene, often referred to as a datacube due to the three-dimensional representation of the data. The principle of operation is the same as that of the simple spectrometer, but special care is taken to avoid optical aberrations for better image quality.
Example imaging spectrometer types include: filtered camera, whiskbroom scanner, pushbroom scanner, integral field spectrograph (or related dimensional reformatting techniques), wedge imaging spectrometer, Fourier transform imaging spectrometer, computed tomography imaging spectrometer (CTIS), image replicating imaging spectrometer (IRIS), and coded aperture imaging spectrometer.9
AVIRIS (Airborne Visible/Infrared Imaging Spectrometer)
Number of bands : 224
Spectral coverage : 0.4-2.45 µm
Main objective : to identify, measure, and monitor constituents of the Earth's surface and atmosphere based on molecular absorption and particle scattering signatures.
Research with AVIRIS data is predominantly focused on understanding processes related to the global environment and climate change.10
11
MODIS (Moderate Resolution Imaging Spectrometer)
Number of bands : Thirty six
Spectral coverage : 0.415-14.240 µm
Main objective : to help improve our understanding of global dynamics and processes occurring on the land, in the oceans, and in the lower atmosphere.
MODIS is playing a vital role in the development of validated, global, interactive Earth system models able to predict global change accurately enough to assist policy makers in making sound decisions concerning the protection of our environment.12

hyperspectral remote sensing and its geological applications

  • 1.
    HYPERSPECTRAL REMOTE SENSING&itsGEOLOGICAL APPLICATIONS1
  • 2.
    Hyperspectral sensors, orimaging spectrometers, are instruments that acquire images in many, very narrow, contiguous spectral bands throughout the visible, near-IR, mid-IR, and thermal IR portions of the spectrum.
  • 3.
    These systems typicallycollect 200 or more bands of data, which enables the construction of an effectively continuous reflectance or emittance spectrum for every pixel in the scene.
  • 4.
    These systems candiscriminate among earth surface features that have diagnostic absorption and reflection characteristics over narrow wavelength intervals that are “lost” within the relatively coarse bandwidths of conventional multispectral scanners.2What is Hyperspectral Remote Sensing???
  • 5.
    A hyperspectral cubeCertainobjects leave unique 'fingerprints' across the electromagnetic spectrum.
  • 6.
    These 'fingerprints' areknown as spectral signatures and enable identification of the materials that make up a scanned object. For example, having the spectral signature for oil helps mineralogists find new oil fields.3
  • 7.
    Hyperspectral versus multispectralremote sensingHyperspectral Imaging is related to multispectral imaging. The distinction between hyperspectral and multispectral is usually defined as the number of spectral bands.
  • 8.
    Multispectral data containsfrom tens to hundreds of bands. Hyperspectral data contains hundreds to thousands of bands.
  • 9.
    However, hyperspectral imagingmay be best defined by the manner in which the data is collected. Hyperspectral data is a set of contiguous bands (usually by one sensor). Multispectral is a set of optimally chosen spectral bands that are typically not contiguous and can be collected from multiple sensors.4
  • 10.
  • 11.
    Acquisition and processingof hyperspectral data (imaging spectroscopy)Hyperspectral sensors collect information as a set of 'images'.
  • 12.
    Each image representsa range of the electromagnetic spectrum and is also known as a spectral band.
  • 13.
    These 'images' arethen combined and form a three dimensional hyperspectral cube for processing and analysis.
  • 14.
    Hyperspectral cubes aregenerated from airborne sensors like the NASA’s Airborne Visible/Infrared Imaging Spectrometer (AVIRIS), or from satellites like NASA’s Hyperion.However, for many development and validation studies handheld sensors are used.6
  • 15.
  • 16.
    continuedThe precision ofthese sensors is typically measured in spectral resolution, which is the width of each band of the spectrum that is captured.
  • 17.
     If the scannerpicks up on a large number of fairly narrow frequency bands, it is possible to identify objects even if said objects are only captured in a handful of pixels.
  • 18.
    However, spatial resolutionis a factor in addition to spectral resolution. If the pixels are too large, then multiple objects are captured in the same pixel and become difficult to identify.
  • 19.
     If the pixelsare too small, then the energy captured by each sensor-cell is low, and the decreased signal-to-noise ratio reduces the reliability of measured features.
  • 20.
    MicroMSI, Opticks and Envi are three remote sensingapplications that support the processing and analysis of hyperspectral data.8
  • 21.
    Imaging SpectrometersAn imaging spectrometer isan instrument used in the field of imaging spectroscopy to acquire a spectrally-resolved image of an object or scene, often referred to as a datacube due to the three-dimensional representation of the data. The principle of operation is the same as that of the simple spectrometer, but special care is taken to avoid optical aberrations for better image quality.
  • 22.
    Example imaging spectrometertypes include: filtered camera, whiskbroom scanner, pushbroom scanner, integral field spectrograph (or related dimensional reformatting techniques), wedge imaging spectrometer, Fourier transform imaging spectrometer, computed tomography imaging spectrometer (CTIS), image replicating imaging spectrometer (IRIS), and coded aperture imaging spectrometer.9
  • 23.
  • 24.
  • 25.
    Spectral coverage :0.4-2.45 µm
  • 26.
    Main objective :to identify, measure, and monitor constituents of the Earth's surface and atmosphere based on molecular absorption and particle scattering signatures.
  • 27.
    Research with AVIRISdata is predominantly focused on understanding processes related to the global environment and climate change.10
  • 28.
  • 29.
    MODIS (Moderate ResolutionImaging Spectrometer)
  • 30.
    Number of bands: Thirty six
  • 31.
    Spectral coverage :0.415-14.240 µm
  • 32.
    Main objective :to help improve our understanding of global dynamics and processes occurring on the land, in the oceans, and in the lower atmosphere.
  • 33.
    MODIS is playinga vital role in the development of validated, global, interactive Earth system models able to predict global change accurately enough to assist policy makers in making sound decisions concerning the protection of our environment.12