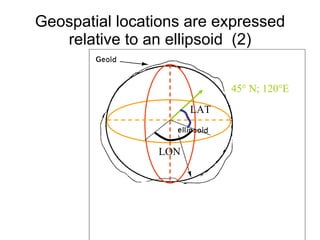
Downloaded 204 times
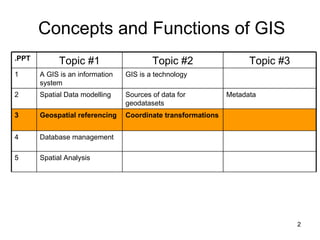
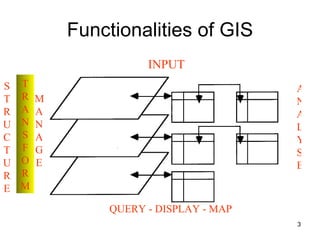
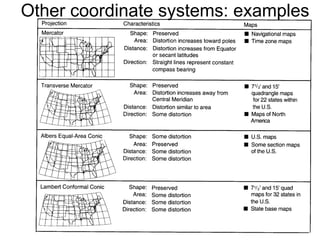
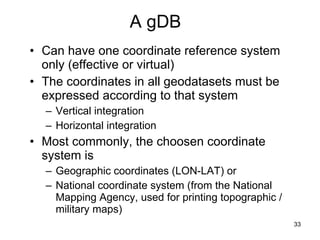
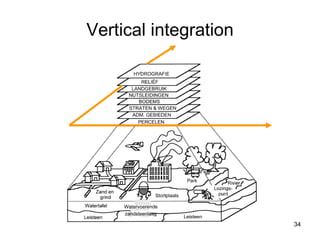
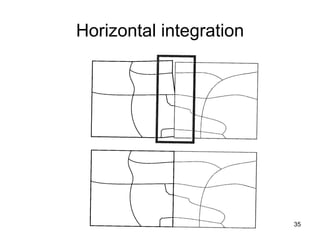
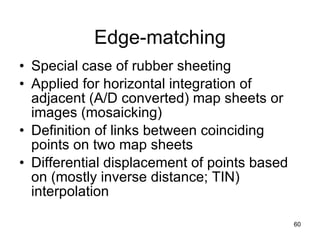
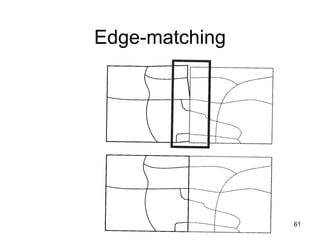
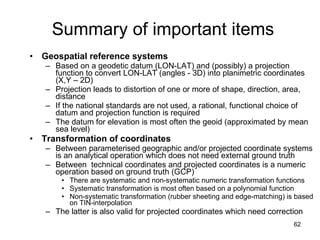


The document discusses the concepts and functions of Geographic Information Systems (GIS), focusing on spatial data modeling, geospatial referencing, and various transformations involved in GIS. It explains the roles of geodetic datums, ellipsoids, and coordinate systems in accurately representing geographical data, as well as the mathematical transformations needed to convert between different coordinate systems. The document also covers numerical coordinate transformations and techniques such as rubber sheeting and edge-matching for enhancing data accuracy in GIS applications.


