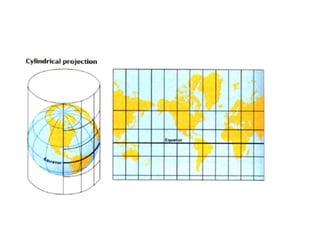
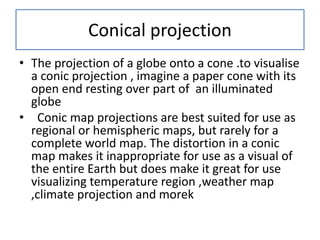
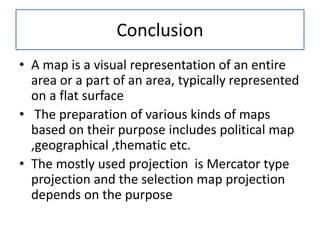
This document discusses different types of map projections used to represent the spherical Earth on a flat surface. It describes cylindrical, conic, and azimuthal projections. Cylindrical projections have straight, perpendicular lines of longitude and latitude and include the Mercator projection. Conic projections are fan-shaped and have minimal distortion along a central line. Azimuthal projections radiate from a central point and preserve directions from that point. The document provides examples like the Robinson, Polyconic, and Lambert azimuthal equal area projections. It concludes that the selection of map projection depends on the map's intended purpose.
A map projection is a systematic transformation of the latitudes and longitudes of locations from the surface of a sphere or an ellipsoid into locations on a plane. Maps cannot be created without map projections.
Cartography is the art, science and technology of map making.
Maps are used as research tools and as sources of information.
Maps have existed since the time of the Egyptian, Mesopotamian and Chinese civilizations, with the latter maps dating back to 6000 years.
Cartography is the science of map making related to geography, mathematics, geodesy, and human habitat, economy and society. Its a discipline developed during the early period of human civilization. With the development of science and technology, it has changed its paradigm twice. Its been digital, more integrated and very useful global media for communication.
Photograph taken from an aircraft commonly termed as aerial photograph have come to play and ever increasing role in the execution in cartographic mapping in various scales and in evaluation of natural resources of a region. Uses of aerial photographs in other fields are also manifold; in fact the scope seems limitless.
Topics:
1. Mapping Concepts
2. Analysis with paper based Maps
3. Limitations of Paper based Maps
4. Computer Aided Cartography History and Development
5. GIS Definition
6. Advantage of Digital Maps
Location. Location. Location. With so many maps and datums out there, how does a person know what datum is correct? How come my GPS coordinates don\'t match up on my map? Why is there a shift of 100 metres? How do I transform between different datums? What is a datum? What is the EPSG? Why have GIS Vendors and Oracle adopted them? Does offshore or onshore make a difference? How come there are so many datums? This presentation looks to provide some answers to some of these questions and to point out that latitude and longitude are not absolute.
Over the decades that surveyors have been trying to map the Earth, history and politics have shaped the way we see the world. Are the borders actually there? What if one nation adopts a standard, but the other does not? Does really matter what the co-ordinate system is? Why when I draw the a UTM Projection, the lines are curved, not in a grid? Is the OGC adopting these standards? So many questions and this presentation aims to answer some of them and provide some light on a complicated and sometimes unclear topic.
Combined gis 2(GEOGRAPHIC INFORMATION SYSTEM)musadoto
Distortions
• The earth is spherical, and a simple way of mapping it without distortion is to map it on a globe. However, mapping on globes is not possible.
• The transformation from the three-dimensional ellipsoid/sphere to the two-dimensional plane (flat) surface is not possible without some form of distortion.
• The distortions increase as the distance from the central point of the projection increases
• Areas smaller than 25 x 25 km:
No distortions
• Areas larger than 25 x 25 km:
Always distortions
• Map projections are used to control/minimize the distortions
Classification and properties of map projections
Properties of map projections
• Areas are everywhere correctly represented
• All distances are correctly represented
• All directions on the map are the same as on Earth
• All angles are correctly represented
• The shape of any area is correctly represented (e.g. a circle projected would remain a circle)
Map projection is a systematic drawing of parallel of latitudes and meridians of longitude on a plane surface for the whole earth or a part of it on a certain scale so that any point on the earth surface may correspond to that on the drawing.
Maps cannot be created without map projections. All map projections necessarily distort the surface in some fashion.
Depending on the purpose of the map, some distortions are acceptable and others are not; therefore, different map projections exist in order to preserve some properties of the sphere-like body at the expense of other properties.
There is no limit to the number of possible map projections.
Different types of Important projection systems & Coordinate systems.Every country would like to represent it's self in true shape, if shape changes then size , area also changes so that leads to distortions on the global properties of a map like Distance,direction,shape ,Area. so no country or continent will never like to represent themselves distorted , so hundreds of projections were developed by counties across the world.
This Presentation is to made concepts about measuring the earth (to locate position of any person on the whole earth). For this purpose we re going step by step basis in this presentation.These steps are mentioned as contents. After that you may able to learn about measuring a person's position of earth. Thank you!
Contour maps: preparation and understanding.VIVEK CHAUHAN
The theme behind preparation of contour maps, various projections of topographical features, the processor making them and methods used in their making.
This is a presentation by Dada Robert in a Your Skill Boost masterclass organised by the Excellence Foundation for South Sudan (EFSS) on Saturday, the 25th and Sunday, the 26th of May 2024.
He discussed the concept of quality improvement, emphasizing its applicability to various aspects of life, including personal, project, and program improvements. He defined quality as doing the right thing at the right time in the right way to achieve the best possible results and discussed the concept of the "gap" between what we know and what we do, and how this gap represents the areas we need to improve. He explained the scientific approach to quality improvement, which involves systematic performance analysis, testing and learning, and implementing change ideas. He also highlighted the importance of client focus and a team approach to quality improvement.
The Roman Empire A Historical Colossus.pdfkaushalkr1407
The Roman Empire, a vast and enduring power, stands as one of history's most remarkable civilizations, leaving an indelible imprint on the world. It emerged from the Roman Republic, transitioning into an imperial powerhouse under the leadership of Augustus Caesar in 27 BCE. This transformation marked the beginning of an era defined by unprecedented territorial expansion, architectural marvels, and profound cultural influence.
The empire's roots lie in the city of Rome, founded, according to legend, by Romulus in 753 BCE. Over centuries, Rome evolved from a small settlement to a formidable republic, characterized by a complex political system with elected officials and checks on power. However, internal strife, class conflicts, and military ambitions paved the way for the end of the Republic. Julius Caesar’s dictatorship and subsequent assassination in 44 BCE created a power vacuum, leading to a civil war. Octavian, later Augustus, emerged victorious, heralding the Roman Empire’s birth.
Under Augustus, the empire experienced the Pax Romana, a 200-year period of relative peace and stability. Augustus reformed the military, established efficient administrative systems, and initiated grand construction projects. The empire's borders expanded, encompassing territories from Britain to Egypt and from Spain to the Euphrates. Roman legions, renowned for their discipline and engineering prowess, secured and maintained these vast territories, building roads, fortifications, and cities that facilitated control and integration.
The Roman Empire’s society was hierarchical, with a rigid class system. At the top were the patricians, wealthy elites who held significant political power. Below them were the plebeians, free citizens with limited political influence, and the vast numbers of slaves who formed the backbone of the economy. The family unit was central, governed by the paterfamilias, the male head who held absolute authority.
Culturally, the Romans were eclectic, absorbing and adapting elements from the civilizations they encountered, particularly the Greeks. Roman art, literature, and philosophy reflected this synthesis, creating a rich cultural tapestry. Latin, the Roman language, became the lingua franca of the Western world, influencing numerous modern languages.
Roman architecture and engineering achievements were monumental. They perfected the arch, vault, and dome, constructing enduring structures like the Colosseum, Pantheon, and aqueducts. These engineering marvels not only showcased Roman ingenuity but also served practical purposes, from public entertainment to water supply.
The French Revolution, which began in 1789, was a period of radical social and political upheaval in France. It marked the decline of absolute monarchies, the rise of secular and democratic republics, and the eventual rise of Napoleon Bonaparte. This revolutionary period is crucial in understanding the transition from feudalism to modernity in Europe.
For more information, visit-www.vavaclasses.com
Welcome to TechSoup New Member Orientation and Q&A (May 2024).pdfTechSoup
In this webinar you will learn how your organization can access TechSoup's wide variety of product discount and donation programs. From hardware to software, we'll give you a tour of the tools available to help your nonprofit with productivity, collaboration, financial management, donor tracking, security, and more.
Operation “Blue Star” is the only event in the history of Independent India where the state went into war with its own people. Even after about 40 years it is not clear if it was culmination of states anger over people of the region, a political game of power or start of dictatorial chapter in the democratic setup.
The people of Punjab felt alienated from main stream due to denial of their just demands during a long democratic struggle since independence. As it happen all over the word, it led to militant struggle with great loss of lives of military, police and civilian personnel. Killing of Indira Gandhi and massacre of innocent Sikhs in Delhi and other India cities was also associated with this movement.
Synthetic Fiber Construction in lab .pptxPavel ( NSTU)
Synthetic fiber production is a fascinating and complex field that blends chemistry, engineering, and environmental science. By understanding these aspects, students can gain a comprehensive view of synthetic fiber production, its impact on society and the environment, and the potential for future innovations. Synthetic fibers play a crucial role in modern society, impacting various aspects of daily life, industry, and the environment. ynthetic fibers are integral to modern life, offering a range of benefits from cost-effectiveness and versatility to innovative applications and performance characteristics. While they pose environmental challenges, ongoing research and development aim to create more sustainable and eco-friendly alternatives. Understanding the importance of synthetic fibers helps in appreciating their role in the economy, industry, and daily life, while also emphasizing the need for sustainable practices and innovation.
Students, digital devices and success - Andreas Schleicher - 27 May 2024..pptxEduSkills OECD
Andreas Schleicher presents at the OECD webinar ‘Digital devices in schools: detrimental distraction or secret to success?’ on 27 May 2024. The presentation was based on findings from PISA 2022 results and the webinar helped launch the PISA in Focus ‘Managing screen time: How to protect and equip students against distraction’ https://www.oecd-ilibrary.org/education/managing-screen-time_7c225af4-en and the OECD Education Policy Perspective ‘Students, digital devices and success’ can be found here - https://oe.cd/il/5yV
The Art Pastor's Guide to Sabbath | Steve ThomasonSteve Thomason
What is the purpose of the Sabbath Law in the Torah. It is interesting to compare how the context of the law shifts from Exodus to Deuteronomy. Who gets to rest, and why?
How to Create Map Views in the Odoo 17 ERPCeline George
The map views are useful for providing a geographical representation of data. They allow users to visualize and analyze the data in a more intuitive manner.
Model Attribute Check Company Auto PropertyCeline George
In Odoo, the multi-company feature allows you to manage multiple companies within a single Odoo database instance. Each company can have its own configurations while still sharing common resources such as products, customers, and suppliers.
3. INTRODUCTION
• A map is a visual representation of an entire area or a part of
an area, typically represented on a flat surface
• Maps attempt to represent various things, like political
boundaries, physical features, roads, topography, population,
climates, natural resources and economic activities
• The method of representing the surface of a globe or any
three dimensional body on a flat surface is known as
projection .Map projection is important for creating maps
• The basic problem in any map projection is that there is
always some distortion. It could be in distance, shape, area or
direction.
4. Important types of map
political map
Topographic map
Physical map
Thematic map
Geographic map
Economic resource map
5. Map projection
• The method of representing the surface of a
globe or any three dimensional body on a flat
surface is known as projection
• The type of map projection depends on their
purpose
1. Cylindrical
2.Conic
3.Azimuthal
4.Other projection
6. Cylindrical projection
• Cylindrical map projections are one way of portraying the
Earth. This kind of map projection has straight coordinate
lines with horizontal parallels crossing meridians at right
angles. All meridians are equally spaced and the scale is
consistent along each parallel
• Cylindrical map projections are rectangles, but are called
cylindrical because they can be rolled up and their edges
mapped in a tube, or cylinder.
• The only factor that distinguishes different cylindrical map
projections from one another is the scale used when
spacing the parallel lines on the map
• The most famous cylindrical projection is Mercator
7. • Are rectangular or oval shaped – but this
projection technique is very variable in its shape
• have lines of longitude and latitude at right-
angles to each other
• Distortions increasing away from the central
circular line (the ‘touch point of the paper’)
• Have very small distortions along the central
circular line (the ‘touch point of the paper’)
• show shapes correctly, but size is distorted
8.
9. Conical projection
• The projection of a globe onto a cone .to visualise
a conic projection , imagine a paper cone with its
open end resting over part of an illuminated
globe
• Conic map projections are best suited for use as
regional or hemispheric maps, but rarely for a
complete world map. The distortion in a conic
map makes it inappropriate for use as a visual of
the entire Earth but does make it great for use
visualizing temperature region ,weather map
,climate projection and morek
10. • Are fan shaped when used to map large areas
• Distortions increasing away from the central circular
line (the ‘touch point of the paper’)
• Have very small distortions along the central circular
line (the ‘touch point of the paper’)
• usually have lines of longitude fanning out from each
other and have lines of latitude as open concentric
circles.
• shapes are shown correctly, but size is distorted
11.
12. Azimuthal projection
• The azimuthal map projection is angular- given three points on a map (A,
B, and C) the azimuth from Point B to Point C dictates the angle someone
would have to look or travel in order to get to A. These angular
relationships are more commonly known as great circle arcs or geodesic
arcs
• The main features of azimuthal map projections are straight meridian
lines, radiating out from a central point, parallels that are circular around
the central point, and equidistant parallel spacing. Light paths in three
different categories (orthographic, stereographic, and gnomonic) can also
be used
• Azimuthal maps are beneficial for finding direction from any point on the
Earth using the central point as a reference.
• The shortest distance between any two points on the as straight line .this
distance is non as Great circle route
13.
14. • The distortions increasing away from the central
point
• Have very small distortions near the centre point
(the ’touch point of the paper‘)
• Compass direction is only correct from the centre
point to another feature – not between other
features are not usually used near the Equator,
because other projections better represent the
features in this area.
15.
16. Other types of projection
Mercator
The Mercator projection has straight meridians and
parallels that intersects at right angles. Scale is true
at the equator or at two standard parallels
equidistant from the equator
Miller cylindrical
it has straight meridians and parallels that meet at
right angles ,but straight lines are not of constant
azimuth .shapes and areas are distorted
17. Transverse Mercator
It results from projecting the sphere onto a
cylindrical tangent to a central meridian ,this maps
are often used to portray areas with larger N-S than
E-W extent
The Universal Transvers Mercator (UTM) projection
is used to define horizontal ,positions world wide by
dividing the surface of the earth into 6 degree zone
,each maped by TM projection with a central
meridian in the centre of the zone
18. Robinson projection
It is based on table of coordinates not
mathematical formulas. The projection distorts
shape ,area ,scale ,and the distant in an attempt
to balance the error of projection properties
19. Polyconic
It was most used for earlier topographic USGS
quadrangles .The projection is based on an
infinite number of cones tangent to an infinite
number of parallels .the central meridian is
straight and other are complex curves
20. Lambert azimuthal equal area
It is sometimes used to map large ocean areas ,
the central meridian is a straight line ,other are
curved . A straight line drawn through the center
point is on a great circle
21. Conclusion
• A map is a visual representation of an entire
area or a part of an area, typically represented
on a flat surface
• The preparation of various kinds of maps
based on their purpose includes political map
,geographical ,thematic etc.
• The mostly used projection is Mercator type
projection and the selection map projection
depends on the purpose