INTRODUCTION
Most scientific andbusiness data and natural
relationships, such as weight, height, etc., when
displayed using a histogramfrequency curve are
bell-shaped, andsymmetrical, known as NORMAL
DISTRIBUTION.
3.
NORMAL DISTRIBUTION
Manythings closelyfollow a Normal
Distribution:
• heights of people
• size of things produced by machines
• errors in measurements
• blood pressure
• scores on a test
CHARACTERISTICS OF ANORMALCURVE
✓Mathematical model represented by a
bell-shaped curve which is symmetric with
respect to the mean.
✓The normal curve does not intersect or touch
the horizontal axis.
6.
CHARACTERISTICS OF ANORMALCURVE
✓The mean, median and mode of the normal
distribution are equal.
✓The area under the normal curved is approximately
equal to 1 or 100%.
✓The standardized normal distribution has a mean
of 0 and standard deviation of 1.
7.
Example: Mean andStd Deviation of the distribution
are 55 and 12 respectively
8.
STANDARD SCORE- z-score
•It’ s a measure of how many
standard deviations below or above
the population mean a raw score is.
• z-scores are expressed in terms of
standard deviations from their
means.
• These z-scores have a distribution
with a mean of 0 and a standard
deviation of 1.
9.
Standard Score Formula
z= (x - µ) / σ
• z = standard score
• x = given data
• µ = mean
• σ = standard deviation
10.
Example:
Convert the followingdata to standard score
Given
score
z- score
13 -1.03
12 -1.28
18 + 0.26
20 +0.77
22 +1.28
z = (x - µ) / σ
• µ= 17 and σ= 3.9
z = (13 - 17) / 3.9 =
Howto Find theArea under the Normal curve:
ComputingNormal Probabilities
There are several different situations that
can arise when asked to find normal
probabilities.
I. BETWEEN AZERO AND ANY NUMBER
Look at the area in the table.
14.
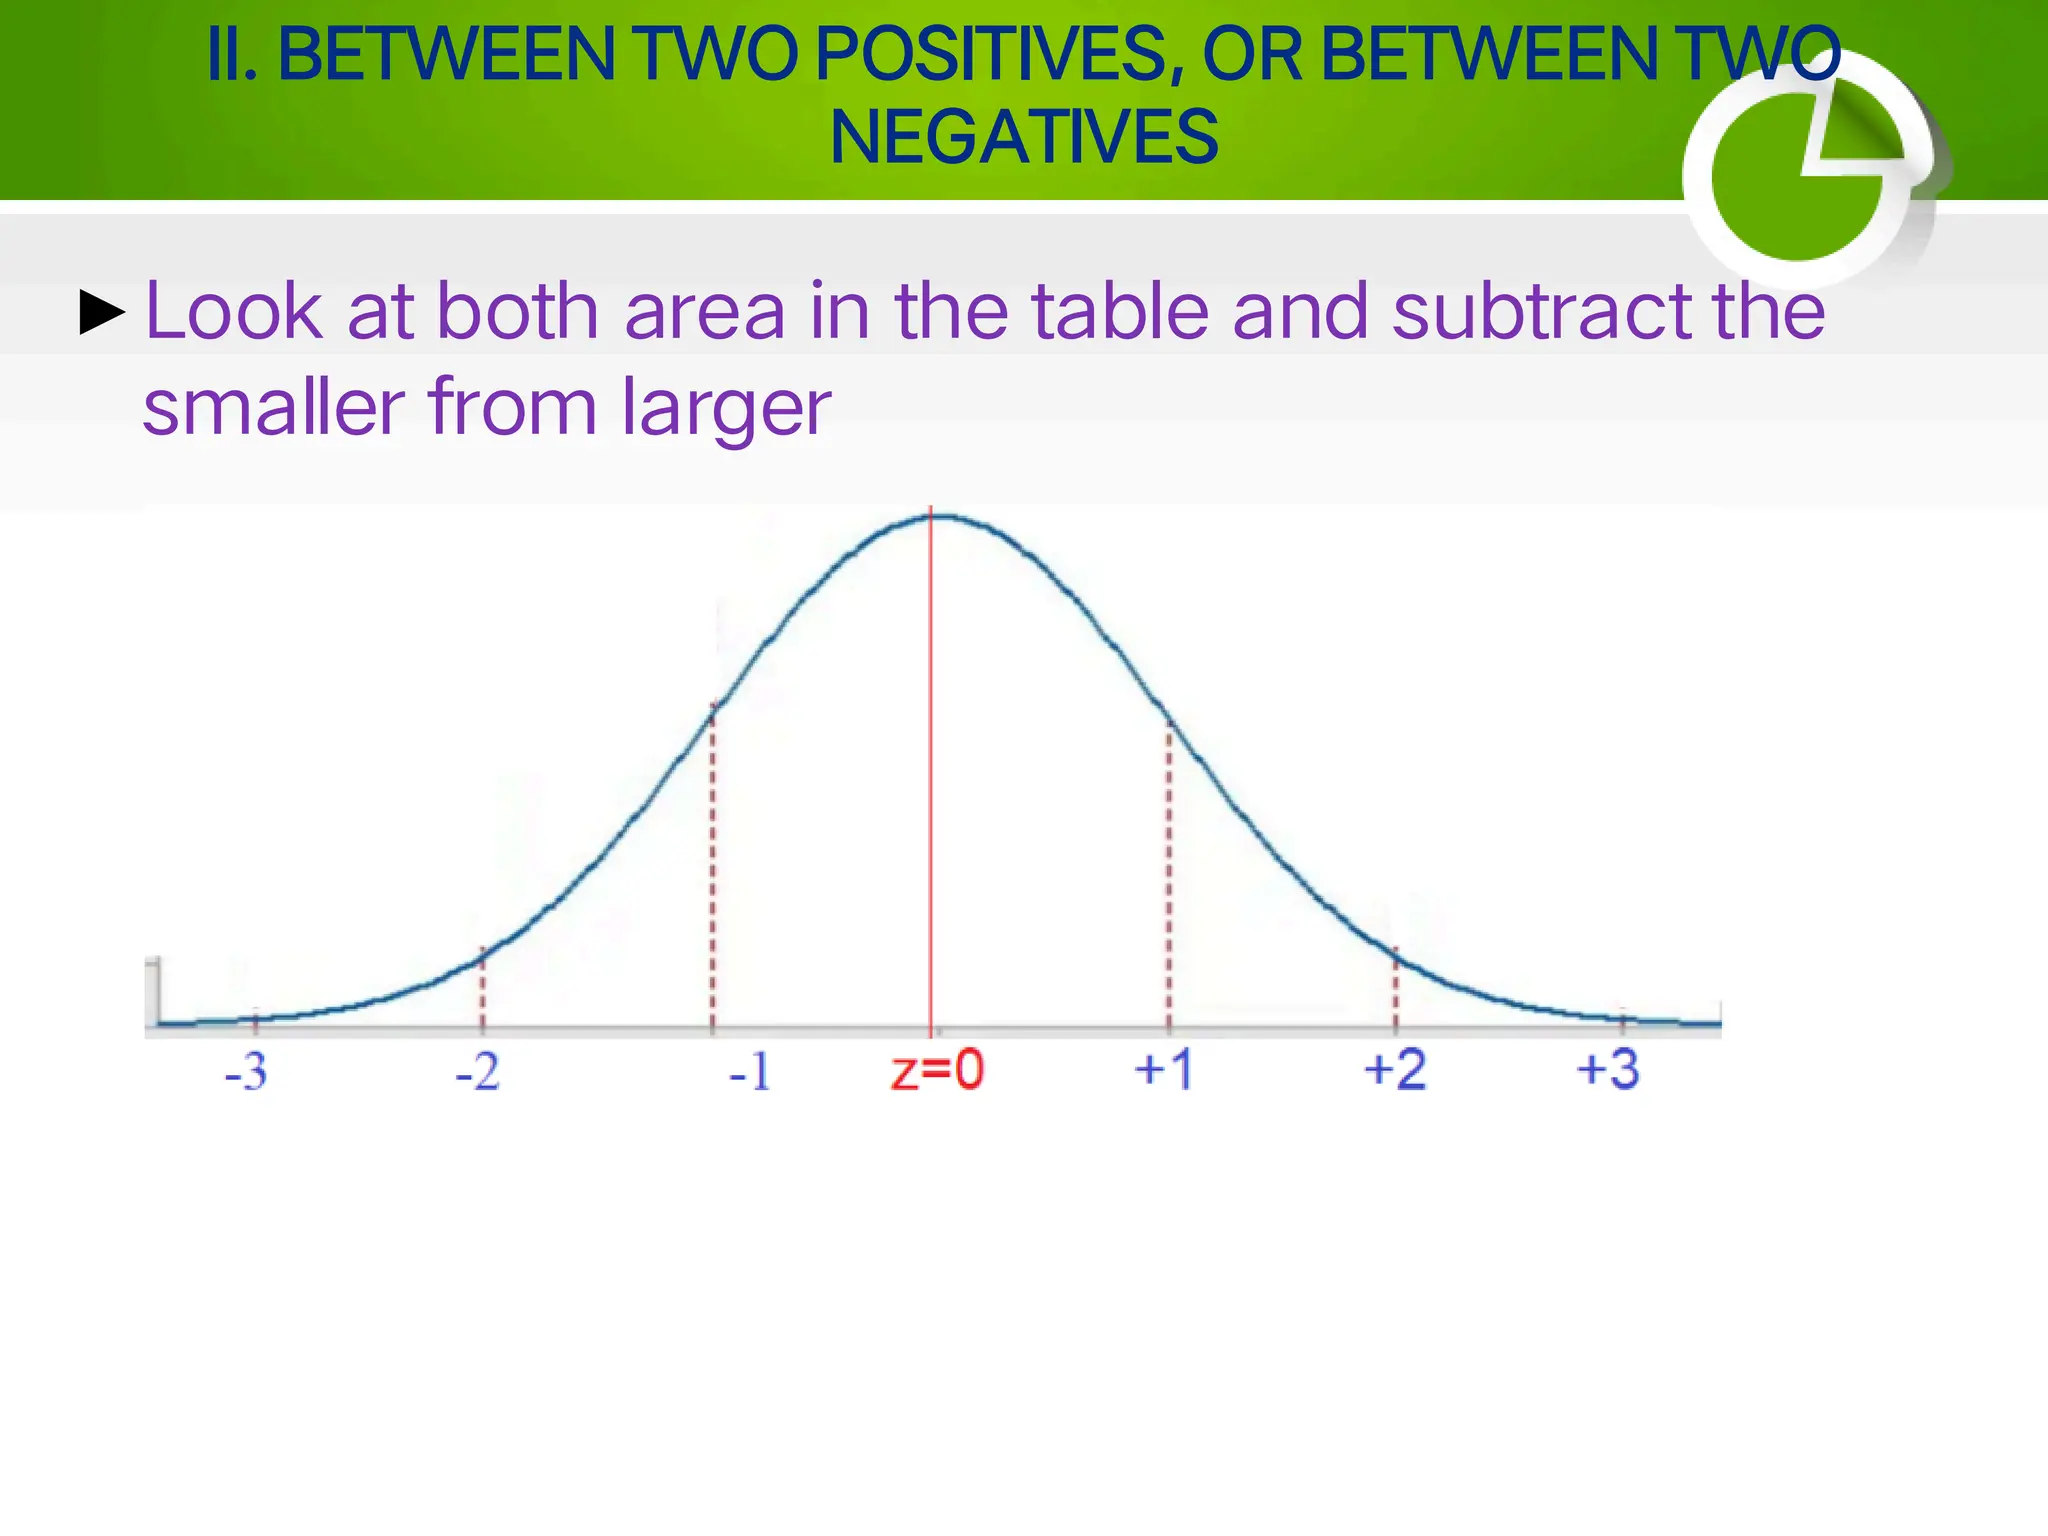
II. BETWEEN TWOPOSITIVES, OR BETWEEN TWO
NEGATIVES
▶Look at both area in the table and subtract the
smaller from larger
15.
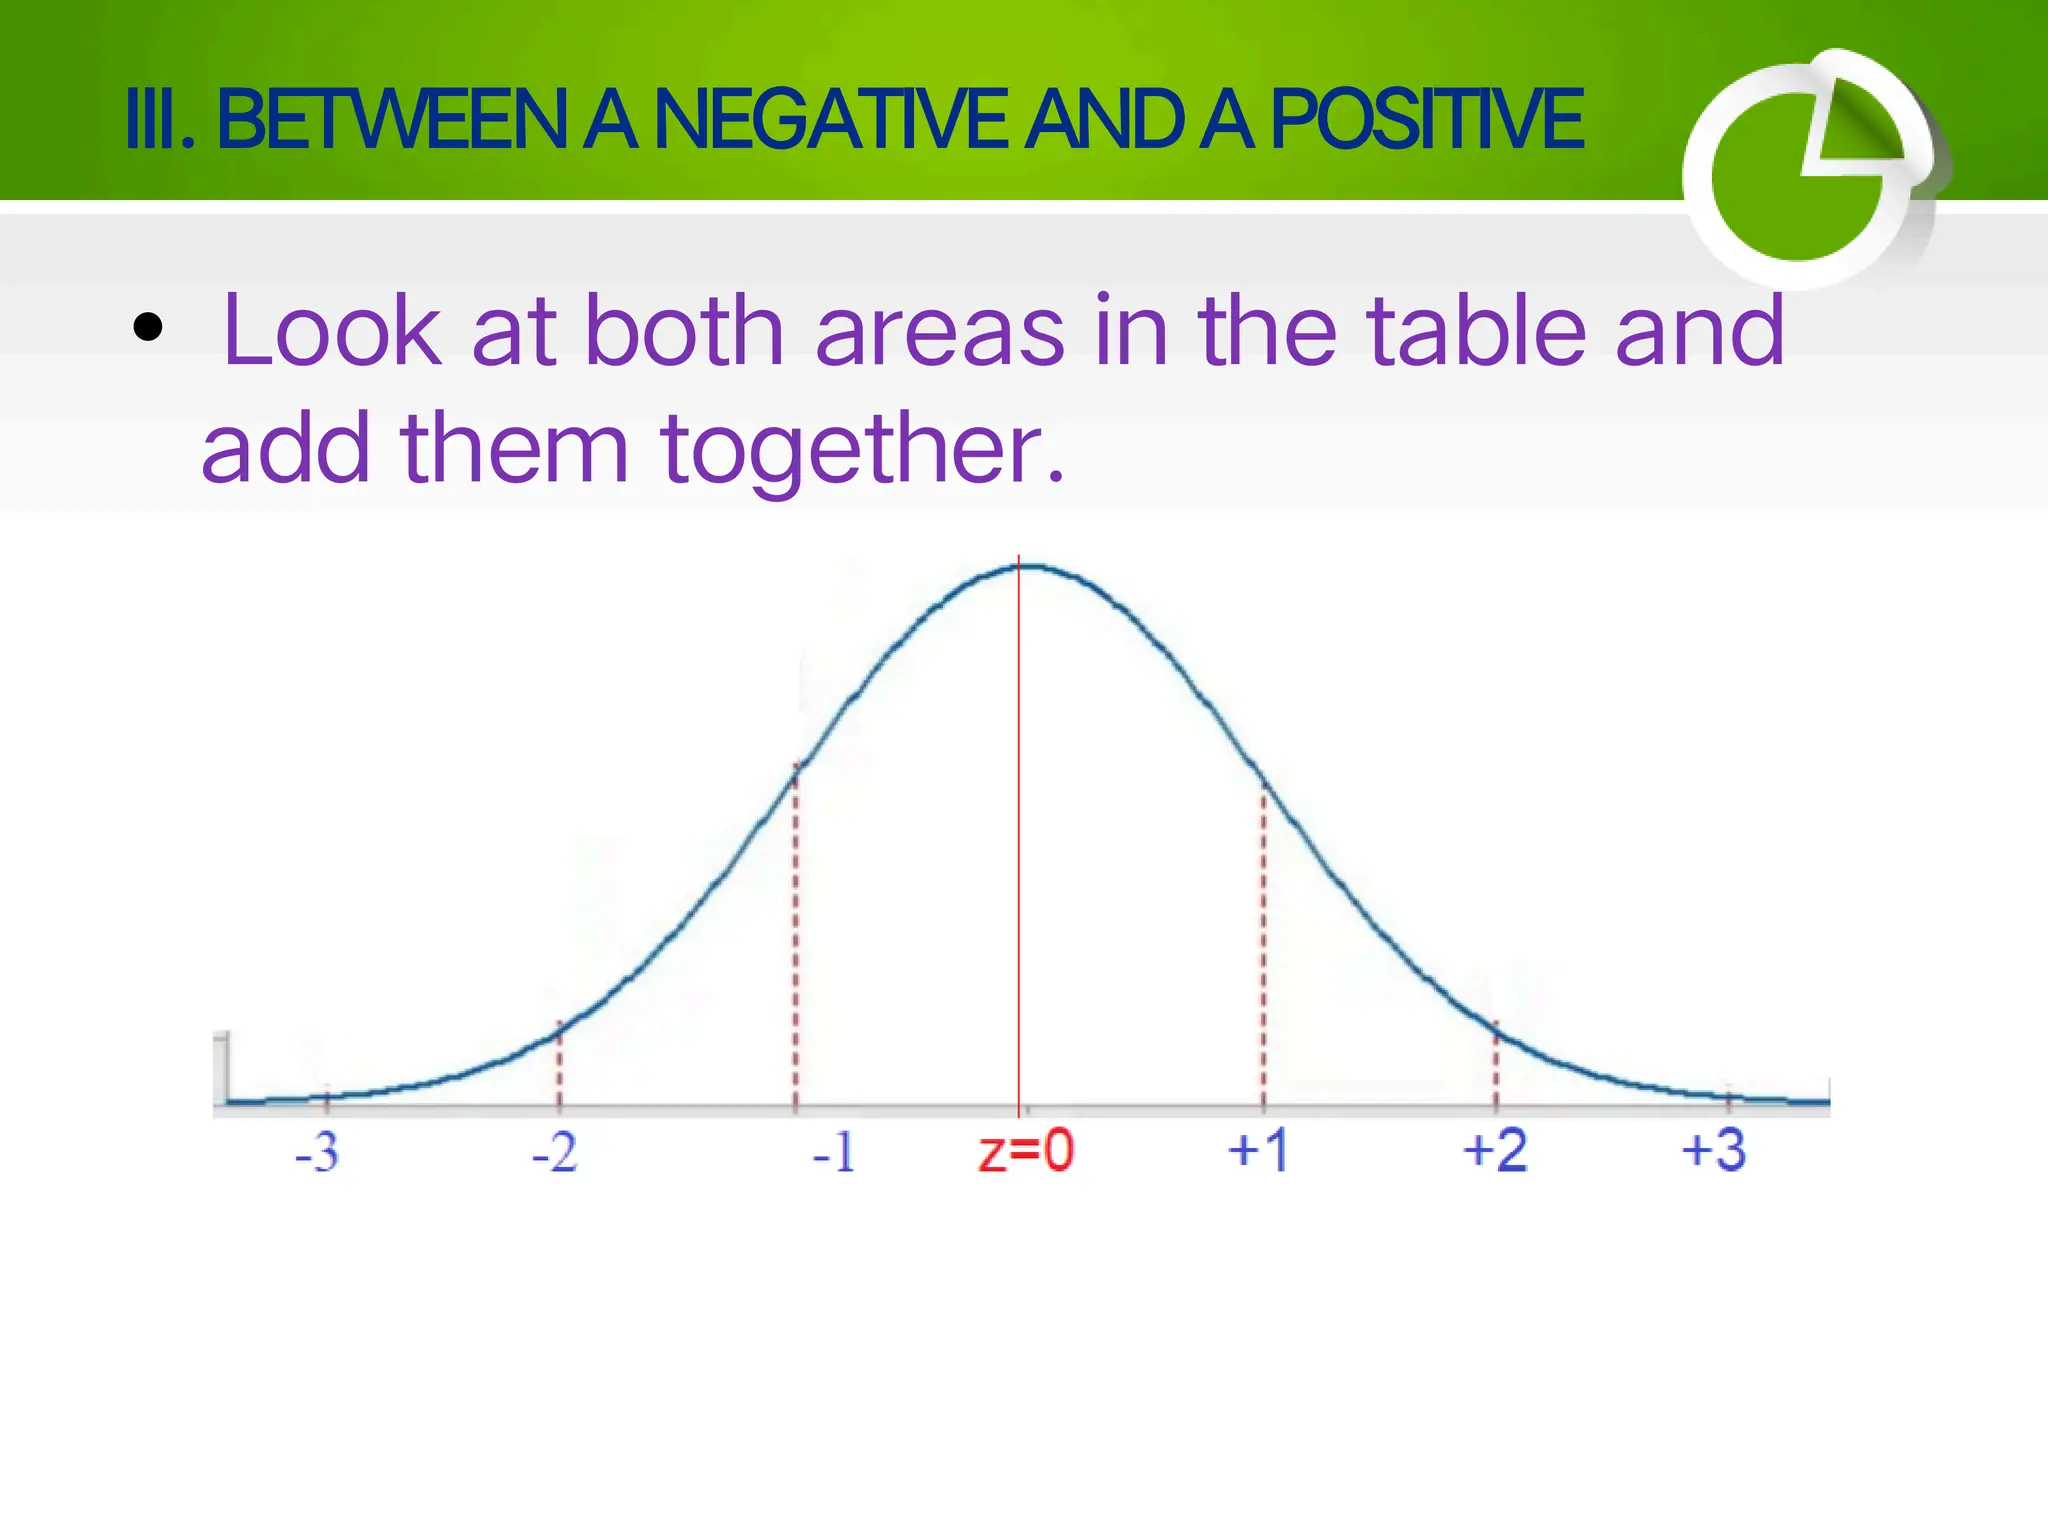
III. BETWEENA NEGATIVEAND A POSITIVE
• Look at both areas in the table and
add them together.
16.
IV. LESS THANA NEGATIVE, OR GREATER THAN A
POSITIVE
▶Look up the area in the table and subtract from
0.5.
17.
V. GREATER THANANEGATIVE OR LESS THANA
POSITIVE
▶Look at the in the table and add 0.5.
18.
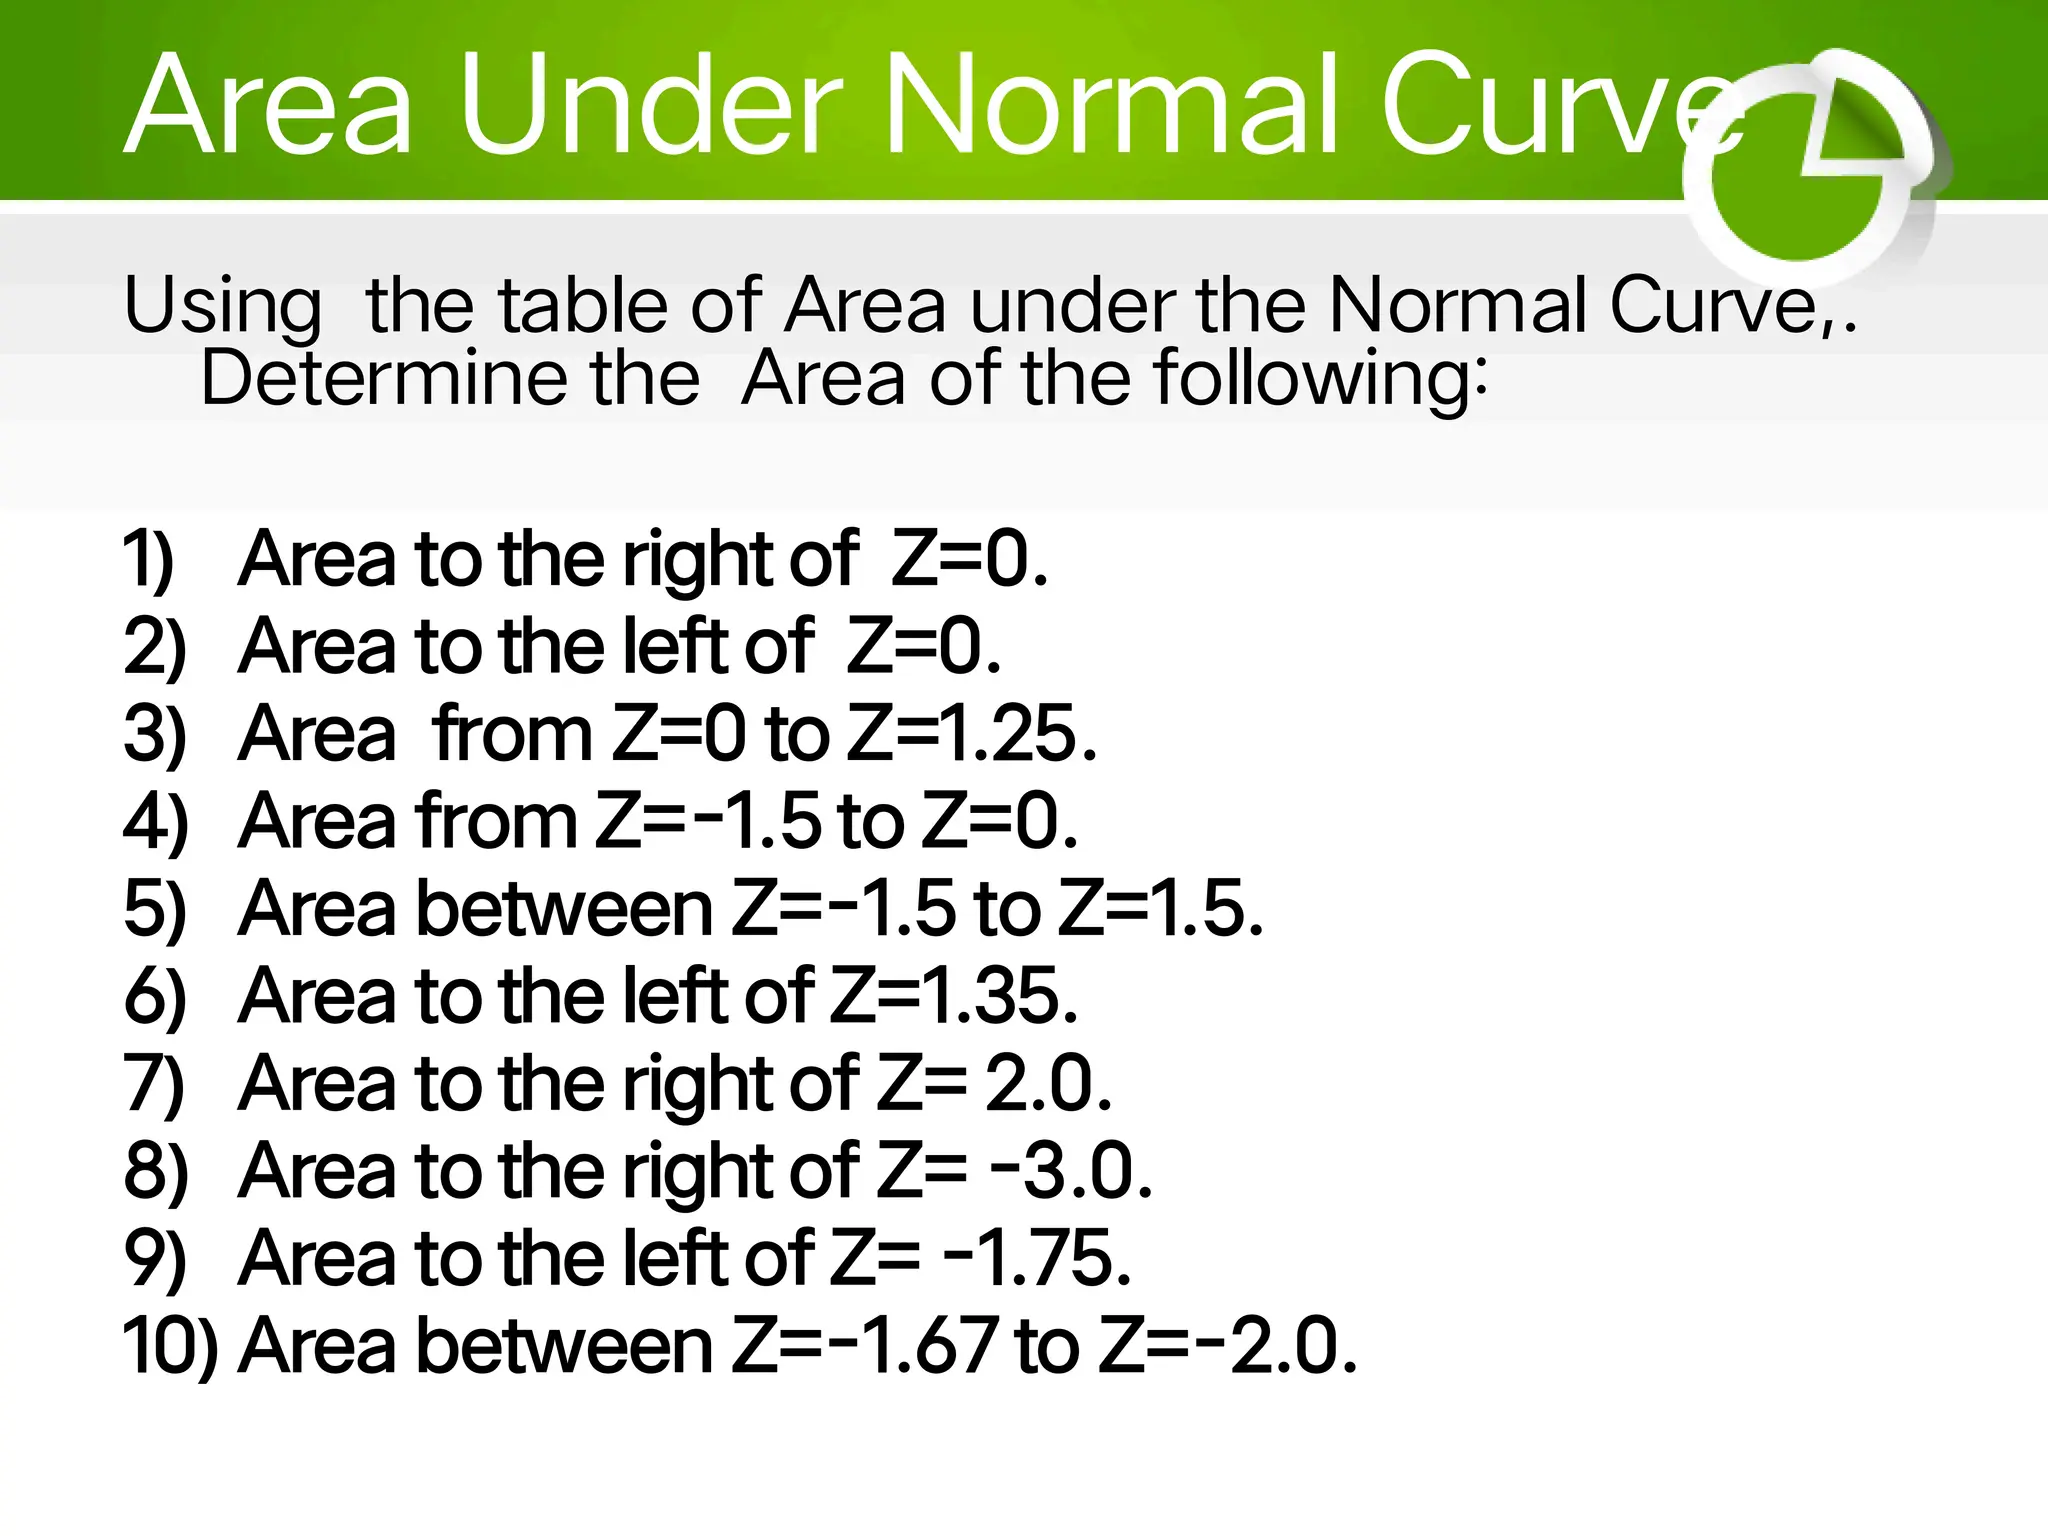
Area Under NormalCurve
Using the table of Area under the Normal Curve,.
Determine the Area of the following:
1) Area to the right of Z=0.
2) Area to the left of Z=0.
3) Area from Z=0 to Z=1.25.
4) Area from Z=-1.5 to Z=0.
5) Area between Z=-1.5 to Z=1.5.
6) Area to the left of Z=1.35.
7) Area to the right of Z= 2.0.
8) Area to the right of Z= -3.0.
9) Area to the left of Z= -1.75.
10) Area between Z=-1.67 to Z=-2.0.
19.
ANSWER
1. 0.5 or50%
2. 0.5 or 50%
3. 0.3944 or 39.44 %
4. 0.4332 or 43.32%
5. 0.8664 or 86.64%
6. 0.9115 or 91.15%
7. 0.0228 or 2.28%
8. 0.9987 or 99.87%
9. 0.0401 or 4.01%
10. 0.0247 or 2. 47%
20.
Application of theNormal Curve
Example 1. The scores of the grade 25 pupils
have a mean of 5.35 and standard deviation
of 0.45.
(a) What percentage of all these scores are
lower than 4?
(b) What percentage of these scores are
between 5 and 6?
21.
Example 2
You takethe entrance examination and
score 68. The mean score for the of the
exam is 54 and the standard deviation is 9.7.
(a) How well did you score on the test
compared to the average test taker?
22.
Example 2
(b) Ifthere were 500 students who took the
examination:
i. how many students score between 50
and 70
ii. how many students got below 45
23.
Example 3
Let's considerthe distribution of the tests for an
individual's intelligence quotient (IQ) are designed
to be normally distributed, with a mean of 100 and a
standard deviation of 15.
(a) If score 136 inthe tests for are "potential
genius", what percentage of individuals are
"potential geniuses"?
(b) If there were 800 students who took the IQ test,
how many of them are between 110 to 125?
24.
ACTIVITY
1. Suppose thatthe volume of paint in the 1-gallon
paint cans produced by Acme Paint Company is
approximately normally distributed with a mean of 1.
04 gallons and a standard deviation of 0.023
gallons.
(a)What is the probability that a randomly selected
1-gallon can will actually contain at least 1 gallon of
paint?
(b)What volume can the Acme Paint Company say
that 95% of their cans exceed?
25.
ACTIVITY
2.Suppose the amountof light (in lumens)
emitted by a particular brand of 40W light bulbs
is normally distributed with a mean of 450
lumens and a standard deviation of 20 lumens.
(a)What percentage of bulbs emit between 425
and 475 lumens?
(b)What percentage of bulbs emit greater than
430 lumens?


![[DSC Europe 25] Hans Kleinsman - The Compliance Gearbox: How Tax Tech Mediate...](https://cdn.slidesharecdn.com/ss_thumbnails/dxdytie1toel0hr90bjs-2-251212103250-174fdbe7-thumbnail.jpg?width=640&height=640&fit=bounds)

![[DSC Europe 25] Marko Krstic - Understanding the AI Threat Landscape - Risks,...](https://cdn.slidesharecdn.com/ss_thumbnails/tiyim1ins5jvbrvzpzla-2-251209104645-c69d3553-thumbnail.jpg?width=640&height=640&fit=bounds)

![[DSC Europe 25] Branko Urosevic -Rethinking Financial Talent: Integrating Cod...](https://cdn.slidesharecdn.com/ss_thumbnails/8jjrus8ttko6qj64f58f-3-251212103250-642c6374-thumbnail.jpg?width=640&height=640&fit=bounds)

![[DSC Europe 25] Jovan Bogicevic - Legacy to AI-Driven Defense: Transforming D...](https://cdn.slidesharecdn.com/ss_thumbnails/rsarluadt563hntyfc8q-3-251211083849-3e7bc4c0-thumbnail.jpg?width=640&height=640&fit=bounds)
![[DSC Europe 25] Katherine Forrest - AI NOW: Understanding the Velocity of Cha...](https://cdn.slidesharecdn.com/ss_thumbnails/wvvbruqfrci0sfq9xwgb-4-251212104007-e5ad1987-thumbnail.jpg?width=640&height=640&fit=bounds)
![[DSC Europe 25] Ivan Peric - Intelligence Swarm Logic and Techno-Functional M...](https://cdn.slidesharecdn.com/ss_thumbnails/7my7c97fsduiccadgavw-2-251212103249-5a03f7c6-thumbnail.jpg?width=640&height=640&fit=bounds)
![[DSC Europe 25] Bassam Maharmeh - Artificial Intelligence: Opportunities and ...](https://cdn.slidesharecdn.com/ss_thumbnails/thhfmr2fqpawzj7hsjpg-5-251211083048-2c23204f-thumbnail.jpg?width=640&height=640&fit=bounds)
