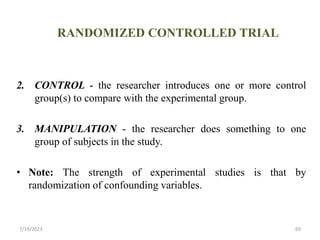
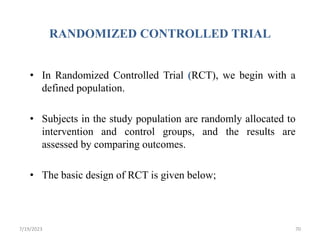
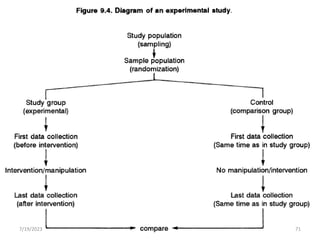
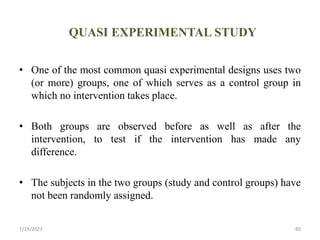
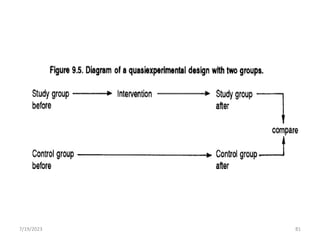
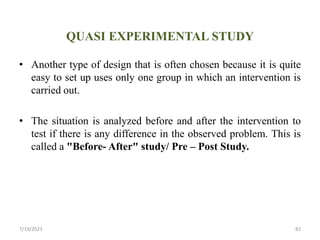
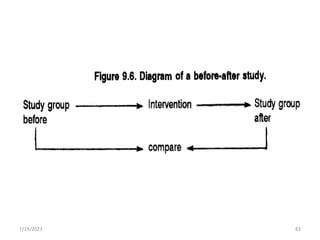
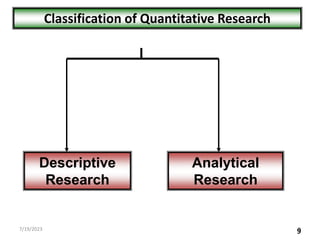
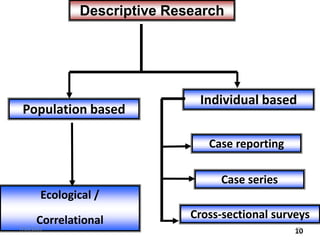
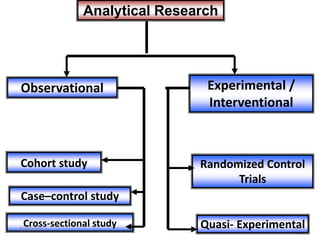
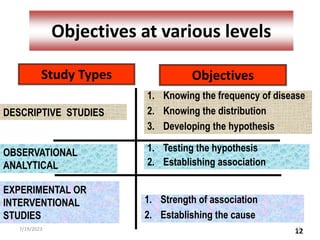
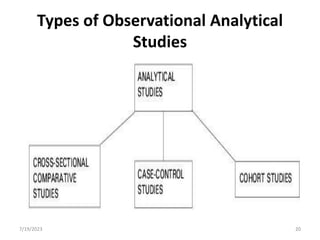
Introduction to Quantitative and Qualitative Research:
Objectives:
Define the terms of qualitative and quantitative research.
2. Differentiate between qualitative and quantitative research.
3. Describe methods/approaches/types of quantitative research, i.e. Descriptive, Co- relational, Quasi-Experimental and Experimental research.
4. Describe methods/approaches/types of qualitative research i.e. Phenomenological, Grounded Theory, Ethnographical, and Historical research
5. Understand methodologies of qualitative and quantitative research.
Quantitative Research:
Attempts to explain phenomena by collecting and analyzing numerical data
Tells if there is a “difference” but not necessarily why
Data collected are always numerical and analysed using statistical methods
Variables are controlled as much as possible (RCTs as the gold standard) so could eliminate interference and measure the effect of any change
Randomisation to reduce subjective bias
If there are no numbers involved, its not quantitative
Some types of research lend themselves better to quant approaches than others.
Quantitative data:
Data sources include
Surveys where there are a large number of respondents (esp where you have used a Likert scale)
Questionnaires, data collection tools/ instruments
Observations (counts of numbers and/or coding data into numbers)
Secondary data (government data; SATs scores etc)
Analysis techniques include hypothesis testing, correlations and cluster analysis.
Qualitative Research:
Any research that doesn’t involve numerical data
Instead uses observations, words, pictures, videos, audio recordings. Field notes, expressions, and peoples’ own words.
Tends to start with a broad question rather than a specific hypothesis
Develop theory rather than start with one
Tends to yield rich data to explore how and why things happened
Don’t need large sample sizes (in comparison to quantitative research).
Qualitative data:
Interviews (structured, semi-structured or unstructured)
Focus groups
Questionnaires or surveys
Secondary data, including diaries, self-reporting, written accounts of past events/archive data and company reports;
Direct observations – may also be recorded (video/audio)
Ethnography
Data analysis; thematic or content analysis .
Descriptive Studies:
Describe only; do NOT examine associations between Exposure (E) and health Outcome (O).
Generally the purpose is to describe the variability in a health outcome and/or formulate hypotheses.
A descriptive study involves describing the characteristics of a particular situation event or case.
Descriptive studies can be carried out on a small or larger scale.
Case Study :
A study of one diseased individual, providing a detailed description of an uncommon disease; provides timely or rare information.
Case Series :
A study of multiple occurrences of unusual cases that have similar characteristics.
Investigators can calculate the frequency of symptoms or characteristics of people with the disease.
Study designs, Epidemiological study design, Types of studiesDr Lipilekha Patnaik
Study design, Epidemiological study designA study design is a specific plan or protocol
for conducting the study, which allows the investigator to translate the conceptual hypothesis into an operational one.
This is lesson 6 of the course on Research Methodology conducted at the Faculty of Social Sciences and Humanities of the Rajarata University of Sri Lanka
A cross-sectional study is a descriptive study in which disease and exposure status are measured simultaneously in a given population.
It measures
the prevalence of health outcomes(also called prevalence study)
or determinants of health,
or both,
In a population at a point in time or over a short period.
When the investigator draws a sample out of the study population of interest and examines all the subjects to detect
those having the disease/outcome
and those not having this disease/outcome of interest.
At the same time, finds out whether or not they have the presence of
the suspected cause (exposure)
(or give a History of such exposure in the past),
is called the Cross-sectional analytic study.
This is an easiest power-point slide you will get on topic Epidemiology. It’s basic of Epidemiology. This ppt includes difference between observational study & experimental study. Classification of Epidemiological study. You can read this & have an overview of Epidemiological study design in short. This power point will help you regarding understanding Epidemiological study. Including cohort study, case control study, descriptive study. This includes advantage & disadvantage of many studies of Epidemiological study design such ase cohort study, case control study, analytical study. It was our group presentation so we made with all our affords. I was the leader of our team I can assure you, you won’t get disappointment after studying this slides.
Unit 12. Limitations & Recomendations.pptxshakirRahman10
Limitations & Recommendations:
Objectives:
Enlist theoretical and methodological/procedural limitation
Discuss the importance of study to give recommendations at organizational, national, international level.
Discussion Section:
The discussion section is where the researcher delve into the meaning, importance, and relevance of results.
It should focus on explaining and evaluating what you found, showing how it relates to your literature review and paper or dissertation topic, and making an argument in support of your overall conclusion. It should not be a second results section.
There are different ways to write this section, but you can focus your writing around these key elements:
Summary:
A brief recap of your key results
Interpretations:
What do your results mean?
Implications:
Why do your results matter?
Limitations:
What can’t your results tell us?
Recommendations:
Avenues for further studies or analyses.
Not to Include in Discussion Section:
There are a few common mistakes to avoid when writing the discussion section of your paper.
Don’t introduce new results: You should only discuss the data that you have already reported in your results section.
Don’t make inflated claims: Avoid over interpretation and speculation that isn’t directly supported by your data.
Don’t undermine your research: The discussion of limitations should aim to strengthen your credibility, not emphasize weaknesses or failures.
Step 1: Summarize your key findings:
Start this section by reiterating your research problem and concisely summarizing your major findings.
Don’t just repeat all the data you have already reported—aim for a clear statement of the overall result that directly answers your main research question.
This should be no more than one paragraph.
Many students struggle with the differences between a discussion section and a results section.
The crux of the matter is that your results sections should present your results, and your discussion section should subjectively evaluate them.
Examples: Summarization sentence starters;
The results indicate that…
The study demonstrates a correlation between…
This analysis supports the theory that…
The data suggest that…
Step 2: Give your interpretations:
The meaning of your results may seem obvious to you, but it’s important to spell out their significance for your reader, showing exactly how they answer your research question.
The form of your interpretations will depend on the type of research, but some typical approaches to interpreting the data include:
Identifying correlations, patterns, and relationships among the data
Discussing whether the results met your expectations or supported your hypotheses
Contextualizing your findings within previous research and theory
Explaining unexpected results and evaluating their significance
Considering possible alternative explanations and making an argument for your position.
Unit 11. Interepreting the Research Findings.pptxshakirRahman10
INTERPRETING THE RESEARCH FINDINGS.
Objectives:
At the completion of this unit learners will be able to
Discuss the different means and interpretation of data presentation/displaying through, Graphs (pie, bar, line, histogram), Tables, Charts. (spot map)
Discuss the different inferences through inferential tests and their interpretation.
Methods of Data collection and Presentation:
Methods of data collection:
Source of Data:
Statistical data may be obtained from two sources, namely, primary and secondary.
Primary data:
data measured or collected by the investigator or the user directly from the source. Primary sources are sources that can supply first hand information for immediate user.
Secondary data:
When an investigator uses data, which have already been collected by others, such data are called secondary data. Data gathered or compiled from published and unpublished sources.
Two different methods of collecting data:
Extraction of data from self – administered questionnaire
Direct investigation-measurement (observation) of the subject and interviewing (face-to-face, telephone)
first step is to decide on which of these three methods to use.
Methods of data Presentation:
Textual Method: – a narrative description of the data gathered.
Tabular Method or frequency distribution :– a systematic arrangement of information into columns and rows.
Graphical Method :– an illustrative description of the data.
The frequency distribution table:
A statistical table showing the frequency or number of observations contained in each of the defined classes or categories.
Frequency distribution: is a basic techniques that provide rich insights into the data and lay the foundation for more advanced analysis.
A frequency distribution table: lists categories of scores along with their corresponding frequencies.
Frequency distribution:
It is a grouping of all the (numerical) observations into intervals or classes together with a count of the number of observations that fall in each interval or class.
A frequency distribution has two main parts:
The values of the variable (if quantitative) or the categories (if qualitative), and
The number of observations (frequency) corresponding to the values or categories.
There are two types of Frequency distributions:
Categorical (or qualitative) Numerical (or quantitative)
Categorical Frequency Distribution:
Data are classified according to non-numerical categories. Categories must be mutually exclusive.
Used to present nominal and ordinal data
Nominal data: Here the construction is straight forward: count the occurrences in each category and find the totals.
Example: The martial status of 60 adults classified as single, married, divorced and widowed is presented in a FD as below:
Ordinal data:The construction is identical to the nominal case. How ever, the categories should be put in an ordered manner
Example: Satisfaction of hospital admission in a hospital size of 80 is presented as.
More Related Content
Similar to Unit 2. Introduction to Quantitative & Qualitative Reseaerch.pptx
Study designs, Epidemiological study design, Types of studiesDr Lipilekha Patnaik
Study design, Epidemiological study designA study design is a specific plan or protocol
for conducting the study, which allows the investigator to translate the conceptual hypothesis into an operational one.
This is lesson 6 of the course on Research Methodology conducted at the Faculty of Social Sciences and Humanities of the Rajarata University of Sri Lanka
A cross-sectional study is a descriptive study in which disease and exposure status are measured simultaneously in a given population.
It measures
the prevalence of health outcomes(also called prevalence study)
or determinants of health,
or both,
In a population at a point in time or over a short period.
When the investigator draws a sample out of the study population of interest and examines all the subjects to detect
those having the disease/outcome
and those not having this disease/outcome of interest.
At the same time, finds out whether or not they have the presence of
the suspected cause (exposure)
(or give a History of such exposure in the past),
is called the Cross-sectional analytic study.
This is an easiest power-point slide you will get on topic Epidemiology. It’s basic of Epidemiology. This ppt includes difference between observational study & experimental study. Classification of Epidemiological study. You can read this & have an overview of Epidemiological study design in short. This power point will help you regarding understanding Epidemiological study. Including cohort study, case control study, descriptive study. This includes advantage & disadvantage of many studies of Epidemiological study design such ase cohort study, case control study, analytical study. It was our group presentation so we made with all our affords. I was the leader of our team I can assure you, you won’t get disappointment after studying this slides.
Unit 12. Limitations & Recomendations.pptxshakirRahman10
Limitations & Recommendations:
Objectives:
Enlist theoretical and methodological/procedural limitation
Discuss the importance of study to give recommendations at organizational, national, international level.
Discussion Section:
The discussion section is where the researcher delve into the meaning, importance, and relevance of results.
It should focus on explaining and evaluating what you found, showing how it relates to your literature review and paper or dissertation topic, and making an argument in support of your overall conclusion. It should not be a second results section.
There are different ways to write this section, but you can focus your writing around these key elements:
Summary:
A brief recap of your key results
Interpretations:
What do your results mean?
Implications:
Why do your results matter?
Limitations:
What can’t your results tell us?
Recommendations:
Avenues for further studies or analyses.
Not to Include in Discussion Section:
There are a few common mistakes to avoid when writing the discussion section of your paper.
Don’t introduce new results: You should only discuss the data that you have already reported in your results section.
Don’t make inflated claims: Avoid over interpretation and speculation that isn’t directly supported by your data.
Don’t undermine your research: The discussion of limitations should aim to strengthen your credibility, not emphasize weaknesses or failures.
Step 1: Summarize your key findings:
Start this section by reiterating your research problem and concisely summarizing your major findings.
Don’t just repeat all the data you have already reported—aim for a clear statement of the overall result that directly answers your main research question.
This should be no more than one paragraph.
Many students struggle with the differences between a discussion section and a results section.
The crux of the matter is that your results sections should present your results, and your discussion section should subjectively evaluate them.
Examples: Summarization sentence starters;
The results indicate that…
The study demonstrates a correlation between…
This analysis supports the theory that…
The data suggest that…
Step 2: Give your interpretations:
The meaning of your results may seem obvious to you, but it’s important to spell out their significance for your reader, showing exactly how they answer your research question.
The form of your interpretations will depend on the type of research, but some typical approaches to interpreting the data include:
Identifying correlations, patterns, and relationships among the data
Discussing whether the results met your expectations or supported your hypotheses
Contextualizing your findings within previous research and theory
Explaining unexpected results and evaluating their significance
Considering possible alternative explanations and making an argument for your position.
Unit 11. Interepreting the Research Findings.pptxshakirRahman10
INTERPRETING THE RESEARCH FINDINGS.
Objectives:
At the completion of this unit learners will be able to
Discuss the different means and interpretation of data presentation/displaying through, Graphs (pie, bar, line, histogram), Tables, Charts. (spot map)
Discuss the different inferences through inferential tests and their interpretation.
Methods of Data collection and Presentation:
Methods of data collection:
Source of Data:
Statistical data may be obtained from two sources, namely, primary and secondary.
Primary data:
data measured or collected by the investigator or the user directly from the source. Primary sources are sources that can supply first hand information for immediate user.
Secondary data:
When an investigator uses data, which have already been collected by others, such data are called secondary data. Data gathered or compiled from published and unpublished sources.
Two different methods of collecting data:
Extraction of data from self – administered questionnaire
Direct investigation-measurement (observation) of the subject and interviewing (face-to-face, telephone)
first step is to decide on which of these three methods to use.
Methods of data Presentation:
Textual Method: – a narrative description of the data gathered.
Tabular Method or frequency distribution :– a systematic arrangement of information into columns and rows.
Graphical Method :– an illustrative description of the data.
The frequency distribution table:
A statistical table showing the frequency or number of observations contained in each of the defined classes or categories.
Frequency distribution: is a basic techniques that provide rich insights into the data and lay the foundation for more advanced analysis.
A frequency distribution table: lists categories of scores along with their corresponding frequencies.
Frequency distribution:
It is a grouping of all the (numerical) observations into intervals or classes together with a count of the number of observations that fall in each interval or class.
A frequency distribution has two main parts:
The values of the variable (if quantitative) or the categories (if qualitative), and
The number of observations (frequency) corresponding to the values or categories.
There are two types of Frequency distributions:
Categorical (or qualitative) Numerical (or quantitative)
Categorical Frequency Distribution:
Data are classified according to non-numerical categories. Categories must be mutually exclusive.
Used to present nominal and ordinal data
Nominal data: Here the construction is straight forward: count the occurrences in each category and find the totals.
Example: The martial status of 60 adults classified as single, married, divorced and widowed is presented in a FD as below:
Ordinal data:The construction is identical to the nominal case. How ever, the categories should be put in an ordered manner
Example: Satisfaction of hospital admission in a hospital size of 80 is presented as.
Data Collection & Data Analysis:
Objectives:
Discuss the term data collection and various ways of data collection, including training of data collectors
Discuss the types of data and various methods of data collection.
Run the statistical software for quantitative, qualitative and outcome research.
Know the salient features of data entry and analysis soft wares, i.e SPSS and NVIVO
Apply appropriate statistical test.
Data Collection:
“The process of gathering and measuring information on variables of interest, in an established systematic fashion that enables one to answer queries, stated research questions, test hypotheses, and evaluate outcomes.”
Data Collection Sources:
Primary
Secondary
Interviews:
The researcher asks questions of a large sampling of people, either by direct interviews or means of mass communication such as by phone or mail. This method is by far the most common means of data gathering.
Projective Data Gathering:
Projective data gathering is an indirect interview, used when potential respondents know why they're being asked questions and hesitate to answer.
For instance, someone may be reluctant to answer questions about their phone service if a cell phone carrier representative poses the questions. With projective data gathering, the interviewees get an incomplete question, and they must fill in the rest, using their opinions, feelings, and attitudes.
Delphi Technique:
The Oracle at Delphi, according to Greek mythology, was the high priestess of Apollo’s temple, who gave advice, prophecies, and counsel. In the realm of data collection, researchers use the Delphi technique by gathering information from a panel of experts. Each expert answers questions in their field of specialty, and the replies are consolidated into a single opinion.
Focus Groups:
Focus groups, like interviews, are a commonly used technique. The group consists of anywhere from a half-dozen to a dozen people, led by a moderator, brought together to discuss the issue.
Questionnaires:
Questionnaires are a simple, straightforward data collection method. Respondents get a series of questions, either open or close-ended, related to the matter at hand.
Secondary Data Collection.
Unlike primary data collection, there are no specific collection methods. Instead, since the information has already been collected, the researcher consults various data sources, such as:
Financial Statements
Sales Reports
Retailer/Distributor/Deal Feedback
Customer Personal Information (e.g., name, address, age, contact info)
Business Journals
Government Records (e.g., census, tax records, Social Security info)
Trade/Business Magazines
The internet.
Qualitative data analysis:
Qualitative data is analyzed via two approaches:
Thematic Analysis (Braun & Clarke 2006)
Content Analysis (Creswell 2013)
Data Collection Tools: Validity & Reliability.
Objectives:
Discuss types of measurement tools for collecting data for quantitative, qualitative and outcome research.
Differentiate between interview guide and interview schedule
Discuss reliability and validity of questionnaires.
Data:
The set of values collected for the variable of each of the elements belonging to the sample
Data sources include (Quantitative)
Surveys where there are a large number of respondents (esp where you have used a Likert scale)
Questionnaires, data collection tools/ instruments
Observations (counts of numbers and/or coding data into numbers)
Secondary data (government data; SATs scores etc)
Analysis techniques include hypothesis testing, correlations and cluster analysis.
Data sources include (Qualitative)
Interviews (structured, semi-structured or unstructured)
Focus groups
Questionnaires or surveys
Secondary data, including diaries, self-reporting, written accounts of past events/archive data and company reports;
Direct observations – may also be recorded (video/audio)
Ethnography
Data analysis; thematic or content analysis .
Data Collection:
“The process of gathering and measuring information on variables of interest, in an established systematic fashion that enables one to answer queries, stated research questions, test hypotheses, and evaluate outcomes.”
Data Collection Methods:
Surveys, quizzes, and questionnaires
Interviews
Focus groups
Direct observations
Documents and records.
Data Collection Tools for Quantitative Research:
Closed-ended Surveys and Online Quizzes
Closed-ended surveys and online quizzes are based on questions that give respondents predefined answer options to opt for. There are two main types of closed-ended surveys – those based on categorical and those based on interval/ratio questions.
Categorical survey questions can be further classified into dichotomous (‘yes/no’), multiple-choice questions, or checkbox questions and can be answered with a simple “yes” or “no” or a specific piece of predefined information.
Interval/ratio questions, on the other hand, can consist of rating-scale, Likert-scale, or matrix questions and involve a set of predefined values to choose from on a fixed scale.
Data Collection Tools for Qualitative Research:
1. Open-Ended Surveys and Questionnaires
Opposite to closed-ended are open-ended surveys and questionnaires. The main difference between the two is the fact that closed-ended surveys offer predefined answer options the respondent must choose from, whereas open-ended surveys allow the respondents much more freedom and flexibility when providing their answers.
2. In-depth Interviews/ Face to Face Interviews
One-on-one (or face-to-face) interviews are one of the most common types of data collection methods in qualitative research. Here, the interviewer collects data directly from the interviewee.
Sample size Calculation:
Objectives:
Calculate sample size according to particular type of research, and purpose.
Identify and select various software to calculate sample size according to particular type of research, and purpose.
Why to calculate sample size?
To show that under certain conditions, the hypothesis test has a good chance of showing a desired difference (if it exists)
To show to the IRB committee and funding agency that the study has a reasonable chance to obtain a conclusive result
To show that the necessary resources (human, monetary, time) will be minimized and well utilized.
Most Important: sample size calculation is an educated guess
It is more appropriate for studies involving hypothesis testing
There is no magic involved; only statistical and mathematical logic and some algebra
Researchers need to know something about what they are measuring and how it varies in the population of interest.
SAMPLE SIZE:
How many subjects are needed to assure a given probability of detecting a statistically significant effect of a given magnitude if one truly exists?
POWER:
If a limited pool of subjects is available, what is the likelihood of finding a statistically significant effect of a given magnitude if one truly exists?
Before We Can Determine Sample Size We Need To Answer The Following:
1. What is the primary objective of the study?
2. What is the main outcome measure?
Is it a continuous or dichotomous outcome?
3. How will the data be analyzed to detect a group difference?
4. How small a difference is clinically important to detect?
5. How much variability is in our target population?
6. What is the desired and ?
7. What is the anticipated drop out and non-response % ?
Where do we get this knowledge?
Previous published studies
Pilot studies
If information is lacking, there is no good way to calculate the sample size.
Type I error: Rejecting H0 when H0 is true
: The type I error rate.
Type II error: Failing to reject H0 when H0 is false
: The type II error rate
Power (1 - ): Probability of detecting group difference given the size of the effect () and the sample size of the trial (N).
Estimation of Sample Size by Three ways:
By using
(1) Formulae (manual calculations)
(2) Sample size tables or Nomogram
(3) Softwares.
SAMPLE SIZE FOR ADEQUATE PRECISION:
In a descriptive study,
Summary statistics (mean, proportion)
Reliability (or) precision
By giving “confidence interval”
Wider the C.I – sample statistic is not reliable and it may not give an accurate estimate of the true value of the population parameter.
Sample size calculation for cross sectional studies/surveys:
Cross sectional studies or cross sectional survey are done to estimate a population parameter like prevalence of some disease in a community or finding the average value of some quantitative variable in a population.
Sample size formula for qualitative variable and quantities variable are different.
Samples, Sampling measurement tools, Instruments:
Objectives:
1. Define the term population sample and sampling.
2. Calculate sample size according to particular type of research, and purpose.
3. Identify and select various software to calculate sample size according to particular type of research, and purpose.
4. Discuss types of measurement tools for collecting data from quantitative, qualitative and outcome research.
5. Differentiate between interview guide and interview schedule
6. Discuss reliability and validity of questionnaires
7. Establish reliability and validity of questionnaires
Definitions:
Population vs. Sample
Population
The set of all the measurements of interest to the investigator.
Monthly income of households in Pakistan
Number of TB Patients in Pakistan
All the patients visited emergency of the ABC Hospital in the year 2014
Neonatal mortality in Pakistan.
Sample
It is a group of subjects selected from a population
A random sample is a good representative of population
Example
A survey of 1,000 households taken from all parts of Pakistan to assess their monthly income.
Parameter vs. Statistics:
Parameter
– The characteristics of interest to the researcher in the population is called a parameter.
E.g. average household size and percent of households with modern sanitation as reported in the 1998 census of Karachi
Statistic
– The characteristics of interest to the researcher in the sub-set of population is called a statistic.
E.g. average household size and percent of households as reported from a sample survey of 6,000 households in Karachi, 2010.
Examples:
Parameter:
Average monthly income of households in Pakistan
Proportion of households in Karachi who have at least one special child at their residence
Prevalence of COVID 19 in Pakistan
Statistic:
If taken from a sample each one of above is called statistic.
Sampling:
A process of selecting units (e.g., people, organizations) from a population of interest so that by studying the sample may fairly generalize results back to the population from which they were chosen.
Types of Sampling Plans:
Probability Sampling:
Simple random sampling
Systematic sampling
Stratified sampling
Cluster sampling
Multi-stage sampling
Simple Random Sampling:
In simple random sampling, every subject has an equal chance of being selected for the study.
Individuals who make up the subset of the larger group are chosen at random, each individual in the large population set has the same probability of being selected.
Most statisticians agree that the minimum sample size to get any kind of meaningful result is 100. If the population is less than 100 then you really need to survey all of them.
Random sampling is used in science to conduct randomized control tests or for blinded experiments.
Approaches in Simple Random Sampling:
Method of lottery
Using the lottery method is one of the oldest ways and is a mechanical example of random sample.
Unit 8. Ethical Considerations in Reseaerch.pptxshakirRahman10
Ethical Consideration in Research:
Objectives:
1. Define the terms related to ethics in research
2. Discuss historical events of ethical mischiefs and evolution of ethics as protecting human rights
3. Discuss the ethical principles, declaration of Helsinki and research code of ethics
4. Describe different types of informed consent, i.e. verbal, written, individual and institutional consent.
5. Produce a meaningful informed consent form.
6. Identify role and importance of ethical considerations in research.
Ethical Considerations in Research:
Ethical considerations in research are a set of principles that guide the research designs and practices.
Scientists and researchers must always adhere to a certain code of conduct when collecting data from people.
The goals of human research often include understanding real-life phenomena, studying effective treatments, investigating behaviors, and improving lives in other ways.
What you decide to research and how you conduct that research involve key ethical considerations.
Ethical considerations work to:
Protect the rights of research participants
Enhance research validity
Maintain scientific or academic integrity.
History of Research Ethics:
Nuremberg Code
Dec. 9, 1946, when an American military tribunal opened criminal proceedings against 23 leading German physicians and administrators for their willing participation in war crimes and crimes against humanity.
Among the charges were that German physicians conducted medical experiments on thousands of concentration camp prisoners without their consent. Most of the subjects of these experiments died or were permanently crippled as a result.
As a direct result of the trial, the Nuremberg Code was established in 1948, stating that “The voluntary consent of the human subject is absolutely essential,” making it clear that subjects should give consent and that the benefits of research must outweigh the risks.
Although it did not carry the force of law, the Nuremberg Code was the first international document which advocated voluntary participation and informed consent.
Thalidomide
In the late 1950s, thalidomide was approved as a sedative in Europe; it was not approved in the United States by the FDA.
The drug was prescribed to control sleep and nausea throughout pregnancy, but it was soon found that taking this drug during pregnancy caused severe deformities in the fetus.
Many patients did not know they were taking a drug that was not approved for use by the FDA, nor did they give informed consent. Some 12,000 babies were born with severe deformities due to thalidomide.
U.S. Senate hearings followed and in 1962 the so-called “Kefauver Amendments” to the Food, Drug, and Cosmetic Act were passed into law to ensure drug efficacy and greater drug safety.
For the first time, drug manufacturers were required to prove to the FDA the effectiveness of their products before marketing them.
Unit 7. Theoritical & Conceptual Framework.pptxshakirRahman10
THEORETICAL AND CONCEPTUAL FRAMEWORKS:
objectives:
1. Discuss the different types of models and frameworks used in research framework
2. Discuss the use of theoretical/conceptual frameworks and models in the research.
3. Differentiate theoretical/conceptual frameworks and models
4. Recognize the best suit theory or theoretical model/framework for particular research study
5. Develop conceptual models/framework, best suit for particular research study.
What is a theoretical framework?
A theoretical framework is a summary of the researcher’s theory regarding a particular problem that is developed through a review of previously tested knowledge of variables involved. It identifies a plan for investigation and interpretation of the findings.
It relates to philosophical basis on which the research takes place and form the link between the theoretical aspects and practical components of the investigation undertaken. Therefore it’’ has implications for every decision made in the research process".
Theoretical framework can be considered as a conceptual model that establishes a sense of structure that guides the research process. It includes the variables a researcher intends to measure and relationships he/she seeks to understand. Essentially, this is where a researcher develops a “theory” and build his/her case for investigating that theory.
The theoretical framework is the researcher’s presentation of a theory that explains a particular problem and it is not based on his/her suspicions alone.
Theoretical framework is presented in the early section of a dissertation mainly in chapter two of the report and provides the rationale for conducting your research to investigate a particular research problem.
It involves a well-supported rationale and is organized in a manner that helps the reader understand and asses the perspective of the researcher.
When developing a theoretical framework:
The researcher start by describing what is known about the variables involved, what is known about their relationship, and what can be explained thus far.
One need to investigate other researchers’ theories behind these relationships and identify a theory (or a combination of theories) that explain his/her major research problem.
The researcher need to consider alternative theories that might challenge his/her perspective.
One also considers the limitations associated with his/her theory and quite possibly that problem could be better understood by other theoretical frameworks.
Significance of a theoretical framework:
It helps the researcher to consider other possible frameworks and to reduce biases that may sway the researcher’s interpretation.
It clarifies researcher’s implicit theory in a manner that is more clearly defined.
It demonstrates that the relationships proposed by the researcher are not based on his/her personal instincts or guesses, but rather formed from facts obtained from authors of previous research.
Unit 6. Literature Review & Synthesis.pptxshakirRahman10
Literature Review:
Objectives:
Define literature review and related terms
Identify theoretical and empirical literature and their resources
Locate search engines and literature data bases like Cochrane, CINHAL, PubMed etc
Utilize data bases by retrieving required data
Identify framework to synthesize and organize the literature, such as traditional hierarchy/level of evidence.
INTRODUCTION:
It is one of the most important steps in research process. It is an account of what is already known about particular phenomenon.
The main purpose is to convey to the readers about the work already done and knowledge and ideas that have been already established on a particular topic of research.
DEFINITION:
It is a body of text that aims to review the critical points of knowledge on a particular topic of research.
It is an account of what has been already established or published on a particular research topic by accredited scholars and researchers.
IMPORTANCE:
Identification of research problem and refinement of research questions
Generation of useful research questions or projects
Orientation of what is known and not known about an area of inquiry
Determine any gaps in the body of knowledge
Discovery of unanswered questions about subjects, concepts or problems.
Identification of relevant conceptual framework
Identification of development of new or redefined clinical intervention
Development of hypothesis to be tested in research instruments
Helps in planning the methodology of present study.
PURPOSES:
Describe the relationship of each study to other research study under consideration.
Identify new ways to interpret on any gaps in previous research
Resolve conflicts amongst seemingly contradictions previous studies
Identify areas of prior scholarship to prevent duplication of effort.
See what has and has not been investigated
Identify potential relationships between concepts and identify researchable hypothesis
Develop alternative research projects
Learn how others have defined and measured key concepts.
SOURCES:
Primary Sources:
Literature review mostly relies on primary source (i.e) research reports, which are description of studies written by researchers who conducted them. Primary source is written by a person who developed the theory or conducted the research or is the description of an investigation written by the person who conducted it.
Secondary Sources:
Secondary source research documents or description of studies prepared by someone other than the original research.
Main sources:
Electronic database
Books
Journals
Conference Papers
Theses
Encyclopedia and Dictionary
Research Reports
Magazines and Newspaper.
Databases:
CINAHL (Cumulative Index to Nursing and Allied Health Literature)
MEDLINE (Medical Literature Analysis and Retrieved System Online)
PUBMED
Medline Plus
Education Resource Information Center
British Nursing Index
Web of Science
Science Direct
Google Scholar.
Unit 5. Research Question and Hypothesis.pptxshakirRahman10
Research Question and Hypothesis:
Objectives:
Identify variables in the study, to formulate research question and hypothesis
Formulate research question, which is to be answered statistically and logically
Formulate null hypothesis and test able research hypothesis, which is to be answered statistically.
Explore and select the appropriate statistical measures for selected research question
Justify the appropriateness of selected statistical test, chosen for the testing question and hypothesis
Interpret the selected statistical test, chosen for the testing question and hypothesis in statistical manner
Inference the selected statistical test, chosen for the testing question and hypothesis in statistical manner.
Variable:
A characteristic, attribute of a person or object that differs among the persons or object being studied (eg. Age, sex, blood type etc.)
Classification of research variables:
One variable study/ univariate study
“what sources of work stress are identified by thoracic care unit nurses?”
Two variables study/bivariate study
One is dependent and the other is independent
Ex. Is there a correlation between the number of sources of stress reported by nurses in a thoracic intensive care. The independent variable is “ the number of reported sources of stress.” and the dependent variable is the desire to leave to leave employment in the thoracic intensive care unit.”
Multi-variables study/ multivariate study
More than two variables are examined in a study
Ex. Why clients do not take their medications as directed after they are discharged?
Why do nursing students pass/fail the examination?
Types of Variables:
Independent variable
The “cause” or the variable thought to influence the dependent variable in experimental research it is the variable manipulated by the researcher.
Dependent variable
The “effect” a response or behavior that is influenced by the independent variable; sometimes called criterion variable.
Intervening variables
Comes between dependent and independent variable
Extraneous variable
Influence can be change
Dichotomous variable
Two choice or result (male/female)
Polychotomous variables
Multiple variables
Research Question:
Specific question that the researcher expects to be answered in a study.
Should specify the variables and the population that are being studied
Example;
“Is there a difference in anxiety levels of women about to undergo hysterectomy between those women who receive a back rub and those who not receive a back rub?”
Formulating a Research Question:
Research questions for studies that examine more than one variable are usually written as correlational statement or comparative statement.
1. Correlational Statement
(dependent and independent)
“ Is there a correlation between anxiety and midterm scores of baccalaureate nursing students?”
Unit 4. Research Problem, Purpose, Objectives, Significance and Scope..pptxshakirRahman10
Research Problem, Purpose, Objectives, Significance and Scope:
Objectives:
1. Identify the interest area of research
2. Discuss the problem statement and research purpose
3. Develop objectives of research
4. Elaborate on significance and scope of the research
5. Differentiate between significance and scope of the research.
Research Proposal:
A research proposal describes what you will investigate, how will you carry out your research, and why the research is essential to be conducted.
It should be noted that the proposal acts as an introduction of a thesis/dissertation or a project report.
The proposal helps the researcher to think practically and to be on the right track during the research process.
Almost all students who intend to write Bachelor’s, Master, or Ph.D. thesis/dissertation or those who intend to apply for scholarships or research grants, need to write a research proposal.
Attributes of Good Research Proposal:
It is innovative and contains impressive research idea(s).
The research questions and objectives are clear.
The methodology and data sources are well known.
The significance of the study is justified.
The objectives of the study could be met within the timeline.
The writing style is clear and concise, and there is no ambiguity.
There is no contradiction in objectives, research questions, and methodology.
The budget and the proposal narrative are consistent.
Contents of the Thesis/Dissertation Proposal:
Title of Study
Abstract
Introduction
Significance of the Study
Research Questions
Research Objectives
Research Hypothesis
Review of Literature
Methodology
Data Sources
Tentative Table of Content of Thesis
References.
Title of Study:
It should be appealing and meaningful.
It should not be a single word.
It should be short and self-explanatory.
It should reflect the study properly.
It should not be a conclusion.
It should not be contradictory to the methodology.
Abstract:
It motivates the reader to read the full text.
It is a brief overview of the proposal, consisting of 100 to 300 words.
It summarizes the essential elements of the research proposal.
It may not cite the existing relevant literature.
It may summarize the methods, results, and implications.
Introduction:
It highlights the nature of the problem.
It discusses the background of the problem.
It explains the current situation of the problem.
It discusses the significance of the study.
It states the research question(s) and the research objectives of the study.
It mentions the limitations of the study (if any).
It explains the structure of the study.
Identify the interest area of research:
Clinical Practice
Nursing Education
Community/ Public Health
Literature Review
Theories
Research Priorities
Peer Interaction.
Introduction to Outcome Research
Objectives:
1. Define the terms related to outcome research
2. Discuss basis of outcome research with relation to Donabedian‟s theory.
3. Describe methods/approaches/types of outcome research.
4. Understand methodologies of outcome research.
Outcome Research:
Outcomes research is a broad umbrella term without a consistent definition.
It tends to describe research that is concerned with the effectiveness of public-health interventions and health services; that is, the outcomes of these services.
Aimed at assessing the quality and effectiveness of health care as measured by the attainment of a specified end result or outcome.
Measures include parameters such as improved health, lowered morbidity or mortality, and improvement of abnormal states (such as elevated blood pressure).
Theoretical Basis of Outcomes Research:
The theorist Avedis Donabedian (1966) proposed a theory of quality health care and the process of evaluating it.
The three dimensions of the model are health, subjects of care, and providers of care.
The concept of health has Three aspects; Physical-physiological function, Psychological function, and Social function.
The concept subjects of care has two primary aspects: patient and person.
A patient is defined as someone who has already gained access to some care, and a person as someone who may or may not have gained access to care.
Each of these concepts is further categorized by the concepts individual and aggregate.
Within patient, the aggregate is a caseload; within person, the aggregate is a target population or a community.
The concept providers of care shows levels of aggregation and organization of providers.
The first level is the individual practitioner. At this level, consideration is given to the individual provider rather than others who might be involved in the subject’s care, whether individual or aggregate.
As the levels progress, providers of care include several practitioners, who might be of the same profession or different professions and “who may be providing care concurrently, as individuals, or jointly, as a team”.
At higher levels of aggregation, the provider of care is institutions, programs, or the healthcare system as a whole.
The essence of Donabedian’s framework is the physical-physiological function of the individual patient being cared for by the individual practitioner. Examining quality at this level is relatively simple.
When more than one practitioner is involved, both individual and joint contributions to quality must be evaluated.
Concepts such as coordination and teamwork must be conceptually and operationally defined. When a person is the subject of care, an important attribute is access.
When an aggregate is the subject of care, an important attribute is resource allocation. Access and resource allocation are interrelated, because they each define who gets care, the kind of care received, and how much care is received.
Unit I. Introduction to Nursing Research.pptxshakirRahman10
Introduction to Nursing Research:
Objectives:
Define nursing research
Describe ways of knowing in nursing (tradition, authority, borrowing, trial and error, intuition, and research )
Identify role of a nurse in research as ADN, BS, MS, PhD, and DNP
Explain Evidence Based Practice through research.
Definitions:
Research: It is a systematic, formal, rigorous, and precise process used to gain solutions to problems or discover and interpret new facts and relationships.
Nursing Research: is systemic inquiry designed to develop knowledge about issues of importance to nurses, including nursing practice, nursing education, and nursing administration.
Research-based Practice: using research findings to inform the decisions, actions, and interaction of nurses with clients.
Importance of research in nursing:
Emphasizing on the development and utilization of nursing knowledge, which is essential for continued improvement in patient care.
Nurses' need to document the effectiveness of their practices not only to the profession, but also to the clients, administrators, and other professionals. - (Thus research findings help them to eliminate nursing actions that do not achieve desired outcomes or to identify the practices that alter health care outcomes and contain costs).
Nurses' need for understanding the varied dimensions of their profession, (theoretical, ethical, practical dimensions, etc.)
4. Research enables nurses to describe:
The characteristics of a particular nursing situation about which little is known.
Explain phenomena that must be considered in planning nursing care.
Predict the probable outcomes of certain nursing decisions.
Control the occurrence of undesired outcomes.
Initiate activities to promote desired client behavior.
Roles of nurses in nursing research:
It is every nurse's responsibility to engage in one or more roles along the research participation:
Indirect participation:
This is a minimum nurse involvement in a research responsibility. It is done when a nurse read a research report to keep up-to-date on relevant findings that may affect their practice. This level is called "research utilization".
Research Utilization: "Is the use of the research findings in a practice setting"
2. Direct participation: in which nurses are nursing research producers. They are actively participating in designing and implementing research studies.
3. Between these two dimensions of research participation, there are a variety of roles for nurses to play, from these roles:
Attending research presentations at professional conferences.
Evaluating completed research for its possible use in practice.
Discussing the implications and relevance of research findings with clients.
Giving clients information and advice about participation in studies.
Assisting in the collection of research information.
Analysis of Variance ANOVA (F test):
It is the method of testing and comparing three or more means.
It is an extension of t test for two independent samples.
ASSUMPTIONS:
The populations from which the samples were obtained must be normally or approximately normally distributed.
The samples must be independent of each other.
The variances of the population must be equal.
SOURCES OF VARIABILITY:
Total variation among scores
Within group Variation
Between group Variation
Sample size need not to be equal
Its always right tail
Objectives:
Draw a scatter plot for a set of ordered pairs.
Compute the correlation coefficient.
Test the hypothesis H0: ρ = 0.
Compute the equation of the regression line.
Introduction:
In addition to hypothesis testing and confidence intervals, inferential statistics involves determining whether a relationship between two or more numerical or quantitative variables exists.
Correlation is a statistical method used to determine whether a linear relationship between variables exists.
Regression is a statistical method used to describe the nature of the relationship between variables—that is, positive or negative, linear or nonlinear.
Correlation coefficient, is a numerical measure to determine whether two or more variables are related and to determine the strength of the relationship between or among the variables.
In a simple relationship, there are two variables: an independent variable (predictor variable) and a dependent variable (response variable).
The stronger the relationship is between variables, the more accurate the prediction is.
Scatter Plots and Correlation:
A scatter plot is a graph of the ordered pairs (x, y) of numbers consisting of the independent variable x and the dependent variable y.
Correlation:
The correlation coefficient computed from the sample data measures the strength and direction of a linear relationship between two variables.
The symbol for the sample correlation coefficient is r. The symbol for the population correlation coefficient is .
The range of the correlation coefficient is from 1 to 1.
If there is a strong positive linear relationship between the variables, the value of r will be close to 1.
If there is a strong negative linear relationship between the variables, the value of r will be close to 1.
Possible Relationships Between Variables:
When the null hypothesis has been rejected for a specific a value, any of the following five possibilities can exist.
There is a direct cause-and-effect relationship between the variables. That is, x causes y.
There is a reverse cause-and-effect relationship between the variables. That is, y causes x.
The relationship between the variables may be caused by a third variable.
There may be a complexity of interrelationships among many variables.
The relationship may be coincidental.
Regression:
If the value of the correlation coefficient is significant, the next step is to determine the equation of the regression line which is the data’s line of best fit.
Best fit means that the sum of the squares of the vertical distance from each point to the line is at a minimum.
Procedure Table:
Step 1: Make a table with subject, x, y, xy, x2, and y2 columns.
Step 2: Find the values of xy, x2, and y2. Place them in the appropriate columns and sum each column.
Step 3: Substitute in the formula to find the value of r.
Step 4: When r is significant, substitute in the formulas to find the values of a and b for the regression line equation y = a + bx.
OBJECTIVES:
Recognize the differences between categorical data and continuous data
Discuss assumptions of chi square distribution
Correctly interpret and use the terms:
chi-square test of independence,
contingency table
degrees of freedom,
“2x2” and “r x c” table.
Calculate expected numbers of the cells of a contingency table .
Calculate chi-square test statistic and its appropriate degrees of freedom.
Refer the chi-square table to obtain tabulated value.
Categorical variables take on values that are names or labels, such as ethnicity (e.g., Sindhi, Punjabi, Balochi etc.) and methods of teaching (e.g. lecture, discussion, activity based etc.)
Quantitative variables are numerical. They represent a measurable quantity. For example, the number of students taking Biostatistics Supplementary classes .
CHI-SQUARE TEST:
It is used to determine whether there is a significant association between the two categorical variables from a single population.
CHI-SQUARE DISTRIBUTION PROPERTIES:
As the degrees of freedom increases, the chi-square
curve approaches a normal distribution
It has many shapes which are based on its degree of freedom (df)
Distribution is skewed to the right
A chi-square distribution takes positive values only.
Commonly used approaches are:
Test for independence
Test of homogeneity
CHI-SQUARE TEST OF INDEPENDENCE:
A chi-square test of independence is used when we want to see if there is a relationship/association between two categorical variables.
EXAMPLES OF RELATIONSHIPS
BETWEEN QUALITATIVE VARIABLES:
Qualitative variables are either ordinal or nominal.
Examples:
Do the nurses feel differently about a new postoperative procedure than doctors?
Preference (Old/New) Subjects (Nurses/ Doctors)
Is there any relationship between Soya Use & Lung cancer?
Soya Intake (yes/no) Lung cancer (yes/no)
Is there any relationship between parent’s and their children Children’s Education (Illiterate/Up to Intermediate/Graduate)
education?
Parent’s Education (Illiterate/Up to Intermediate/Graduate)
CONTINGENCY TABLE:
The table which classifies categories of the qualitative
variable.
The number of individuals or items assigned to each category is called the frequency.
WHAT INFORMATION DOES CONTINGENCY TABLE REVEAL?
When we consider two categorical variables at a time, then an observation will belong to a particular category of variable one as well as a particular category of variable two. This type of table is referred as contingency table.
The simplest form of contingency table is a 2x2 contingency table with both
variables having exactly two categories.
WHAT OTHER INFORMATION DOES
CONTINGENCY TABLE REVEAL?
In this table Two independent categorical variables that
form a “r x c” contingency table, where “r” is the number of rows (number of categories in first variable e.g. helmet used at the time of accident or not?) and “c” is the number of columns (number of categories in the second variable e.g. got severe brain injury.
OBJECTIVES:
Run the test of hypothesis for mean difference using paired samples. Construct a confidence interval for the difference in population means using paired samples.
Observation of interest will be the difference in the readings
before and after intervention called paired difference observation.
Paired t test:
A paired t-test is used to compare two means where you have two samples in which observations in one sample can be paired with observations in the other sample.
Examples of where this might occur are:
Before-and-after observations on the same subjects (e.g. students’ test
results before and after a particular module or course).
A comparison of two different methods of measurement or two different treatments where the measurements/treatments are applied to the same subjects (e.g. blood pressure measurements using a sphygmomanometer and a dynamap).
When there is a relationship between the groups, such as identical twins.
This test is concerned with the pair-wise differences
between sets of data.
This means that each data point in one group has a related data point in the other group (groups always have equal numbers).
ASSUMPTIONS:
The sample or samples are randomly selected
The sample data are dependent
The distribution of differences is approximately normally
distributed.
Note: The under root is onto the entire numerator and denominator, so you should take the root after solving it entirely
where “t” has (n-1) degrees of freedom and “n” is
the total number of pairs.
Lecture 10 t –test for Two Independent Samples.pptxshakirRahman10
t - test for two independent samples:
If there is no connection between two samples then Perform t- test for two independent samples.
Compare means of two groups
Experimental—treatment versus control
Existing groups—males versus females.
Underlying Assumptions for Independent Samples t-test:
The samples have been randomly selected from normally distributed populations
The samples are independent of each other
Population variances 12 and 22 are unknown
4. In order to estimate the unknown population variances, there are two ways:
– If the two population variances are assumed to be equal i.e. 12 = 22 , a pooled variance is calculated as an estimate of the unknown population variances
– If the two population variances are assumed to be
unequal i.e. 12 ≠ 22, a different formula is used.
Objectives:
Generate of t-test.
Learn about the assumptions of t-test.
Calculate t-test.
Construct the confidence interval for the population mean.
Recall steps for z test:
1. State null and alternative hypothesis.
2. Determine the level of significance
3. Apply test statistics.
4. Identify critical region/ p-value.
5. Interpret the result.
Need of t test:
When population standard deviation is known or sample is large enough that sample population deviation will represent population’s standard deviation. We can used z-test or standard normal distribution.
What do we do if population standard deviation is not known and the sample size is less than 30?
T distribution:
Also known as student’s test.
Identified by William Goset.
Similarities between z and t distribution:
Bell Shaped
It is symmetric around the mean.
Mean, median, and the mode are plot at zero which is at the center of bell shape curve.
The curve does not touch the x-axis.
Differences between z and t distribution:
T- distribution is associated with degrees of freedom.
Degree of freedom is (n-1) and is associated with sample size.
Degree of freedom are the number of values that are free to vary after a sample statistics has been computed.
It tells the research which t curve to use.
With the increase in sample size, the t distribution approaches the standard normal distribution.
When to use t test:
Standard deviation of population is unknown. Use the s (standard deviation).
if sample size less than 30 so normal distribution should be ensured.
Steps for hypothesis testing for t test:
State null and alternative hypothesis.
Determine the level of significance
Apply test statistics.
Identify critical region/ p-value.
Interpret the result.
Objectives:
Define the Type I & Type II errors
How to interpret the Type I & Type II errors
Understand the power of a test and factors affecting power.
Computation of p-value for Z test (large sample)
Report appropriate conclusion based on p-value.
Types of Errors:
Type I error: Null hypothesis is actually true but the
decision is to reject it.
Type II error: Null hypothesis is actually false but our
decision is fail to reject.
There is always a chance of making one of these errors. We’ll want to minimize the chance of doing so!
Definitions:
Type I error is committed if we reject the null hypothesis when it is true. The probability of a type I error is denoted by the symbol ()
– = P(reject Ho|Ho is true)
Type II error is committed if we fail to reject the null hypothesis when it is false. The probability of a type II error is denoted by the symbol ()
= P(fail to reject Ho|Ho is false)
Chances of Error:
If the conclusion of a test of hypothesis is FAIL TO
REJECT H0 then it means that:
There is no effect, i.e. H0 is true.
Or we have made a Type II error.
If the conclusion of a test of hypothesis is FAIL TO
REJECT H0 then it means that:
There is no effect, i.e. H0 is true.
Or we have made a Type II error.
If the conclusion of a test of hypothesis is to REJECT H0 then it means that:
There is as effect, i.e. H0 is false.
Or we have made a Type I error.
Type II Error and Power:
“Power” of a test is the probability of rejecting null
hypothesis when it is false CORRECT DECISION
To minimize the type II error, we equivalently want to
maximize power.
Critical Region approach:
In this approach, we use the value of α and researcher hypothesis (Ha) to select the rejection region and then compare it with the value of test statistic for making the decision of whether to reject H0 or not.
P-value approach:
Another approach and now a days the most common approach is to report P-value and then compare it with the value of α for the decision whether to reject the null hypothesis or not.
“P-value is the area that falls in the tail beyond the value of the test-statistic. P-value is the probability of getting extreme or more extreme value than the
calculated value”
Steps for Calculating the P-value:
Choose the level of significance
Determine the value of the test statistic Zcal from the sample data. Look up the Z-statistic and find the corresponding probability:
One-tailed test: the p-value= tail area beyond Zcal in the same direction as the alternative hypothesis
Two-tailed test: the p-value= 2 times the tail area
beyond Zcal in the direction of the sign of Zcal
Reject the null hypothesis, if the p-value is less than the value of level of significance (α).
The French Revolution, which began in 1789, was a period of radical social and political upheaval in France. It marked the decline of absolute monarchies, the rise of secular and democratic republics, and the eventual rise of Napoleon Bonaparte. This revolutionary period is crucial in understanding the transition from feudalism to modernity in Europe.
For more information, visit-www.vavaclasses.com
Francesca Gottschalk - How can education support child empowerment.pptxEduSkills OECD
Francesca Gottschalk from the OECD’s Centre for Educational Research and Innovation presents at the Ask an Expert Webinar: How can education support child empowerment?
June 3, 2024 Anti-Semitism Letter Sent to MIT President Kornbluth and MIT Cor...Levi Shapiro
Letter from the Congress of the United States regarding Anti-Semitism sent June 3rd to MIT President Sally Kornbluth, MIT Corp Chair, Mark Gorenberg
Dear Dr. Kornbluth and Mr. Gorenberg,
The US House of Representatives is deeply concerned by ongoing and pervasive acts of antisemitic
harassment and intimidation at the Massachusetts Institute of Technology (MIT). Failing to act decisively to ensure a safe learning environment for all students would be a grave dereliction of your responsibilities as President of MIT and Chair of the MIT Corporation.
This Congress will not stand idly by and allow an environment hostile to Jewish students to persist. The House believes that your institution is in violation of Title VI of the Civil Rights Act, and the inability or
unwillingness to rectify this violation through action requires accountability.
Postsecondary education is a unique opportunity for students to learn and have their ideas and beliefs challenged. However, universities receiving hundreds of millions of federal funds annually have denied
students that opportunity and have been hijacked to become venues for the promotion of terrorism, antisemitic harassment and intimidation, unlawful encampments, and in some cases, assaults and riots.
The House of Representatives will not countenance the use of federal funds to indoctrinate students into hateful, antisemitic, anti-American supporters of terrorism. Investigations into campus antisemitism by the Committee on Education and the Workforce and the Committee on Ways and Means have been expanded into a Congress-wide probe across all relevant jurisdictions to address this national crisis. The undersigned Committees will conduct oversight into the use of federal funds at MIT and its learning environment under authorities granted to each Committee.
• The Committee on Education and the Workforce has been investigating your institution since December 7, 2023. The Committee has broad jurisdiction over postsecondary education, including its compliance with Title VI of the Civil Rights Act, campus safety concerns over disruptions to the learning environment, and the awarding of federal student aid under the Higher Education Act.
• The Committee on Oversight and Accountability is investigating the sources of funding and other support flowing to groups espousing pro-Hamas propaganda and engaged in antisemitic harassment and intimidation of students. The Committee on Oversight and Accountability is the principal oversight committee of the US House of Representatives and has broad authority to investigate “any matter” at “any time” under House Rule X.
• The Committee on Ways and Means has been investigating several universities since November 15, 2023, when the Committee held a hearing entitled From Ivory Towers to Dark Corners: Investigating the Nexus Between Antisemitism, Tax-Exempt Universities, and Terror Financing. The Committee followed the hearing with letters to those institutions on January 10, 202
2024.06.01 Introducing a competency framework for languag learning materials ...Sandy Millin
http://sandymillin.wordpress.com/iateflwebinar2024
Published classroom materials form the basis of syllabuses, drive teacher professional development, and have a potentially huge influence on learners, teachers and education systems. All teachers also create their own materials, whether a few sentences on a blackboard, a highly-structured fully-realised online course, or anything in between. Despite this, the knowledge and skills needed to create effective language learning materials are rarely part of teacher training, and are mostly learnt by trial and error.
Knowledge and skills frameworks, generally called competency frameworks, for ELT teachers, trainers and managers have existed for a few years now. However, until I created one for my MA dissertation, there wasn’t one drawing together what we need to know and do to be able to effectively produce language learning materials.
This webinar will introduce you to my framework, highlighting the key competencies I identified from my research. It will also show how anybody involved in language teaching (any language, not just English!), teacher training, managing schools or developing language learning materials can benefit from using the framework.
Normal Labour/ Stages of Labour/ Mechanism of LabourWasim Ak
Normal labor is also termed spontaneous labor, defined as the natural physiological process through which the fetus, placenta, and membranes are expelled from the uterus through the birth canal at term (37 to 42 weeks
Operation “Blue Star” is the only event in the history of Independent India where the state went into war with its own people. Even after about 40 years it is not clear if it was culmination of states anger over people of the region, a political game of power or start of dictatorial chapter in the democratic setup.
The people of Punjab felt alienated from main stream due to denial of their just demands during a long democratic struggle since independence. As it happen all over the word, it led to militant struggle with great loss of lives of military, police and civilian personnel. Killing of Indira Gandhi and massacre of innocent Sikhs in Delhi and other India cities was also associated with this movement.
Unit 2. Introduction to Quantitative & Qualitative Reseaerch.pptx
1.
2. Introduction to Quantitative and Qualitative
Research
Shakir Rahman
BScN, MScN, MSc Applied Psychology, PhD Nursing (Candidate)
University of Minnesota USA
Principal & Assistant Professor
Ayub International College of Nursing & AHS Peshawar
Visiting Faculty
Swabi College of Nursing & Health Sciences Swabi
Nowshera College of Nursing & Health Sciences Nowshera
7/19/2023 2
3. Objectives
At the completion of this unit learners will be able to:
1. Define the terms of qualitative and quantitative research.
2. Differentiate between qualitative and quantitative research.
3. Describe methods/approaches/types of quantitative research, i.e.
Descriptive, Co- relational, Quasi-Experimental and
Experimental research.
4. Describe methods/approaches/types of qualitative research i.e.
Phenomenological, Grounded Theory, Ethnographical, and
Historical research
5. Understand methodologies of qualitative and quantitative
research.
7/19/2023 3
4. Quantitative Research
• Attempts to explain phenomena by collecting and analysing
numerical data
• Tells if there is a “difference” but not necessarily why
• Data collected are always numerical and analysed using
statistical methods
• Variables are controlled as much as possible (RCTs as the gold
standard) so could eliminate interference and measure the effect
of any change
• Randomisation to reduce subjective bias
• If there are no numbers involved, its not quantitative
• Some types of research lend themselves better to quant
approaches than others
4
7/19/2023
5. Quantitative data
• Data sources include
– Surveys where there are a large number of respondents (esp
where you have used a Likert scale)
– Questionnaires, data collection tools/ instruments
– Observations (counts of numbers and/or coding data into
numbers)
– Secondary data (government data; SATs scores etc)
• Analysis techniques include hypothesis testing, correlations and
cluster analysis
7/19/2023 5
6. Qualitative Research
• Any research that doesn’t involve numerical data
• Instead uses observations, words, pictures, videos, audio
recordings. Field notes, expressions, and peoples’ own words.
• Tends to start with a broad question rather than a specific
hypothesis
• Develop theory rather than start with one
• Tends to yield rich data to explore how and why things happened
• Don’t need large sample sizes (in comparison to quantitative
research)
7/19/2023 6
7. Qualitative data
• Interviews (structured, semi-structured or unstructured)
• Focus groups
• Questionnaires or surveys
• Secondary data, including diaries, self-reporting, written
accounts of past events/archive data and company reports;
• Direct observations – may also be recorded (video/audio)
• Ethnography
• Data analysis; thematic or content analysis
7/19/2023 7
12. 12
Objectives at various levels
DESCRIPTIVE STUDIES
1. Knowing the frequency of disease
2. Knowing the distribution
3. Developing the hypothesis
OBSERVATIONAL
ANALYTICAL
1. Testing the hypothesis
2. Establishing association
EXPERIMENTAL OR
INTERVENTIONAL
STUDIES
1. Strength of association
2. Establishing the cause
Study Types Objectives
7/19/2023 12
13. Study Types
STUDY TYPES
Descriptive
( hypothesis formulation)
Individual based
Case studies
Case series
Population based
Ecological
Analytical/Experimental
(hypothesis testing )
Observational
Case-control
cohort
Cross-
sectional
Interventional
RCT’s (III)
Quasi-
Experimental
The researcher
studies, but does
not alter, what
occurs
The researcher
intervenes to
change reality, then
observe what
happens
7/19/2023 13
14. 14
Descriptive Studies
• Describe only; do NOT examine associations between
Exposure (E) and health Outcome (O).
• Generally the purpose is to describe the variability in a health
outcome and/or formulate hypotheses.
• A descriptive study involves describing the characteristics of
a particular situation event or case.
• Descriptive studies can be carried out on a small or larger
scale.
14
7/19/2023
15. Types of Descriptive Studies
Individual Based
Case Study
A study of one diseased individual, providing a detailed
description of an uncommon disease; provides timely or rare
information.
OR
A single patient’s clinical history is described in detail, and
then discussed in relation to the literature. Almost always a
rare unusual, or atypical case.
7/19/2023 15
16. Types of Descriptive Studies
Individual based
Case Series :
A study of multiple occurrences of unusual cases that have
similar characteristics.
Investigators can calculate the frequency of symptoms or
characteristics of people with the disease.
Results may generate causal hypotheses. Neither a case
study nor a case series includes a comparison group.
7/19/2023 16
17. Case Report
Case Series
One case of unusual
finding
Multiple cases of
finding
Descriptive Study Designs
7/19/2023 17
18. 18
Types of Descriptive Studies
Individuals Based
Cross sectional Surveys
– Subjects or institutions are surveyed in order to
describe the prevalence of health outcomes and /or
characteristics of a population
18
7/19/2023
19. 19
Descriptive Studies
Population Based
• Ecological
– An ecological study focuses on population/ groups of people
(rather than individuals) as the units of analysis.
– Ecological studies are used to understand the relationship
between outcome and exposure at a population level, where
'population' represents a group of individuals with a shared
characteristic such as geography, ethnicity, socio-economic
status of employment.
– The variables include measurements taken at the group level
e.g. infant mortality rates of different countries.
7/19/2023
24. Cross-sectional study
Information is collected from each subject at one point of time
Used to provide a snapshot of a population at a point in time
The main out-come measure is prevalence (Prevalence study)
Limited to the measurement of risk factor and out-comes at one
simultaneous point in time
Examples: screening surveys
knowledge attitude and practice (K.A.P.) surveys
7/19/2023 24
25. Target Population
Sample
Gather Data on Exposure and Disease
Exposed;
Do not
have
Disease
Not
Exposed;
Have
Disease
Not Exposed;
Do not have
Disease
Begin with:
4 groups are possible
Exposed;
Have
Disease
Determine presence or
absence of exposure &
presence or absence of
disease
7/19/2023 25
26. a b
c d
No disease
Disease
Exposed
Not
Exposed
a b
c d
a b
c d
No disease
Disease
Disease No disease
Exposed Exposed
Not
Exposed
Not
Exposed
7/19/2023 26
27. a b
c d
a b
c d
No disease
Disease
Disease No disease
Exposed Exposed
Not
Exposed
Not
Exposed
Prevalence of disease
compared in exposed and
non exposed
a
a+b
vs.
c
c+d
Prevalence of exposure
compared in diseased and
non diseased
vs.
b
b+d
a
a+c
OR
7/19/2023 27
29. Advantages of cross-sectional
• Outcomes and exposures measured at the same time
• Uncovers associations for further study
• Useful for hypothesis generation
• Quick & cheap (no follow up)
• Best way to determine prevalence
• Questionnaire/interview based
• Useful for assessing practice, attitudes, knowledge, beliefs ,
utilisation of services etc
7/19/2023 29
30. Advantages of Cross-Sectional study
• Can be conducted to assess the health care needs of the
population
• Helpful in measuring access and utilization of health services
• Provides information between disease and various variables
• Provides information regarding distribution of a disease
• Determines burden of the diseases in a population. So helpful for
planning purposes
7/19/2023 30
31. Limitations of Cross-Sectional study
• No temporal or time sequence
so gives no information whether which comes first i.e. Cause or
Disease
• Gives no idea about natural history of the disease or etiology
• Gives no measure of new cases occurrence
• Not useful for rare exposures or rare outcomes
7/19/2023 31
33. Case-control studies
•An analytical epidemiologic study design in which
individuals who have the disease under study, also
called cases, are compared to individuals free of
disease (controls) regarding past exposures.
•Exposure differences between cases and controls
are helpful to find potential risk or protective
factors.
•The purpose is to determine if there are one or
more factors associated with the disease under
study.
7/19/2023 33
34. CASE-CONTROL STUDY
• To examine the possible relation of an exposure to a
certain disease, we identify;
1. A group of individuals with the disease (called cases)
and for purpose of comparison,
2. A group of people without the disease or outcome
variable (called controls ).
3. The study compares the occurrence of the possible
cause in cases and in controls.
7/19/2023 34
40. Advantages of case-control Studies
• Can be carried out quickly and quite cheaply
• Useful for rare diseases and outcomes
• Can study multiple exposures for a single
outcome
• Case control studies can be ideal for the study
of rare diseases or those with a long latency
• Compares odds of exposure between cases
and controls
7/19/2023 40
41. Disadvantages of case-control studies
• Selection of control population, overmatching
• Information bias as exposures – similar status
determined after outcome has occurred e.g. Recall
• Selection bias especially regarding controls
• Cannot establish sequence of events (temporal
relationship)
• Not good for rare exposures
• Cannot usually be used to estimate incidence
rates, relative risks or attributable risks
7/19/2023 41
42. COHORT STUDY
• Cohort studies are also called “Follow-up or Incidence
Studies”.
• Because the data on exposure and disease refer to different
points in time, cohort studies are also longitudinal.
• Cohort studies have also been called “Prospective Studies”.
7/19/2023 42
43. Cohort studies
•The observation of a cohort over time to
measure outcome(s)
•Synonymous terms (Last’s)
◦Follow-up
◦Longitudinal
◦Prospective
7/19/2023 43
45. Cohort studies
Exposure cohort: a group of individuals that
potentially share a common exposure e.g.
Radiation
Disease cohort: a group of individuals with a
specific disease.
7/19/2023 45
46. STEPS IN COHORT STUDY
• Cohort studies are conducted in three fundamental steps:
1. Identify cohorts of exposed and unexposed individuals who
are free of the disease/outcome of interest at the beginning of
the study.
2. Observe each cohort over time for the development of the
outcome(s) of interest.
3. Compare the risks of outcomes between the cohorts.
7/19/2023 46
57. COHORT STUDY DESIGN
• Cohort study measure:
i. Incidence rate
ii. Relative Risk
iii. Attributable Risk
7/19/2023 57
58. DESIGN OF A COHORT STUDY
Disease
Develop
Disease
Does not
Develop
Total Incidence
Rate of
Disease
First
Select
Exposed
Not
Exposed
a
c
b
d
a + b
c + d
a/a+ b
c/c + d
Then Follow to see whether
7/19/2023 58
59. INCIDENCE RATE
• Incidence in exposed group = a/ a + b
• Incidence in unexposed group = c/ c + d
• Incidence in total (exposed + unexposed)
• = a + c
a + b + c + d
7/19/2023 59
60. RELATIVE RISK
• Cohort study determine whether there is an association
between exposure to a factor and development of a disease.
• Relative Risk = Incidence in exposed
Incidence in unexposed
= a/ a + b
c/ c + d
7/19/2023 60
61. ATTRIBUTABLE RISK
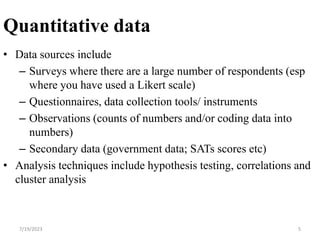
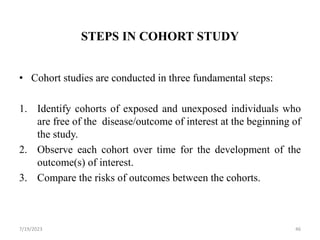
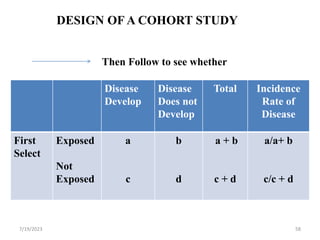
• This is determined by the “Attributable Risk”, which is
defined as “the amount or proportion of diseases incidence
(or disease risk) that can be attributed to a specific
exposure”.
• Attributable Risk is calculated as follow:
• Risk Difference = (Incidence in exposed group ) – (Incidence
in non-exposed group [Background risk]
7/19/2023 61
62. Advantages of cohort studies
• Useful for rare exposures
• Useful for more than one outcome
• Incidence of the outcome (and incidence rates)
• Temporal relationship between exposure and
outcome is clear as exposure status defined at start of
study
• If prospective, minimises bias in measurement of
exposure
• Sometimes the only ethical or legal way to do study
7/19/2023 62
63. Disadvantages of cohort studies
• Not good for study of rare outcomes
• If retrospective they rely on the adequacy of
records
• Exposed may be followed more closely than
unexposed
• If prospective they can be very expensive and slow
• As they are follow up studies, the validity of results
is highly sensitive to losses to follow up (migration,
withdrawal, lack of participation, death)
7/19/2023 63
65. Randomized Controlled Trial (RCT)
”An epidemiological experiment in which subjects
in a population are randomly allocated into groups,
usually called interventional and control groups to
receive and not receive an experimental preventive
or therapetuic procedure, or interventition”
7/19/2023 65
66. Randomized Control Trials (R.C.T)
Randomization:
Allocation of participants to various groups in random
fashion
Intervention:
The group of participants which receives intervention/
treatment.
Control:
The group of participants which receives placebo.
Trials:
An experiment conduction.
66
7/19/2023
68. RANDOMIZED CONTROLLED TRIAL
• The true experimental study design (RCT) has three
characteristics:
1. RANDOMIZATION - the researcher takes care to randomly
assign subjects to the control and experimental groups.
• (Each subject is given an equal chance of being assigned to
either group.)
7/19/2023 68
69. RANDOMIZED CONTROLLED TRIAL
2. CONTROL - the researcher introduces one or more control
group(s) to compare with the experimental group.
3. MANIPULATION - the researcher does something to one
group of subjects in the study.
• Note: The strength of experimental studies is that by
randomization of confounding variables.
7/19/2023 69
70. RANDOMIZED CONTROLLED TRIAL
• In Randomized Controlled Trial (RCT), we begin with a
defined population.
• Subjects in the study population are randomly allocated to
intervention and control groups, and the results are
assessed by comparing outcomes.
• The basic design of RCT is given below;
7/19/2023 70
72. Allocation of study subjects -
randomization
•Random = governed by chance
•Randomization = allocation of individuals to
groups by chance
•Each sampling unit has the same chance of
selection
7/19/2023 72
76. 76
TYPES OF BLINDING
• Single Blind
– The subjects are not knowing the group to which they are
belonging .
• Double blind trials
– Neither the subject nor care giver is aware about the groups
• Triple blind trials
– The subject, the care giver (nurse or doctor) and the person
doing the analysis are not aware about the groups in.
76
7/19/2023
77. Advantages of RCT
• Exposure in under control.
• Due to randomization both intervention and control groups
have similar characteristics.
• By blinding the study, the observer and selection bias can be
eliminated.
• If properly designed & conducted, it can reduce the
confounding.
• Can confirm or refute etiological hypothesis.
• Can evaluate the efficacy / effectiveness / efficiency of
health services.
• Best method for studying causal relationship.
77
7/19/2023
78. Disadvantages of RCT
• Ethical problems
Due to adverse effects
Due to benefits of intervention in the treated group
Provision of Placebo
• Relatively expensive
78
7/19/2023
79. QUASI EXPERIMENTAL STUDY
• In a Quasi Experimental Study, at least one characteristic of a
true experiment is missing, either randomization or the use of a
separate control group.
• A quasi experimental study, however, always includes
manipulation of an independent variable that serves as the
intervention.
7/19/2023 79
80. QUASI EXPERIMENTAL STUDY
• One of the most common quasi experimental designs uses two
(or more) groups, one of which serves as a control group in
which no intervention takes place.
• Both groups are observed before as well as after the
intervention, to test if the intervention has made any
difference.
• The subjects in the two groups (study and control groups) have
not been randomly assigned.
7/19/2023 80
82. QUASI EXPERIMENTAL STUDY
• Another type of design that is often chosen because it is quite
easy to set up uses only one group in which an intervention is
carried out.
• The situation is analyzed before and after the intervention to
test if there is any difference in the observed problem. This is
called a "Before- After" study/ Pre – Post Study.
7/19/2023 82
84. STUDY TYPES & STRENGTH OF EVIDENCE
• Analytic Study involves the systematic evaluation of
suspected relationships, for example, between an exposure
and a health outcome.
• Analytic studies typically provide stronger evidence
concerning particular relationships.
• An experimental design is the only type of study design
that can actually prove causation.
7/19/2023 84
87. Phenomenological Studies
• Phenomenological studies examine human experiences through the
descriptions provided by the people involved.
• These experiences are called lived experiences.
• The goal of phenomenological studies is to describe the meaning that
experiences hold for each subject.
• This type of research is used to study areas in which there is little knowledge
(Donalek, 2004).
• In phenomenological research, respondents are asked to describe their
experiences as they perceive them.
• They may write about their experiences, but information is generally
obtained through interviews.
• To understand the lived experience from the vantage point of the subject, the
researcher must take into account her or his own beliefs and feeling.
88. Example
• Daly (2005) studied the lived experiences of mothers of suicidal
adolescents. She contended that, unfortunately, the mother’s
experience is often the hidden dimension in the family.
• Unstructured interviews were conducted with 6 mothers living with
suicidal adolescents.
• Six themes were identified:
• failure as a good mother, the ultimate rejection, feeling alone in the
struggle, helplessness and powerlessness in the struggle, cautious
parenting, and keeping an emotional distance.
89. Ethnographic Studies
• Ethnographic studies involve the collection and analysis of data
about cultural groups.
• Cameron (1990) wrote that ethnography means “learning from
people” (p. 5).
• According to Leininger (1985), ethnography can be defined as “the
systematic process of observing, detailing, describing, documenting,
and analyzing the lifeways or particular patterns of a culture (or
subculture) in order to grasp the lifeways or patterns of the people in
their familiar environment”
• In ethnographic research, the researcher frequently lives with the
people and becomes a part of their culture. The researcher explores
with the people their rituals and customs.
90. Example
• Gance-Cleveland (2004) examined the features, critical attributes,
processes, and benefits of school based support groups for adolescents
with an addicted parent. Ethnographic methods were used to gather
data.
• Participant observations were conducted weekly at two high schools
over one semester.
• Interviews were conducted with program administrators, school
administrators, group co-facilitators, and participants.
• School-based support group participation was found to enhance self-
knowledge and led to self-care and self-healing.
91. Grounded Theory Studies
• Grounded theory is a qualitative research approach developed by two
sociologists, Glaser and Strauss (1967).
• Grounded theory studies are studies in which data are collected and
analyzed and then a theory is developed that is grounded in the data.
• The grounded theory method uses both an inductive and a deductive
approach to theory development.
92. Example
• The grounded theory qualitative method was used by Williams and
Irurita (2005) to study the personal control and emotional comfort of
hospitalized patients. Interviews were conducted with 40 patients, and
75 hours of field observations were conducted.
• The basic psychological process identified by the researchers was
labeled “optimizing personal control to facilitate emotional comfort.”
• Personal control referred to the ability of patients to influence their
environment; emotional comfort was defined as a state of relaxation
that affected the physical status of the patient.
• Personal control was found to be a central feature of emotional
comfort.
93. Historical Studies
• Historical studies concern the identification, location, evaluation, and
synthesis of data from the past.
• Historical research seeks not only to discover the events of the past
but to relate these past happenings to the present and to the future.
• Although there is a need for historical research in nursing, a limited
number of nurse researchers have chosen it.
• But the process of historical research is basically the same as in many
other types of scientific research.
• The problem area or area of interest is clearly identified and the
literature is reviewed. Research questions are formulated.
• Finally, the data are collected and analyzed.
94. Example
• Oral histories were gathered from 8 nurses who were employed
between 1951 and 1965 in a Virginia state hospital (Harmon, 2005).
• These nurses were now retired and had between 12 and 46 years of
psychiatric nursing experience.
• The researcher wanted to describe the experiences of these nurses
who practiced in a state mental hospital before and during the
introduction of antipsychotic medications.
• They expressed resignation and frustration while trying to provide
care despite crowded wards and inadequate personnel and supplies.
The nurses indicated that they focused on the patient’s body instead
of on the patient’s mind.
• The camaraderie they experienced with other nurses helped them
continue in their positions, despite what they felt to be a “thankless
job.”
95. Action Research Studies
• Action research is a type of qualitative research that seeks action
to improve practice and study the effects of the action that was
taken (Streubert & Carpenter, 2002). Solutions are sought to
practice problems in one particular hospital or health care settings.
• There is no goal of trying to generalize the findings of the study,
as is the case in quantitative research studies. In action research,
the implementation of solutions occurs as an actual part of the
research process. There is no delay in implementation of the
solutions.
96. Example
• Action research was used with staff in one hospice and one nursing
home setting in London (Dunckley, Aspinal,Addington-Hall,
Hughes, & Higginson, 2005).The purpose of the study was to
identify facilitators and barriers to the use of the Palliative Care
Outcome Scale (POS).
• Staff took part in semi structured interviews, completed diaries, and
participated in monthly meetings to give their opinions of what they
thought were the facilitators and barriers to the implementation of
the POS.
97.
98. References
• Principles of Epidemiology in Public Health Practice,
Third Edition An Introduction to Applied
Epidemiology and Biostatistics
• http://www.cdc.gov/
• Jhonhopkin university epidemiology lectures
7/19/2023 98