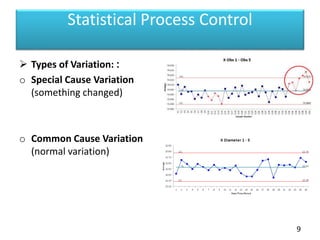
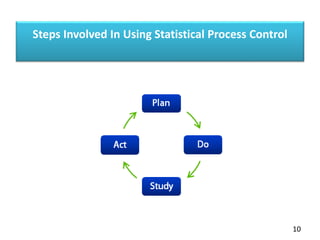
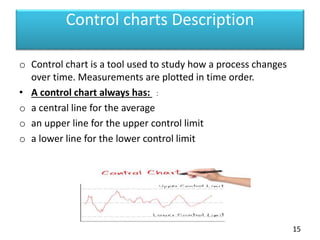
Optimizing and Controlling
Processes
- Statistical Process Control (SPC)
- Control Charts
1
Statistics
๏ƒ˜ What is Statistics?
o A branch of mathematics used to summarize, analyze, and
interpret a group of numbers or observations.
2
Process Control
o What is it? Process Control consists of the systems and tools
used to ensure that processes are well defined, performed
correctly, and maintained so that the completed product
conforms to established requirements.
o Process Control is an essential element of managing the
production floor to ensure the Quality, safetyโ€ฆ.etc and
reliability of the Out put.
3
Statistical Process Control Defined
o Statistical Process Control (SPC) is a method for monitoring,
controlling and, ideally, improving a process through statistical
analysis. SPC is applied in order to monitor and control a
process.
4
Reasons for Statistical Process Control
o The Reasons for SPC is to improve product quality and
simultaneously reduce costs, and to improve product image in
order to successfully compete in world markets.
5
Statistical Process Control Benefits
o Quality of the end product or service can be detected -
monitored and corrected on line.
o To reduce waste .
o To ensure better Quality output-products/service..
o SPC also indicates when an action should be taken in a
process, but it also indicates when NO action should be taken,
weight control
6
Steps Involved In Using Statistical Process Control
o Proper Statistical Process Control starts with planning and
data collection. Statistical analysis on the wrong or incorrect
data is rubbish, the analysis must be appropriate for the data
collected.
o Be sure to PLAN, then constantly re-evaluate your situation to
make sure the plan is correct.
7
Where can Statistical Process Control be used ?
o Statistical Process Control can be used anywhere
measurements and performance specifications are
utilized Statistical Process Control is mostly
associated with Manufacturing Butโ€ฆ can also be
used in:
โ€“ Marketing
โ€“ Medical/Healthcare
โ€“ Service Industries
โ€“ And many other fields
8
Statistical Process Control
๏ƒ˜ Types of Variation: :
o Special Cause Variation
(something changed)
o Common Cause Variation
(normal variation)
9
Steps Involved In Using Statistical Process Control
10
Steps Involved In Using Statistical Process Control
๏ƒ˜ Plan
o Identify the problem and the possible causes. The QC tools described in
this manual can help organizations identify problems and possible causes,
and to prioritize corrective actions.
๏ƒ˜ Do
o Make changes designed to correct or improve the situation.
11
Steps Involved In Using Statistical Process Control
๏ƒ˜ Study
o Study the effect of these changes on the situation. This is where control
charts are used โ€“ they show the effects of changes on a process over time.
Evaluate the results and then replicate the change or abandon it and try
something different.
๏ƒ˜ Act
o If the result is successful, standardize the changes and then work on
further improvements or the next prioritized problem. If the outcome is
not yet successful, look for other ways to change the process or identify
different causes for the problem.
12
Elements of a Successful SPC Program
o Management Leadership
o A Team Approach
o Emphasis on reducing variability
o successful Communication results throughout organization
13
(SPC)- 7 BASIC TOOLS
1. Check Sheet
2. Stratification
3. Scatter Diagram
4. Histogram
5. Pareto Chart
6. Control Chart
7. Cause and Effect Diagram
14
Control charts Description
o Control chart is a tool used to study how a process changes
over time. Measurements are plotted in time order.
โ€ข A control chart always has: :
o a central line for the average
o an upper line for the upper control limit
o a lower line for the lower control limit
15
Control charts features
๏ƒ˜ Control charts have four key features:
1. Data Points
2. The Average or Center Line
3. The Upper Control Limit (UCL)
4. The Lower Control Limit (LCL)
16
Control charts
o Show the variation in a measurement during the time period
that the process is observed.
o Monitor processes to show how the process is performing and
how the process are affected by changes to the process. This
information is then used to make quality improvements.
o Help to identify special or assignable causes for factors that
impede peak performance.
17
Statistical Basis of the Control Chart
Types the control chart:
o Variables Control Charts
โ€“ These charts are applied to data that follow a continuous
distribution (measurement data).
o Attributes Control Charts
โ€“ These charts are applied to data that follow a discrete
distribution.
18
Statistical Basis of the Control Chart
Variables Control Charts :
o measure length, weight, temperature
o measure variability in length
Attributes Control Charts :
o Good / bad
o works / doesnโ€™t
19
When to Use a Control Chart?
o When controlling ongoing processes by finding and correcting
problems as they occur.
o When determining whether a process is stable (in statistical
control).
o When determining whether your quality improvement project
should aim to prevent specific problems or to make
fundamental changes to the process.
20
Sampling Plan
o A sampling plan is a detailed outline of which measurements will be
taken at what times, Sampling plans should be designed in such a
way that the resulting data will contain a representative sample of
the parameters of interest and allow for all questions
21
Types of Sampling Plans
Single-Sampling Plan
โ€ข A decision to accept or
reject a lot based on the
results of one random
sample from the lot.
Double-Sampling Plan
A plan in which management specifies
two sample sizes and two acceptance
numbers.
22
Sequential-Sampling Plan
A plan in which the consumer
randomly selects items from the
lot and inspects them one by one.
Sampling by Attribute Sampling by
Variable
Types of Sampling Plans
23
Thank You!
24

Optimizing and controlling processes

  • 1.
    Optimizing and Controlling Processes -Statistical Process Control (SPC) - Control Charts 1
  • 2.
    Statistics ๏ƒ˜ What isStatistics? o A branch of mathematics used to summarize, analyze, and interpret a group of numbers or observations. 2
  • 3.
    Process Control o Whatis it? Process Control consists of the systems and tools used to ensure that processes are well defined, performed correctly, and maintained so that the completed product conforms to established requirements. o Process Control is an essential element of managing the production floor to ensure the Quality, safetyโ€ฆ.etc and reliability of the Out put. 3
  • 4.
    Statistical Process ControlDefined o Statistical Process Control (SPC) is a method for monitoring, controlling and, ideally, improving a process through statistical analysis. SPC is applied in order to monitor and control a process. 4
  • 5.
    Reasons for StatisticalProcess Control o The Reasons for SPC is to improve product quality and simultaneously reduce costs, and to improve product image in order to successfully compete in world markets. 5
  • 6.
    Statistical Process ControlBenefits o Quality of the end product or service can be detected - monitored and corrected on line. o To reduce waste . o To ensure better Quality output-products/service.. o SPC also indicates when an action should be taken in a process, but it also indicates when NO action should be taken, weight control 6
  • 7.
    Steps Involved InUsing Statistical Process Control o Proper Statistical Process Control starts with planning and data collection. Statistical analysis on the wrong or incorrect data is rubbish, the analysis must be appropriate for the data collected. o Be sure to PLAN, then constantly re-evaluate your situation to make sure the plan is correct. 7
  • 8.
    Where can StatisticalProcess Control be used ? o Statistical Process Control can be used anywhere measurements and performance specifications are utilized Statistical Process Control is mostly associated with Manufacturing Butโ€ฆ can also be used in: โ€“ Marketing โ€“ Medical/Healthcare โ€“ Service Industries โ€“ And many other fields 8
  • 9.
    Statistical Process Control ๏ƒ˜Types of Variation: : o Special Cause Variation (something changed) o Common Cause Variation (normal variation) 9
  • 10.
    Steps Involved InUsing Statistical Process Control 10
  • 11.
    Steps Involved InUsing Statistical Process Control ๏ƒ˜ Plan o Identify the problem and the possible causes. The QC tools described in this manual can help organizations identify problems and possible causes, and to prioritize corrective actions. ๏ƒ˜ Do o Make changes designed to correct or improve the situation. 11
  • 12.
    Steps Involved InUsing Statistical Process Control ๏ƒ˜ Study o Study the effect of these changes on the situation. This is where control charts are used โ€“ they show the effects of changes on a process over time. Evaluate the results and then replicate the change or abandon it and try something different. ๏ƒ˜ Act o If the result is successful, standardize the changes and then work on further improvements or the next prioritized problem. If the outcome is not yet successful, look for other ways to change the process or identify different causes for the problem. 12
  • 13.
    Elements of aSuccessful SPC Program o Management Leadership o A Team Approach o Emphasis on reducing variability o successful Communication results throughout organization 13
  • 14.
    (SPC)- 7 BASICTOOLS 1. Check Sheet 2. Stratification 3. Scatter Diagram 4. Histogram 5. Pareto Chart 6. Control Chart 7. Cause and Effect Diagram 14
  • 15.
    Control charts Description oControl chart is a tool used to study how a process changes over time. Measurements are plotted in time order. โ€ข A control chart always has: : o a central line for the average o an upper line for the upper control limit o a lower line for the lower control limit 15
  • 16.
    Control charts features ๏ƒ˜Control charts have four key features: 1. Data Points 2. The Average or Center Line 3. The Upper Control Limit (UCL) 4. The Lower Control Limit (LCL) 16
  • 17.
    Control charts o Showthe variation in a measurement during the time period that the process is observed. o Monitor processes to show how the process is performing and how the process are affected by changes to the process. This information is then used to make quality improvements. o Help to identify special or assignable causes for factors that impede peak performance. 17
  • 18.
    Statistical Basis ofthe Control Chart Types the control chart: o Variables Control Charts โ€“ These charts are applied to data that follow a continuous distribution (measurement data). o Attributes Control Charts โ€“ These charts are applied to data that follow a discrete distribution. 18
  • 19.
    Statistical Basis ofthe Control Chart Variables Control Charts : o measure length, weight, temperature o measure variability in length Attributes Control Charts : o Good / bad o works / doesnโ€™t 19
  • 20.
    When to Usea Control Chart? o When controlling ongoing processes by finding and correcting problems as they occur. o When determining whether a process is stable (in statistical control). o When determining whether your quality improvement project should aim to prevent specific problems or to make fundamental changes to the process. 20
  • 21.
    Sampling Plan o Asampling plan is a detailed outline of which measurements will be taken at what times, Sampling plans should be designed in such a way that the resulting data will contain a representative sample of the parameters of interest and allow for all questions 21
  • 22.
    Types of SamplingPlans Single-Sampling Plan โ€ข A decision to accept or reject a lot based on the results of one random sample from the lot. Double-Sampling Plan A plan in which management specifies two sample sizes and two acceptance numbers. 22
  • 23.
    Sequential-Sampling Plan A planin which the consumer randomly selects items from the lot and inspects them one by one. Sampling by Attribute Sampling by Variable Types of Sampling Plans 23
  • 24.