This document discusses measurement system analysis (MSA) and key terms related to evaluating measurement systems. It provides the following information:
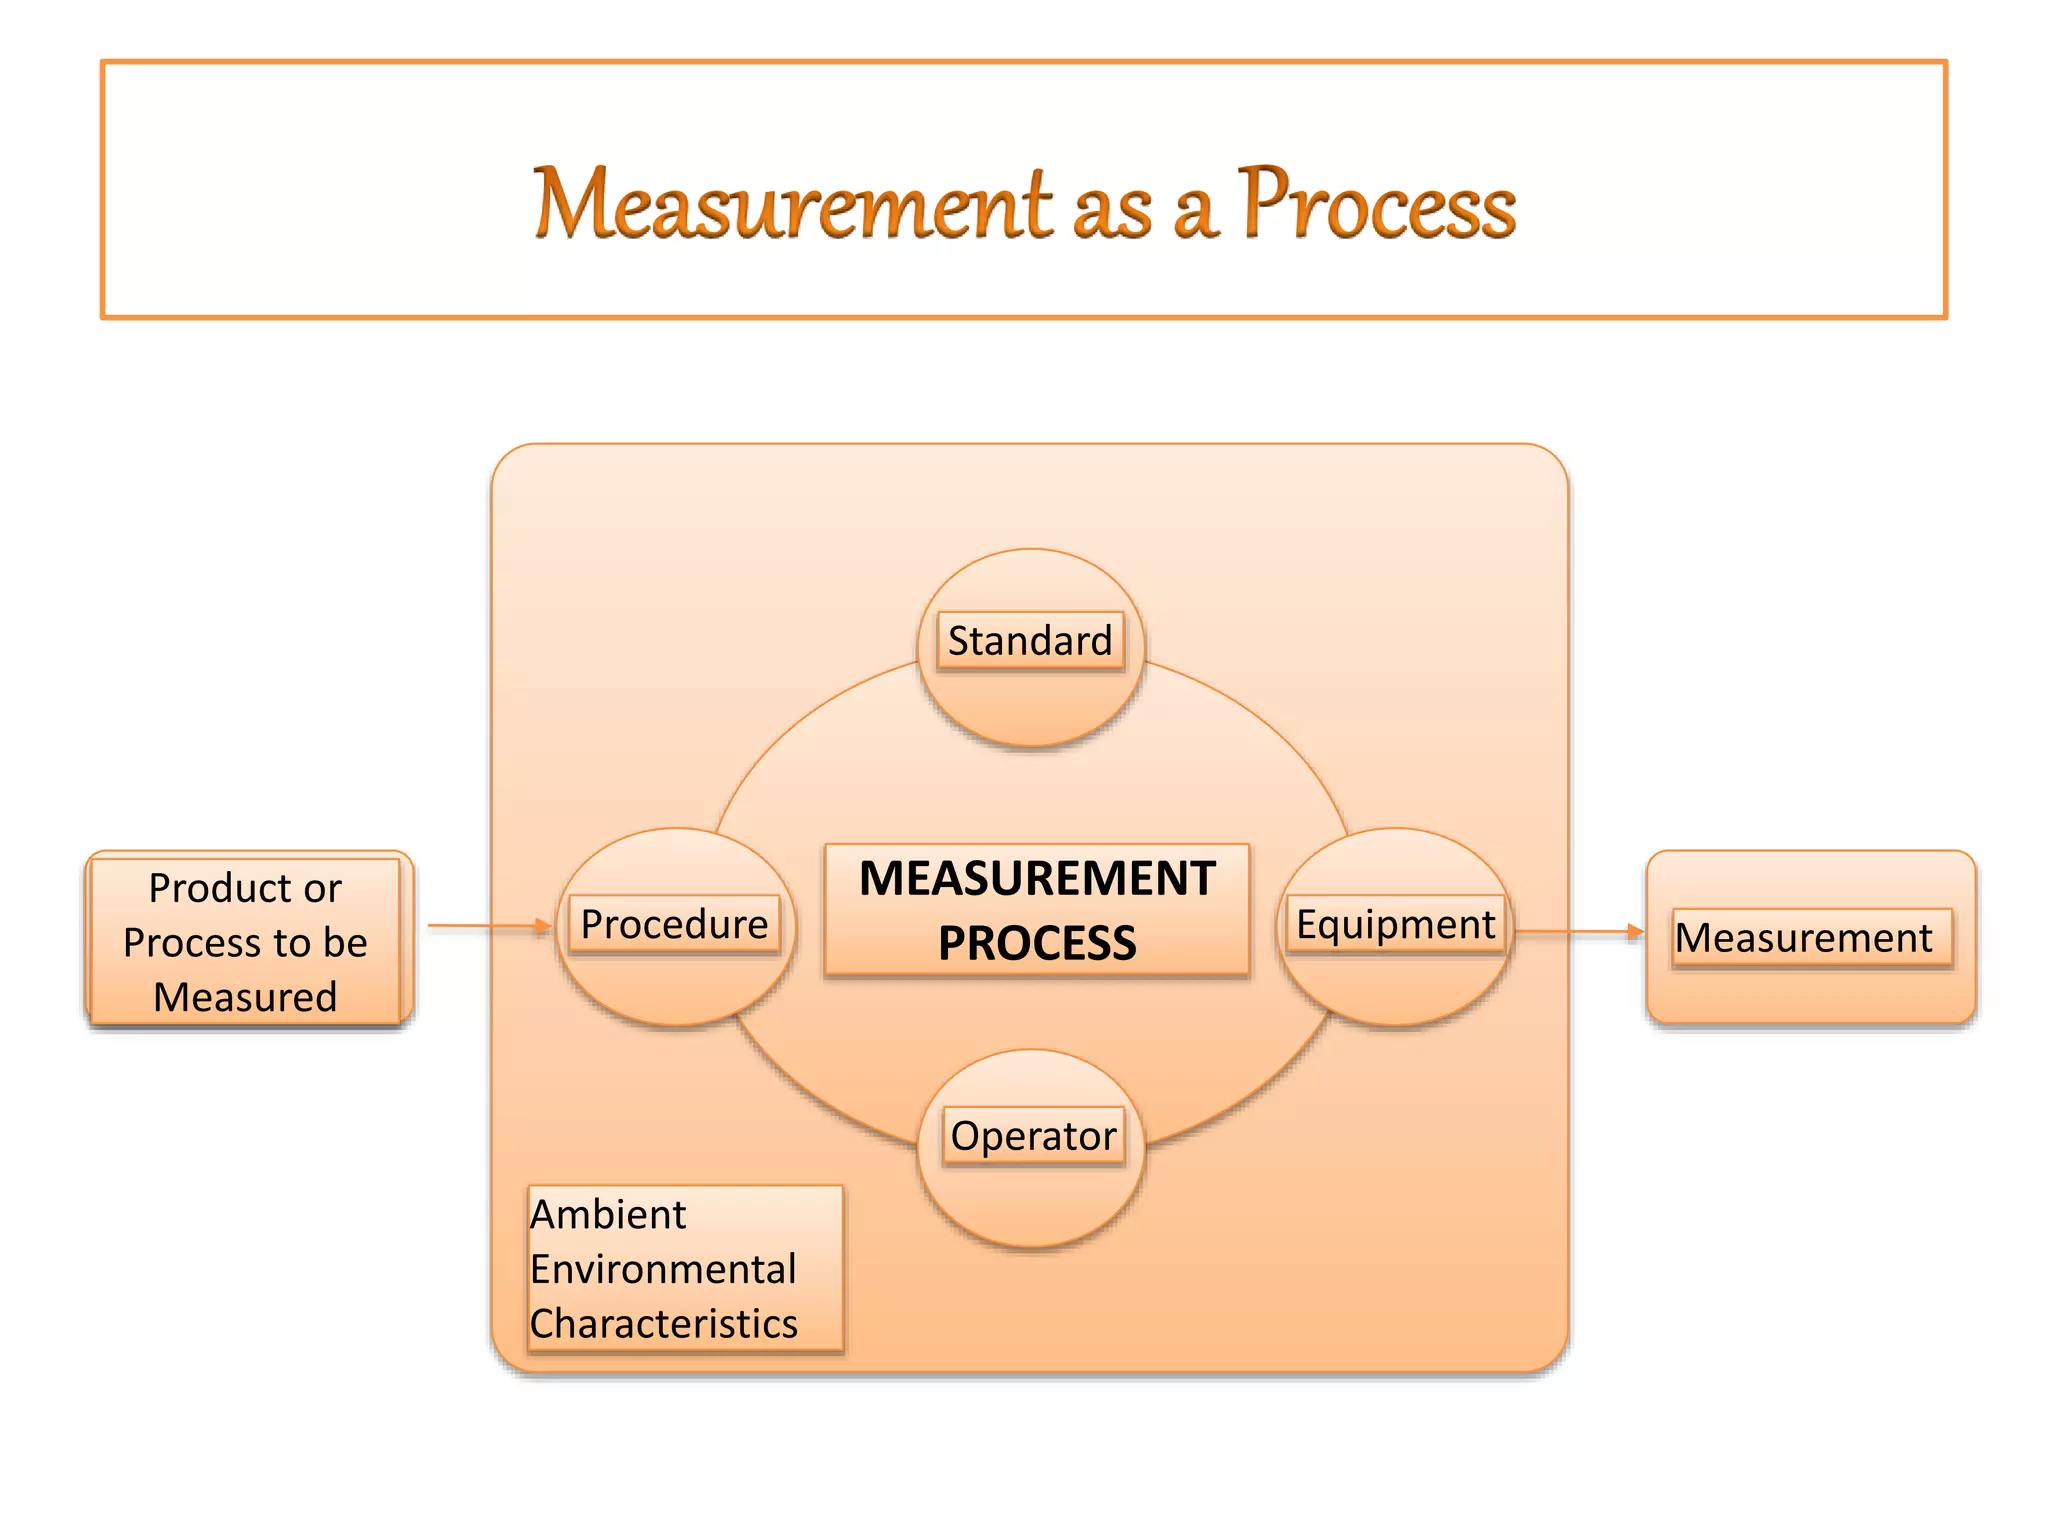
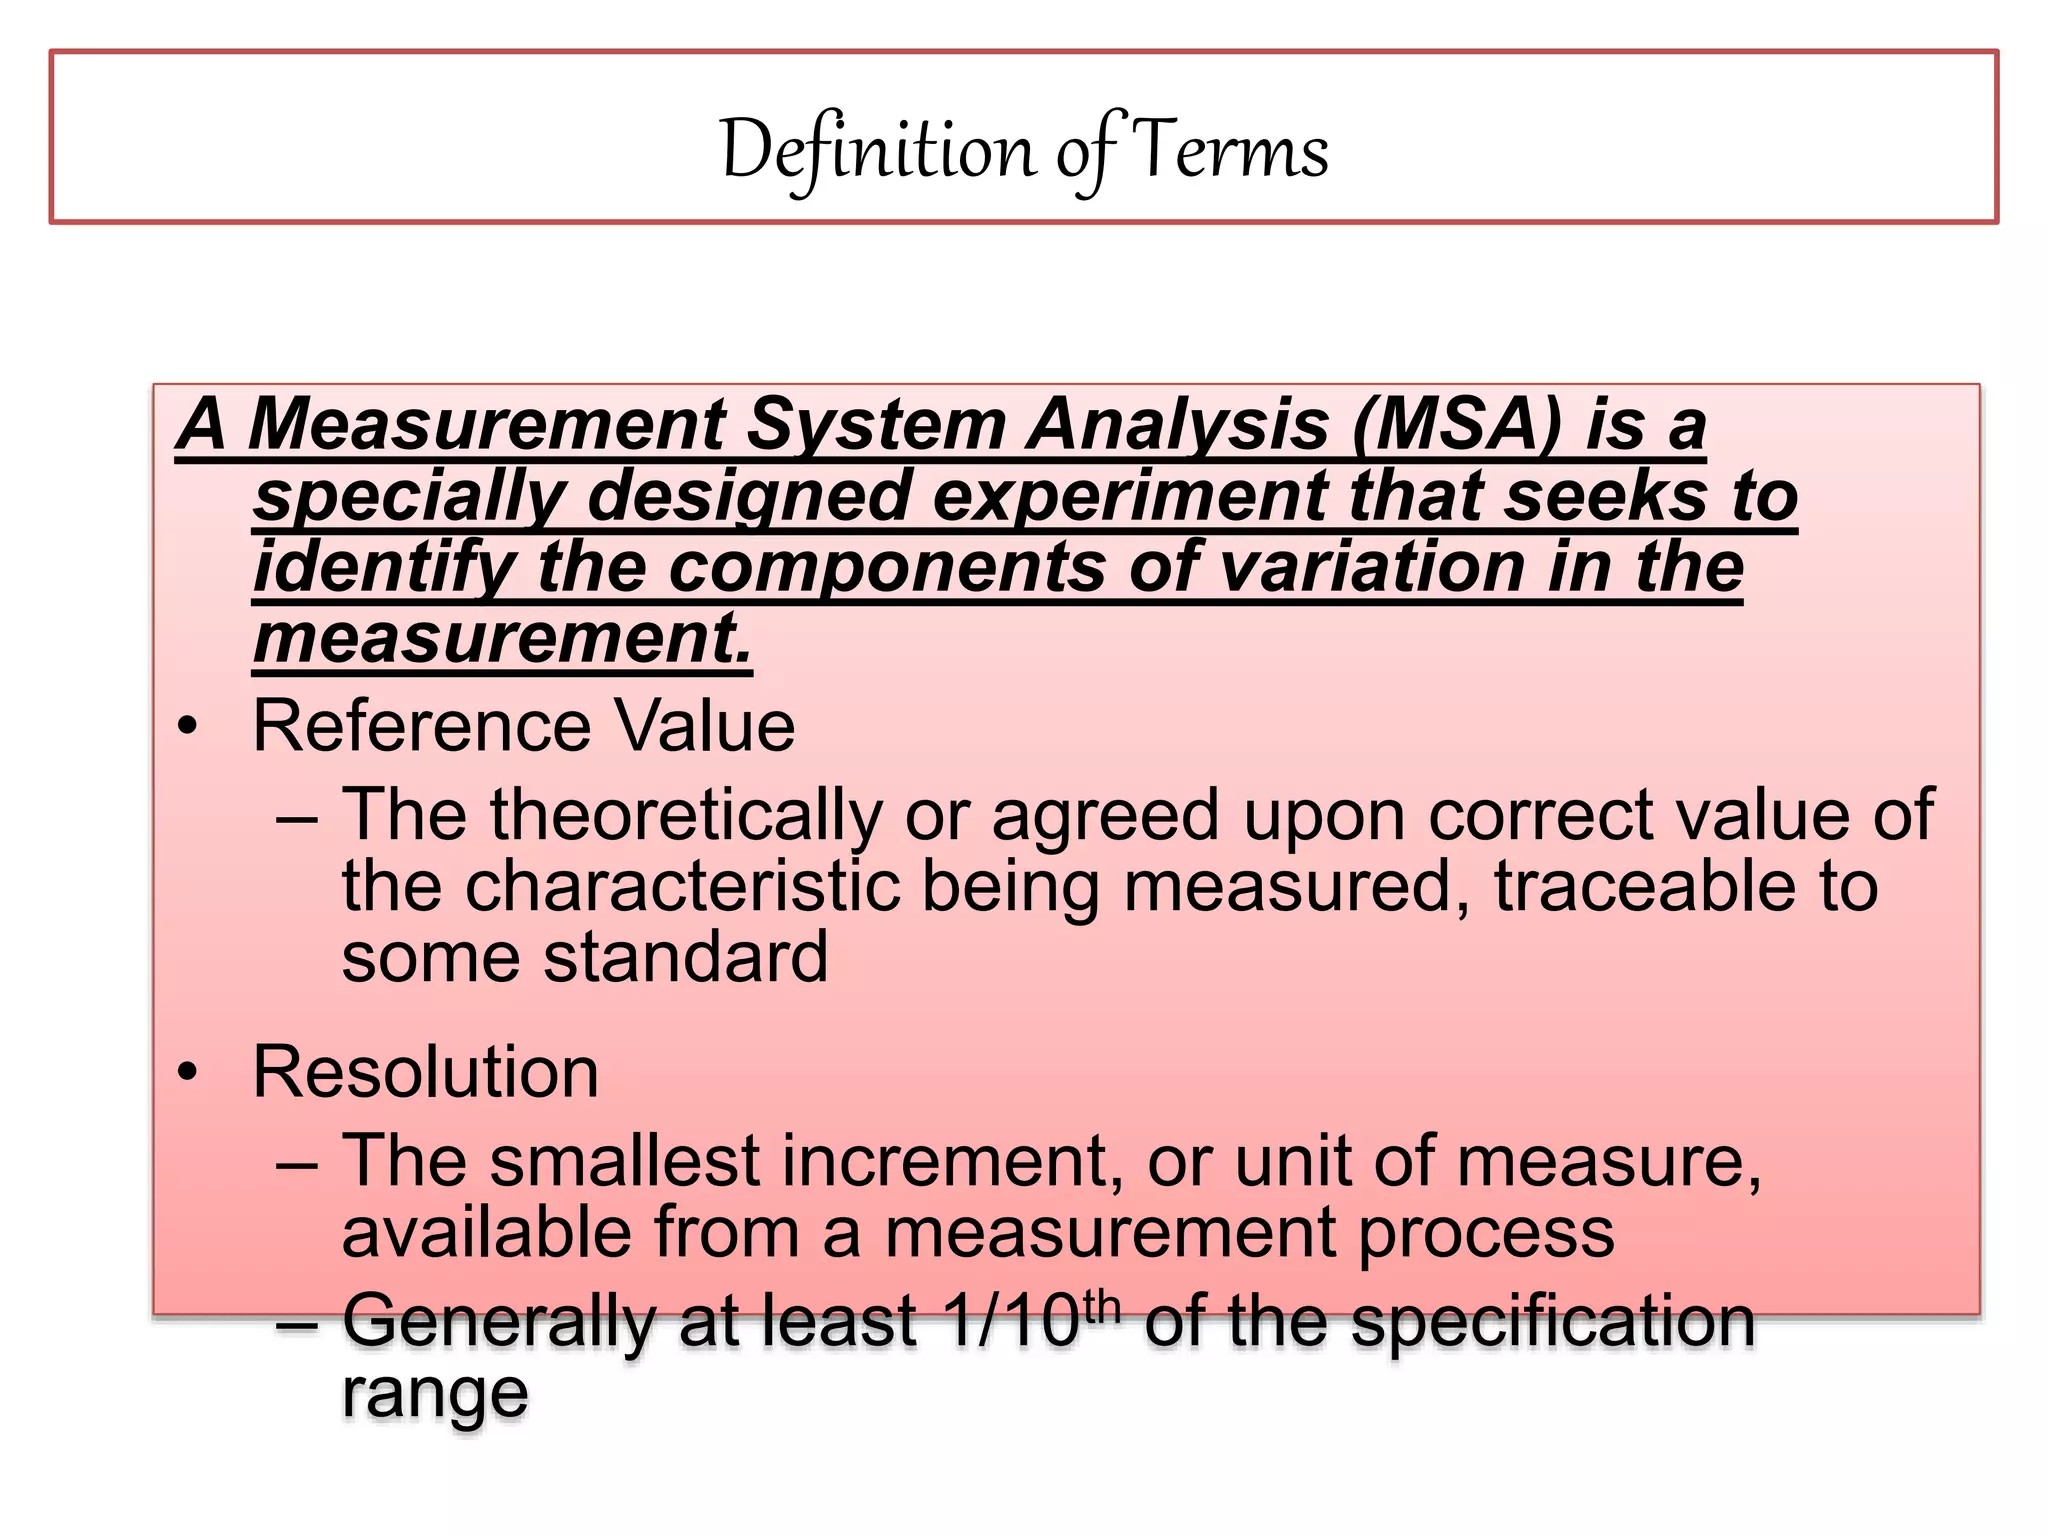
1. An MSA seeks to identify sources of variation in a measurement process. Steps include determining the system to study, establishing test procedures, and choosing operators and sample parts.
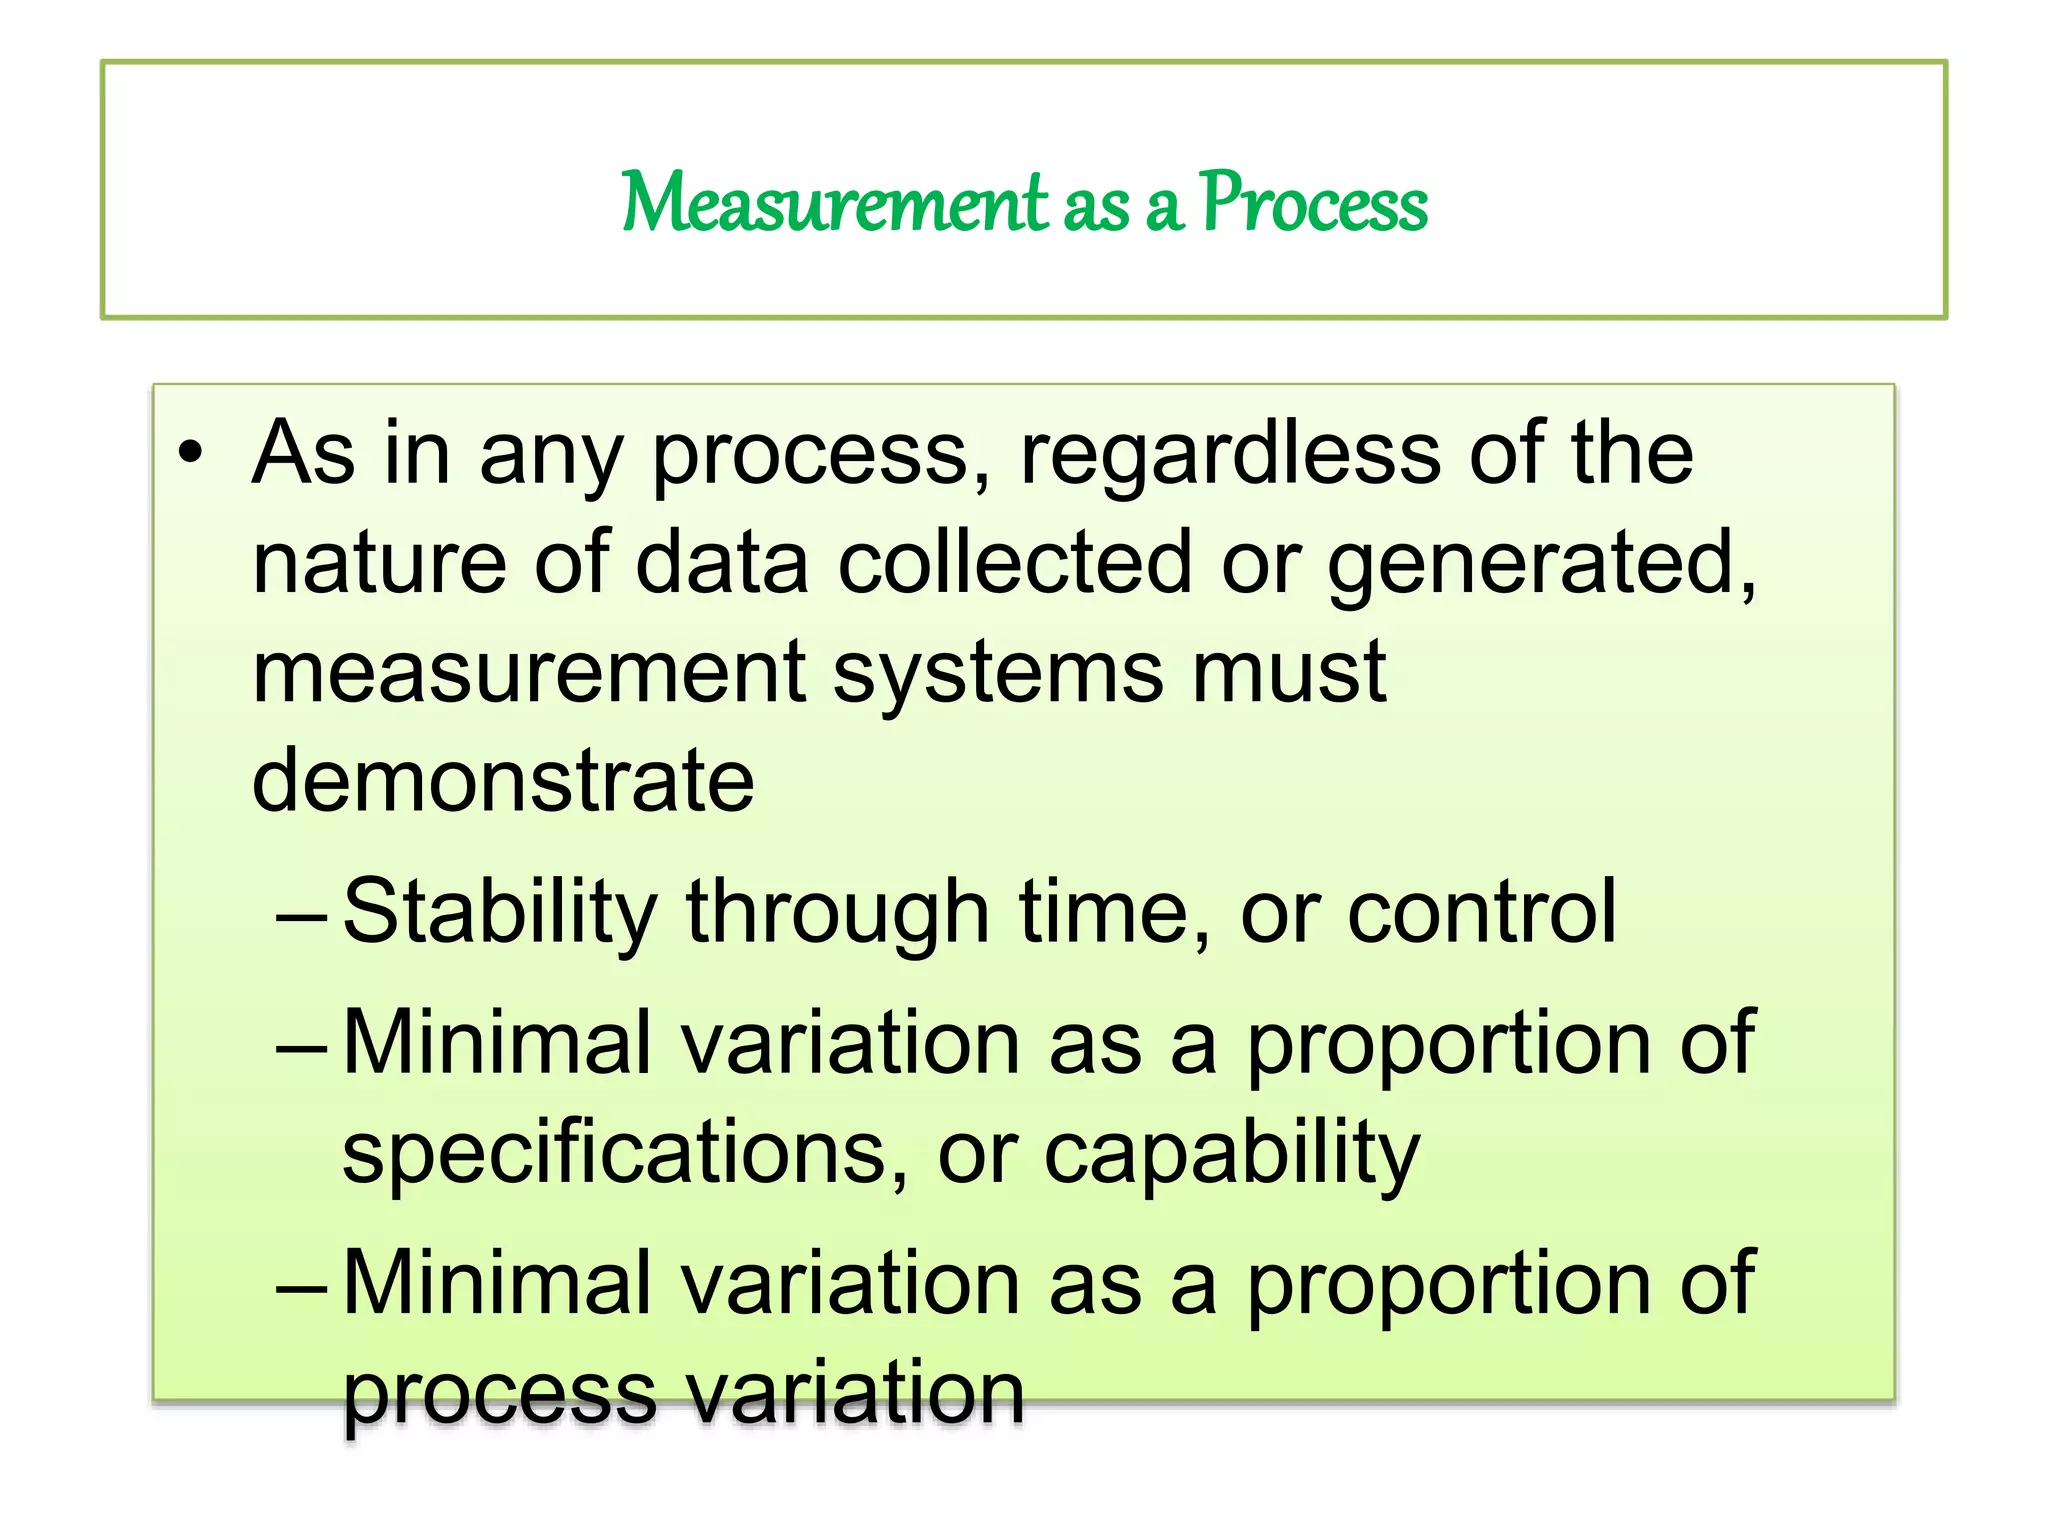
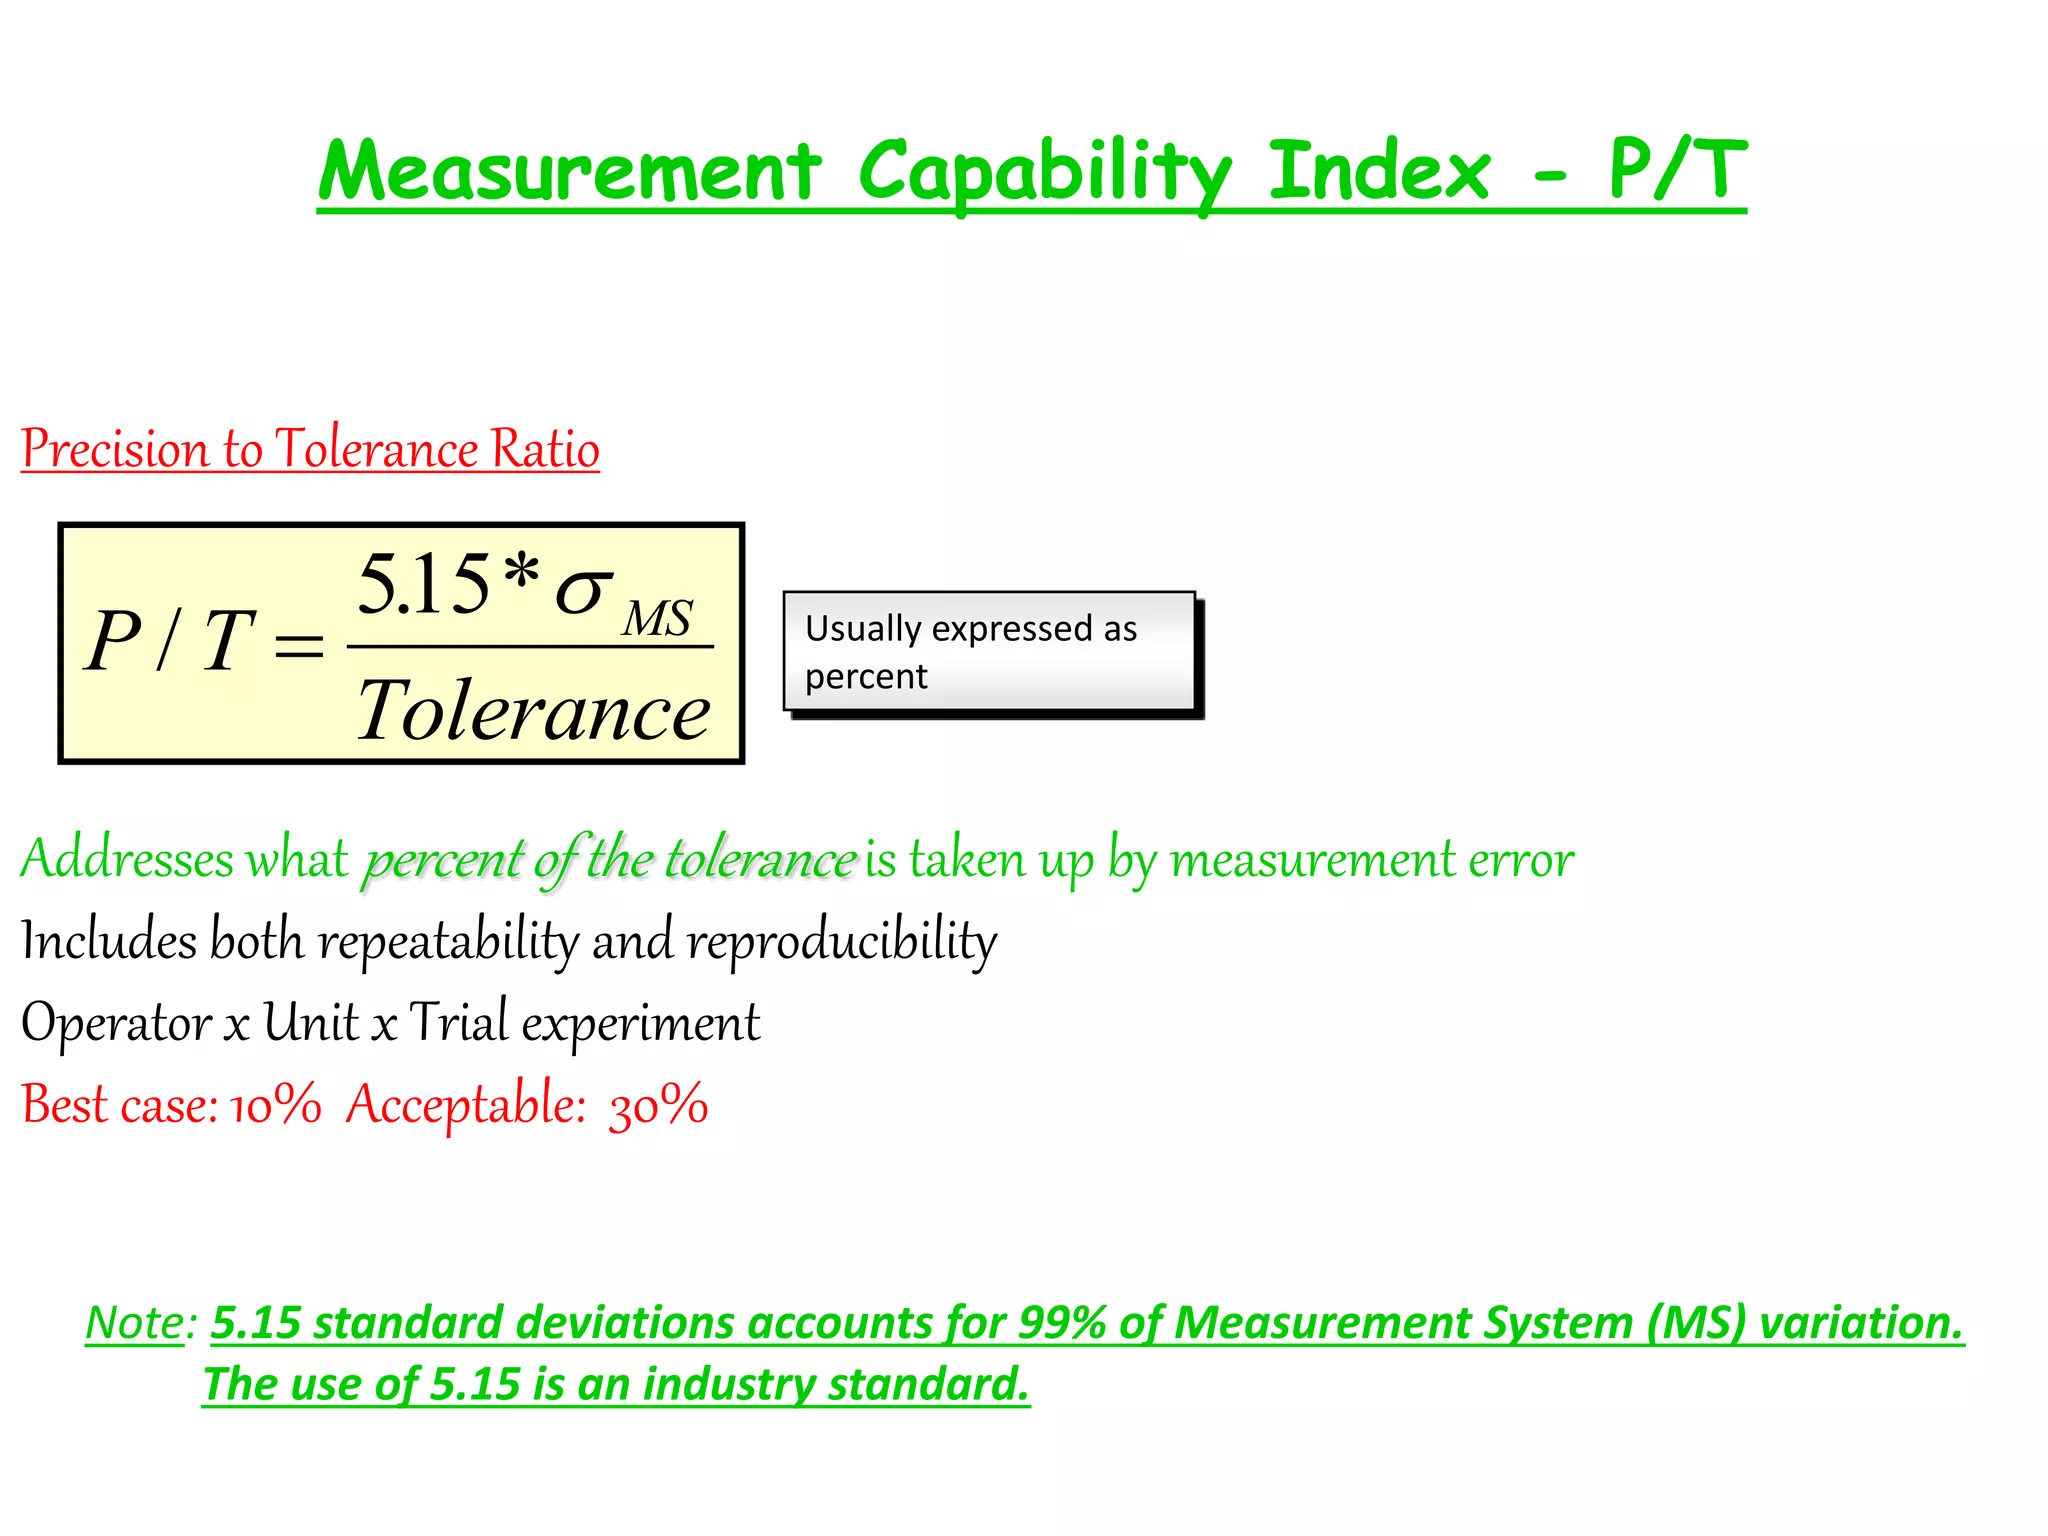
2. Measurement systems should demonstrate stability, minimal variation compared to specifications, and minimal variation compared to the process being measured.
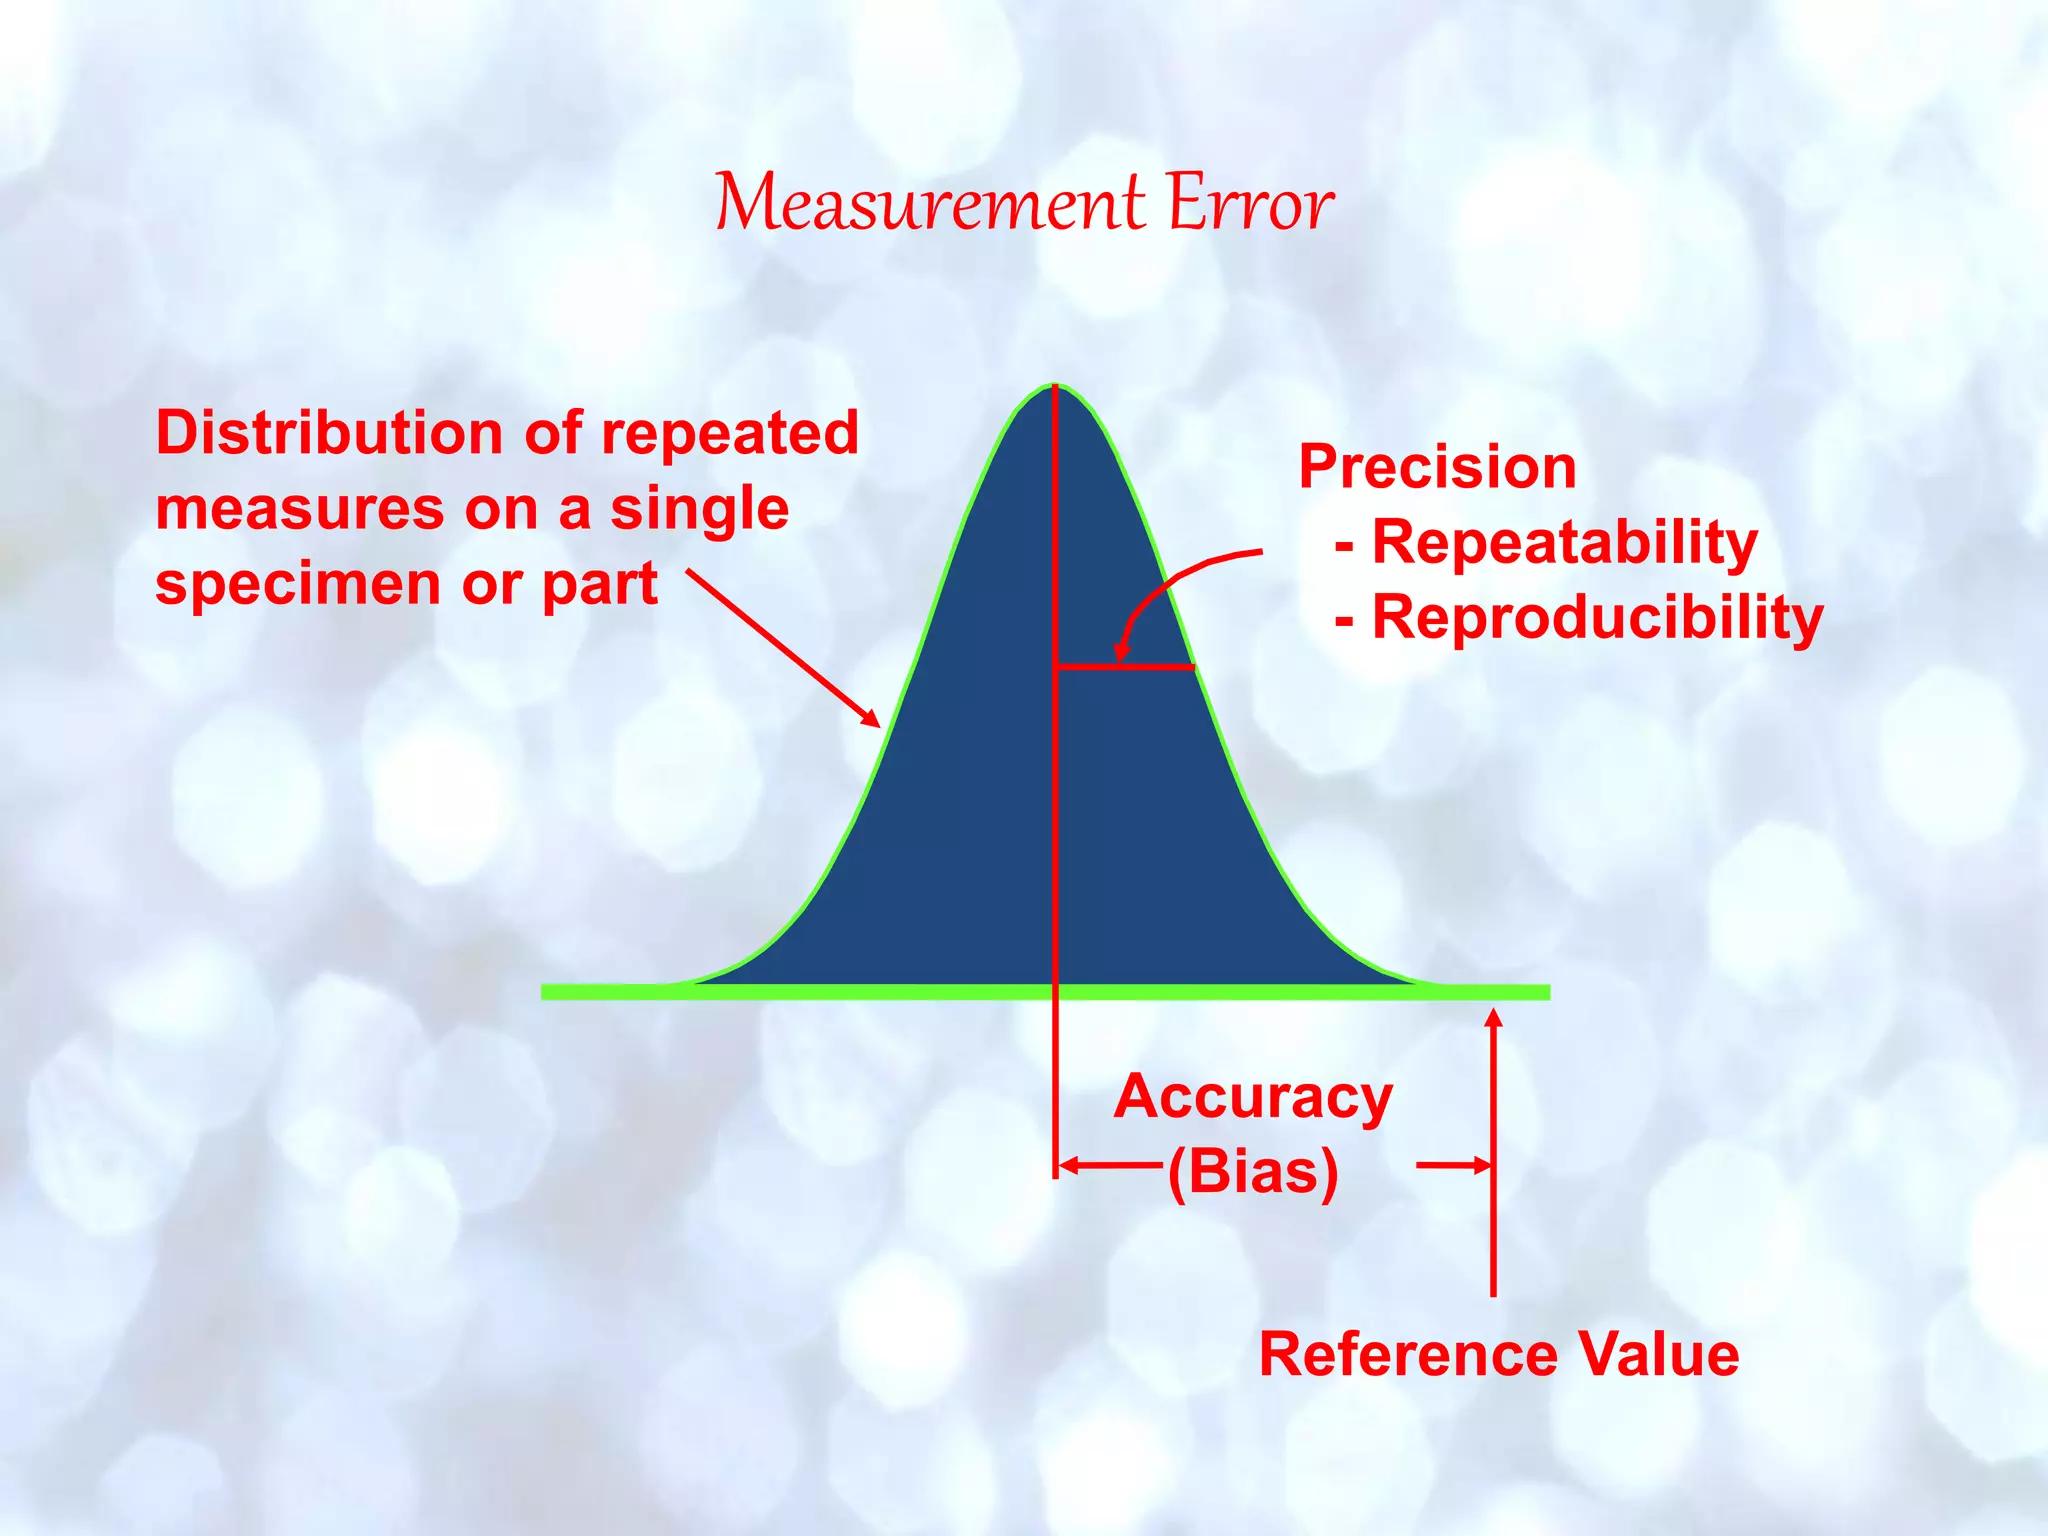
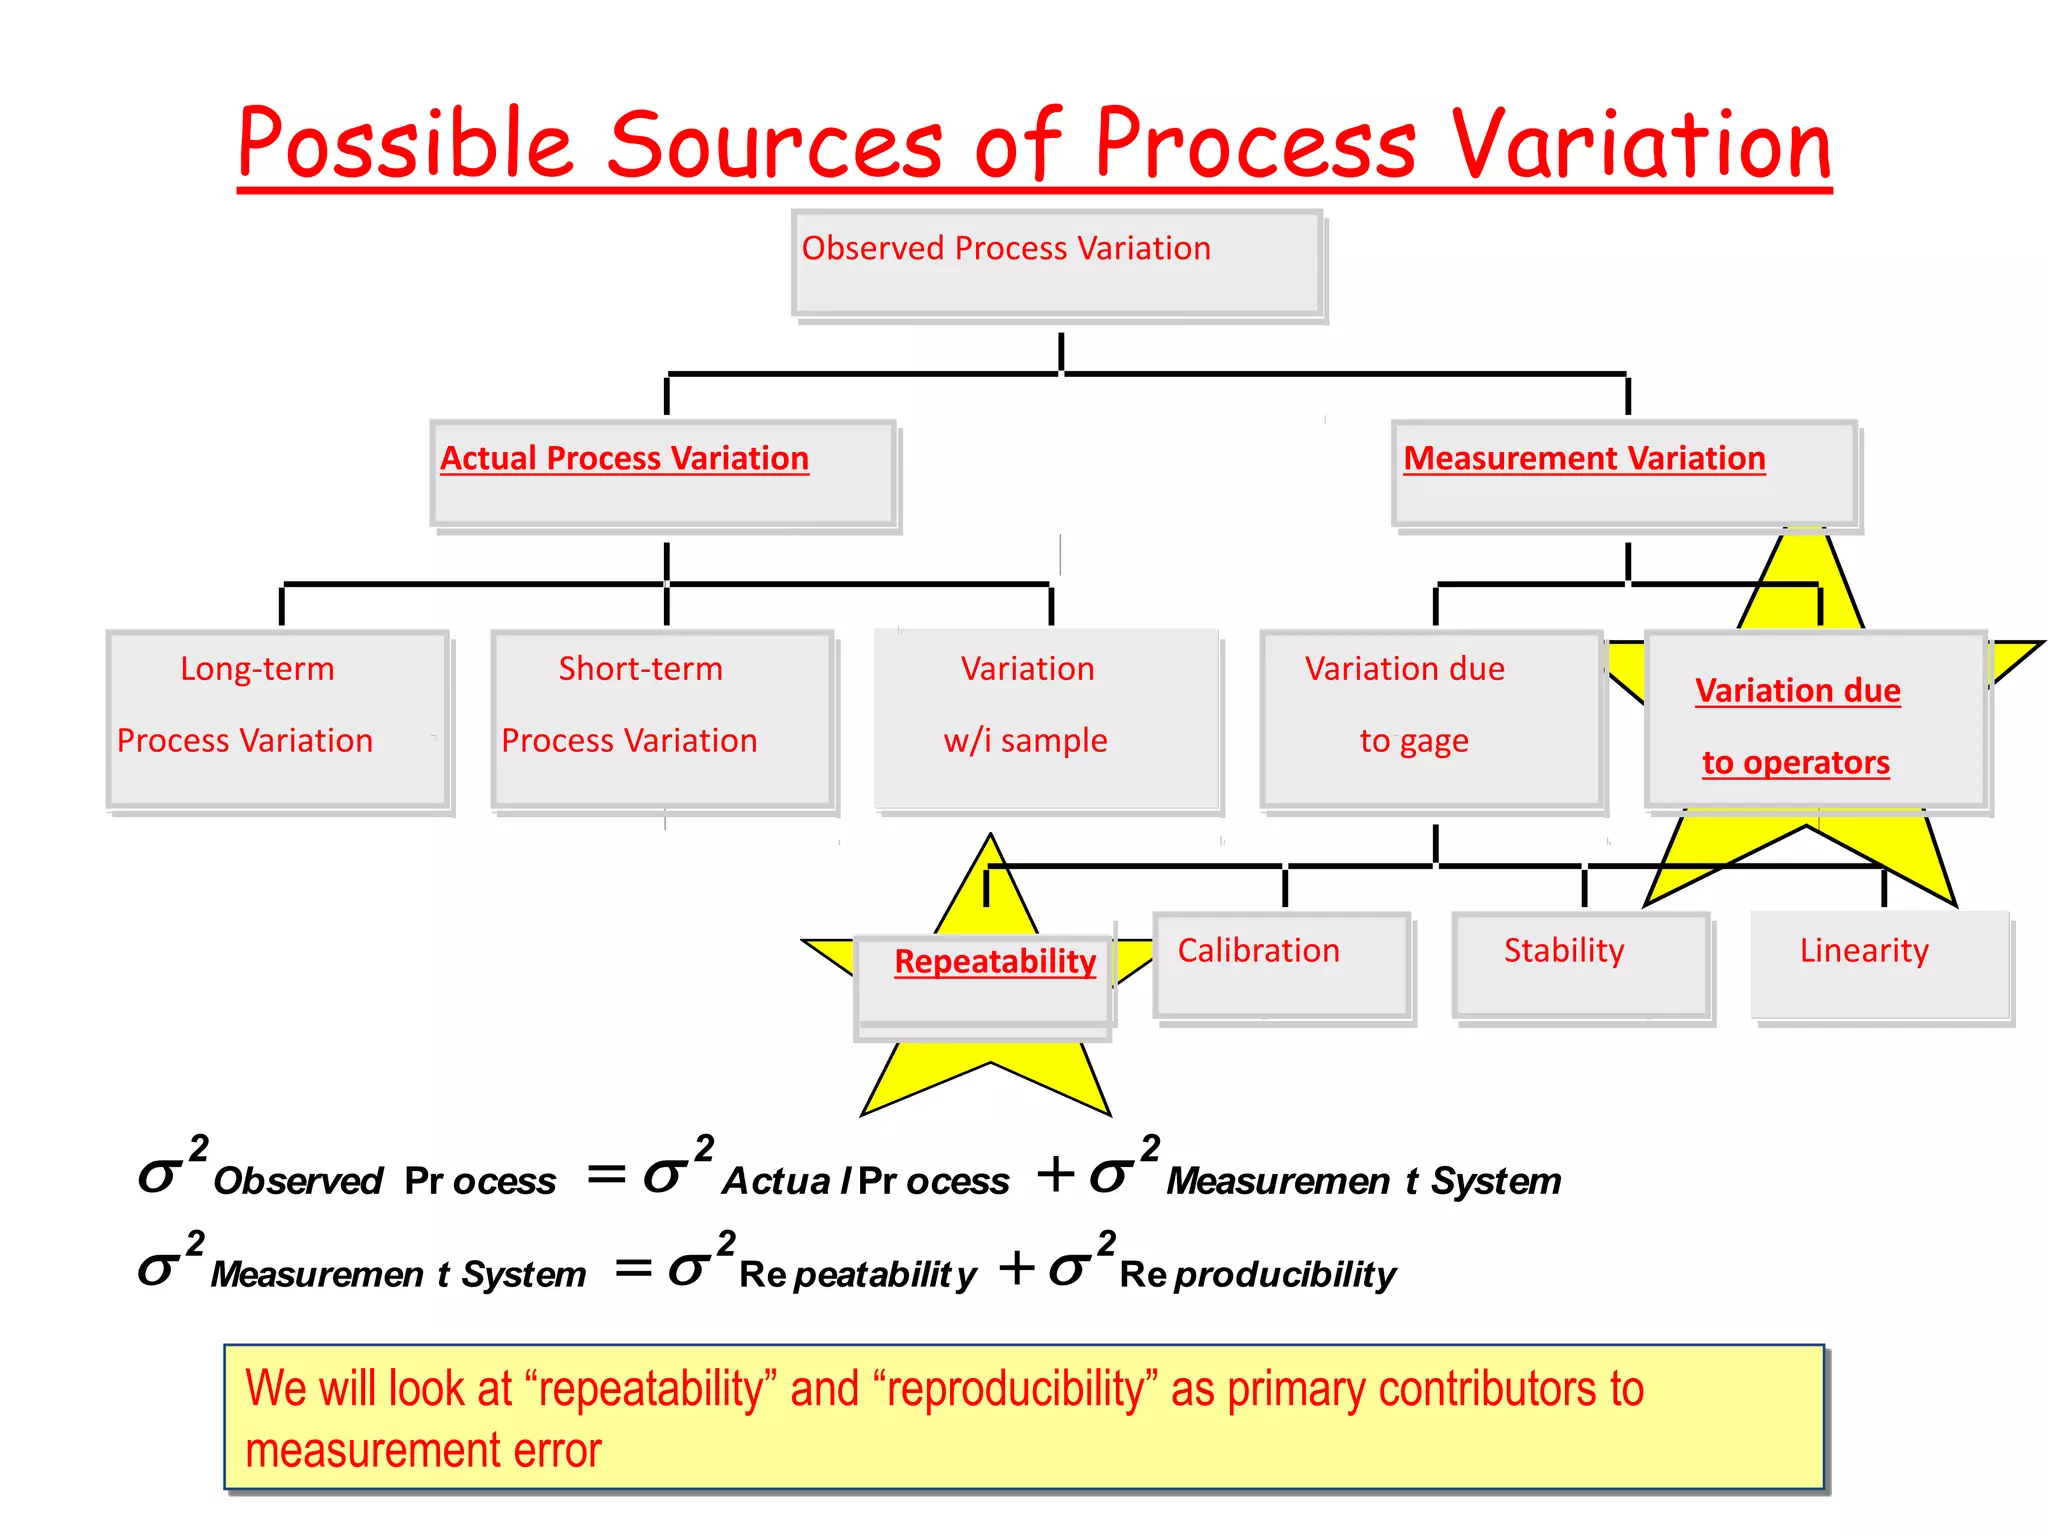
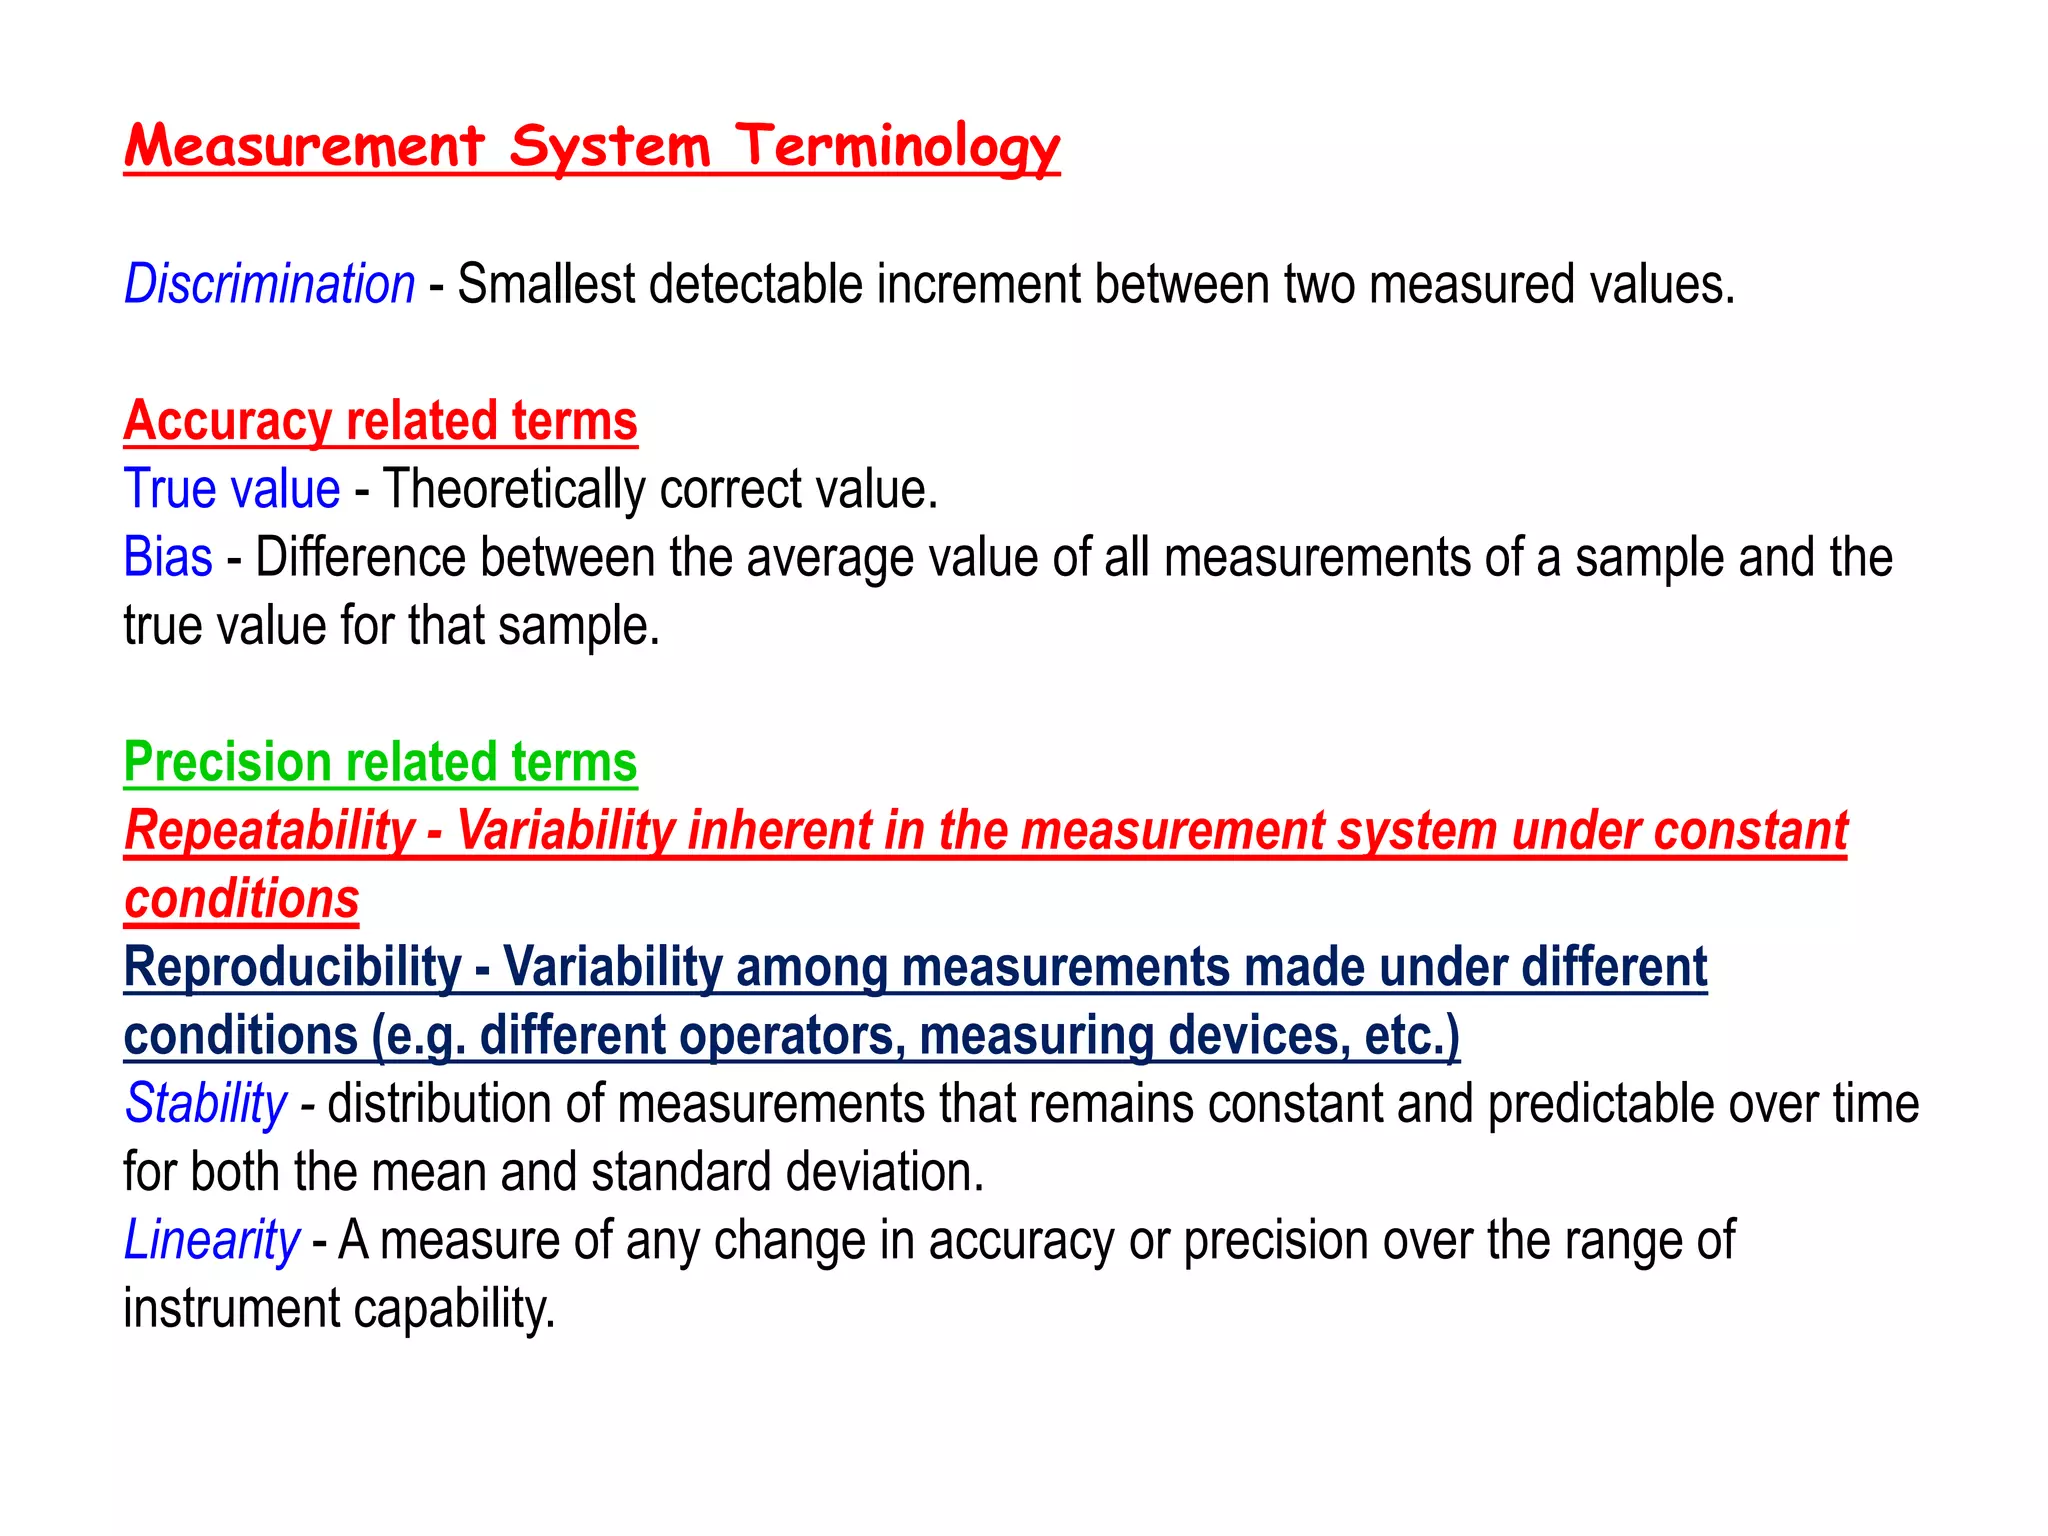
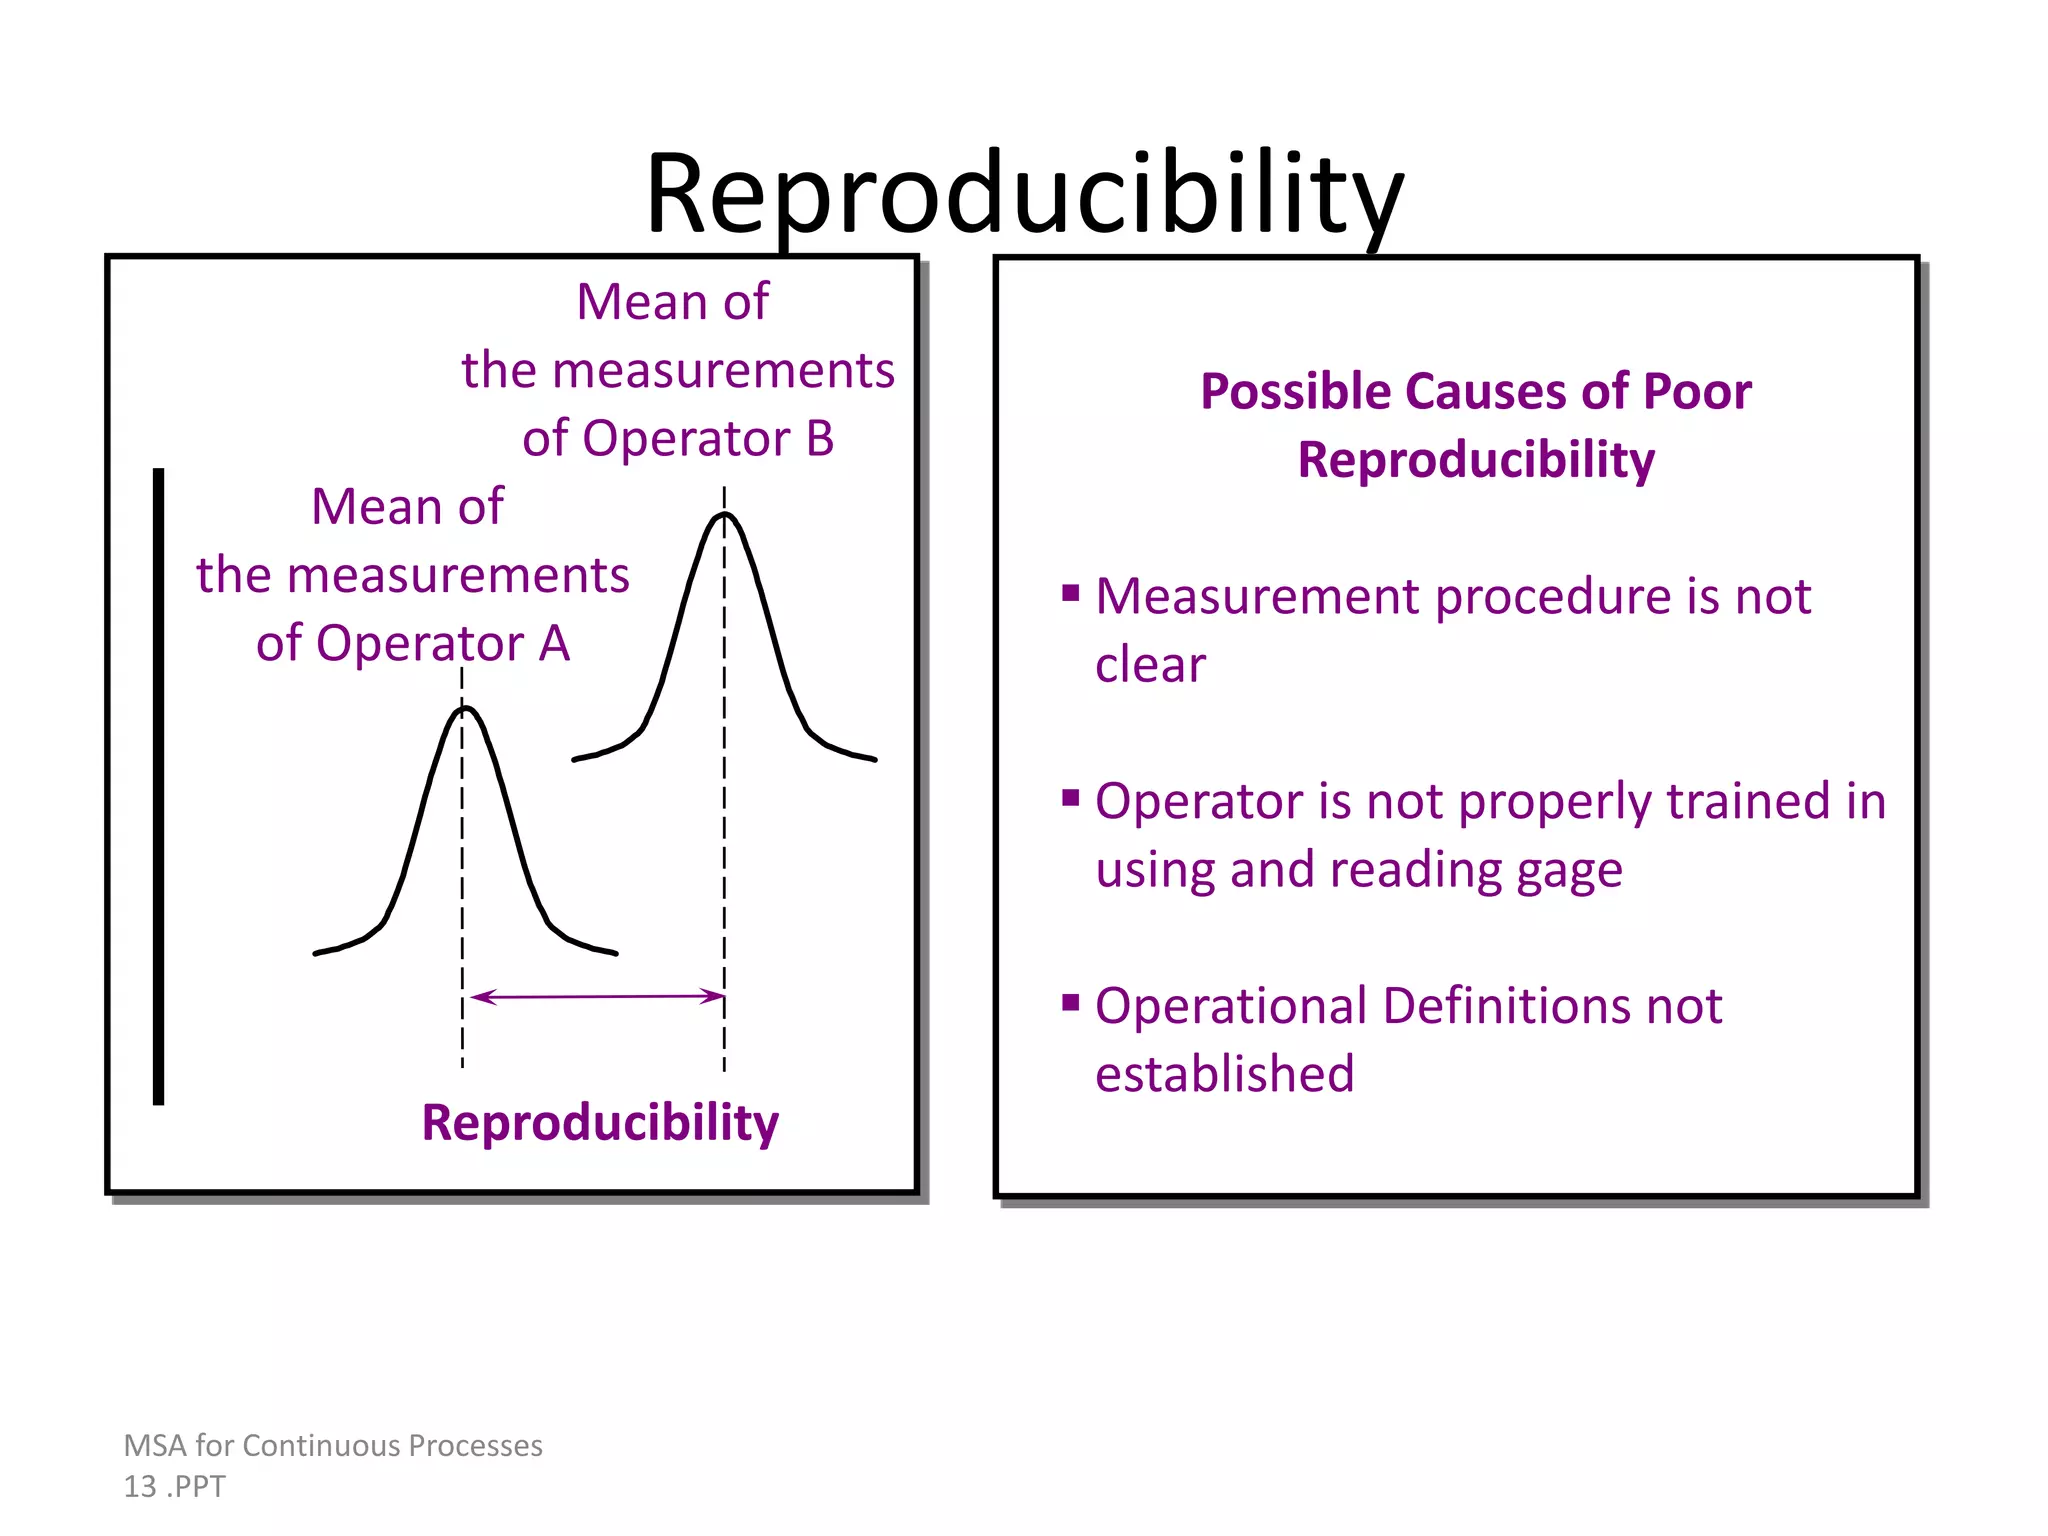
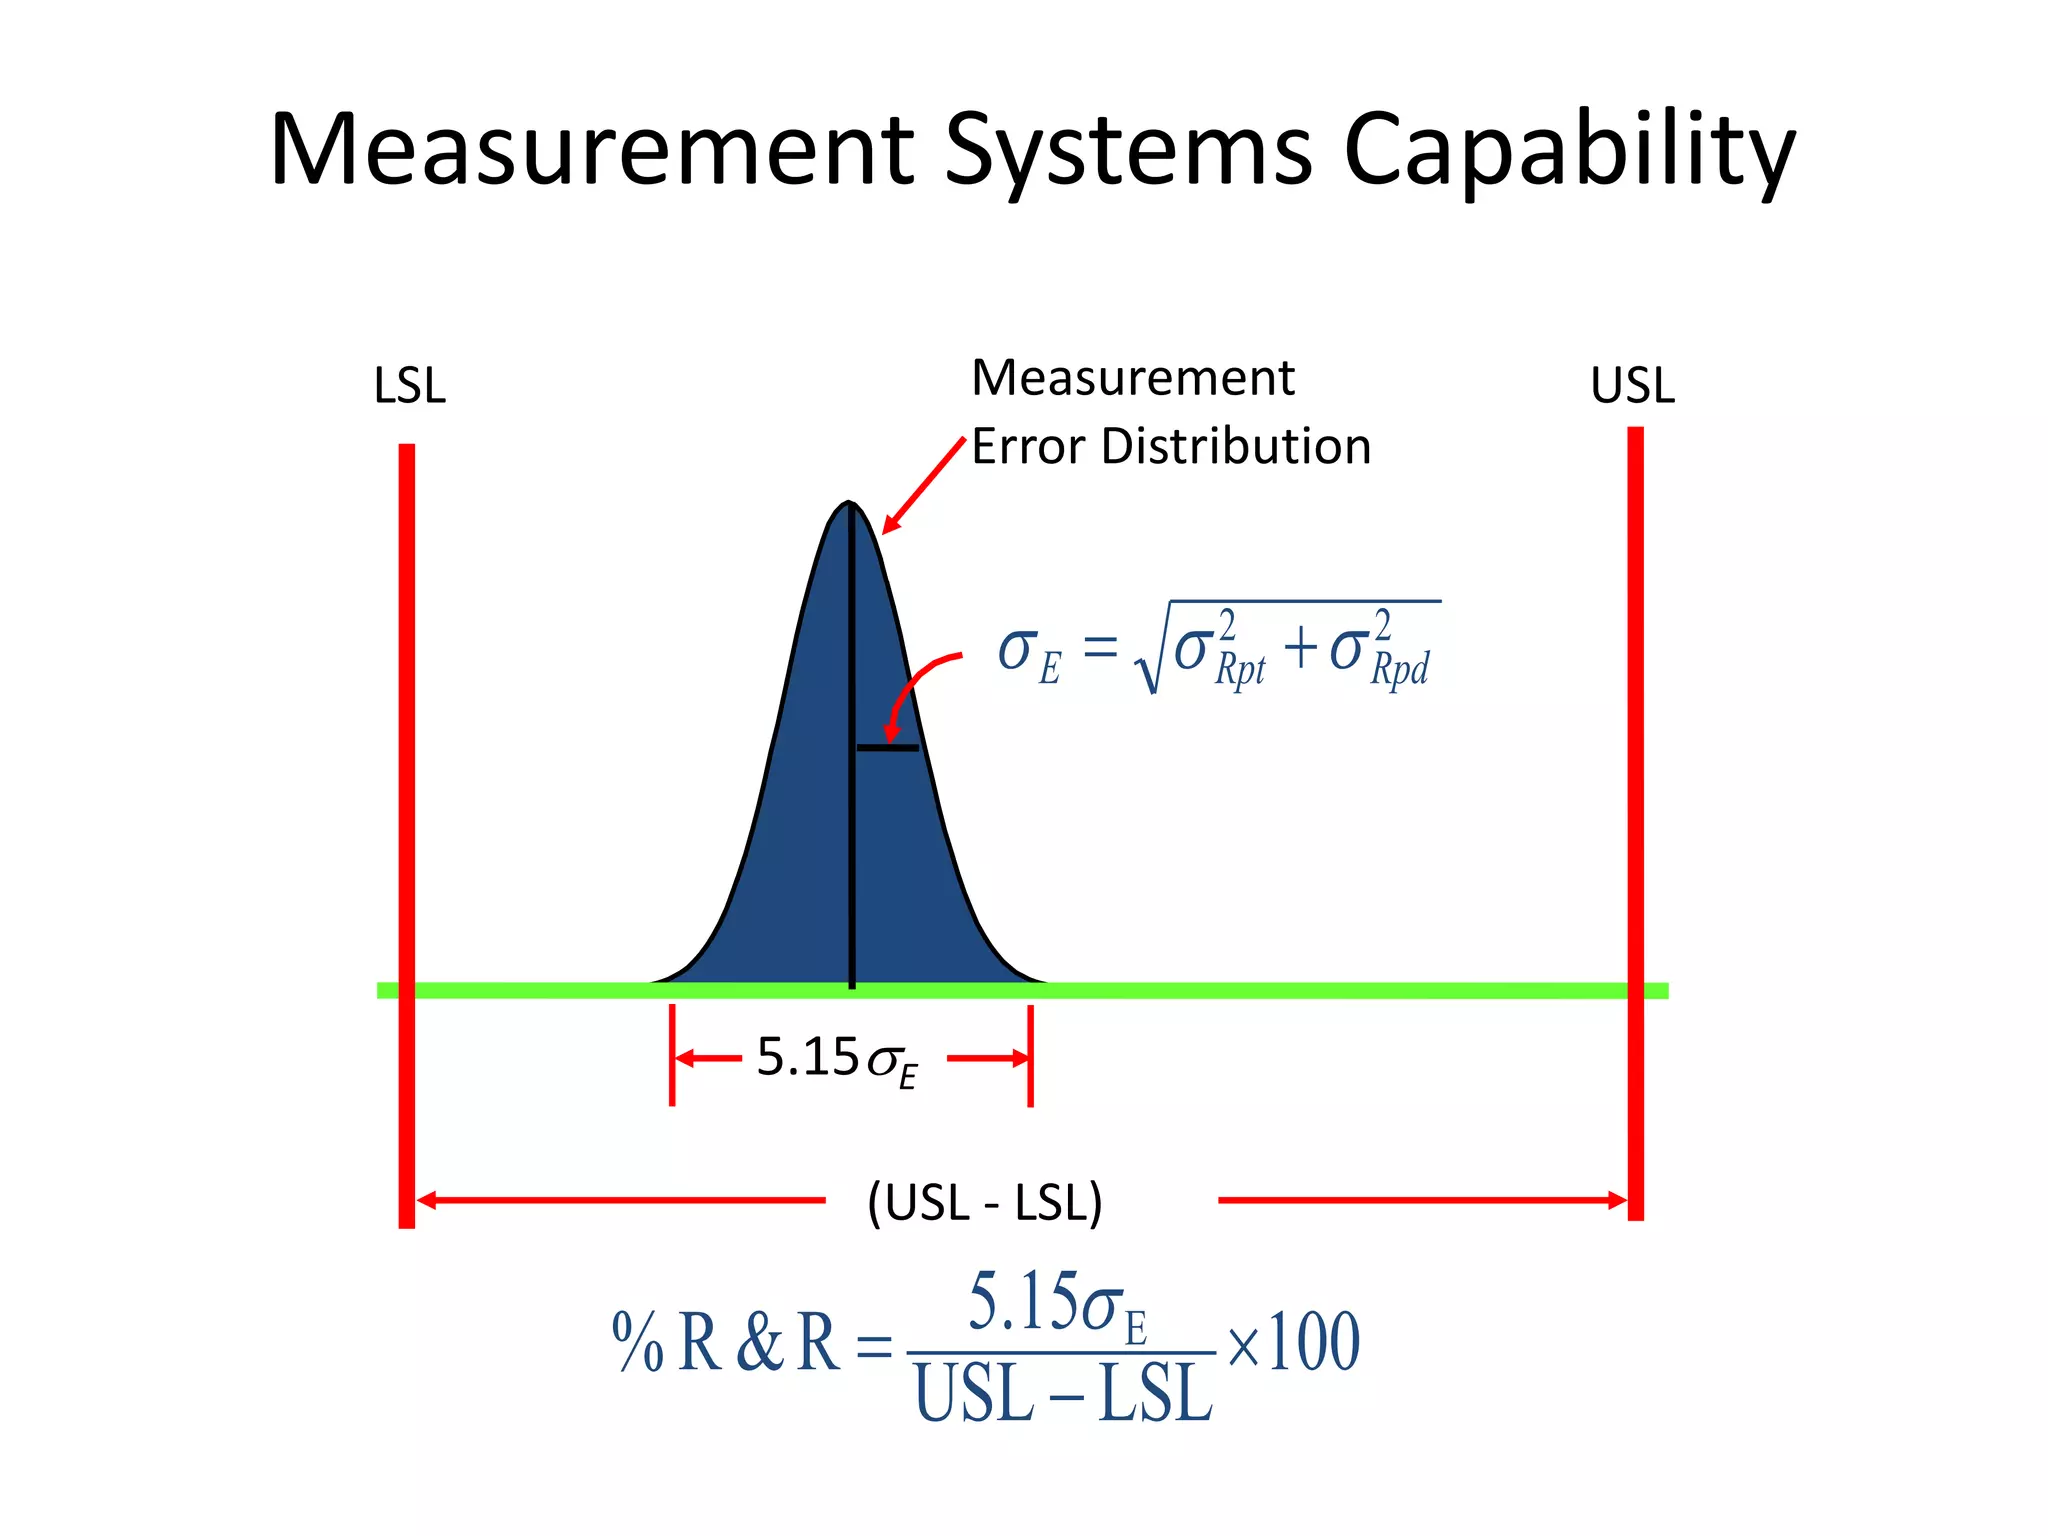
3. Key terms defined include reference value, resolution, precision, accuracy, repeatability, reproducibility, and measurement error. Repeatability and reproducibility are primary contributors to measurement error.
4. Sources of variation include stability, linearity, calibration, operators, and environmental factors.