Download as PDF, PPTX
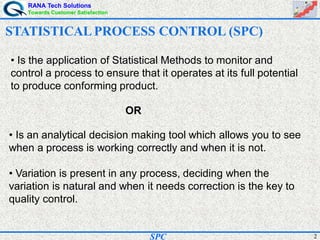
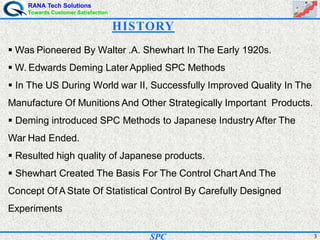
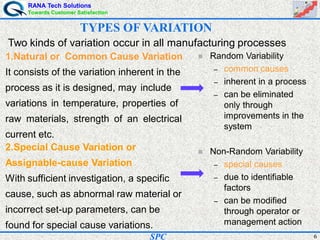
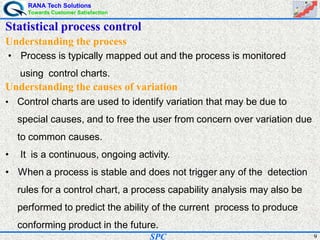
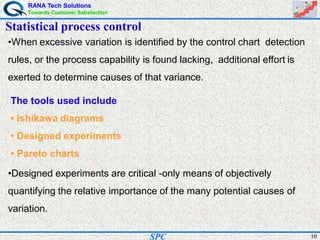
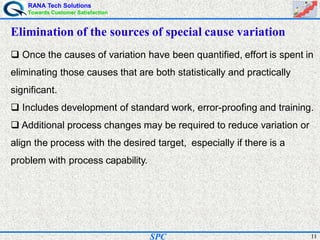
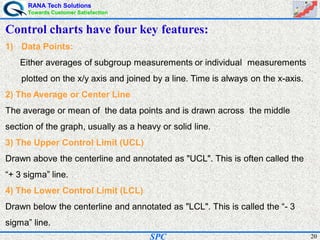
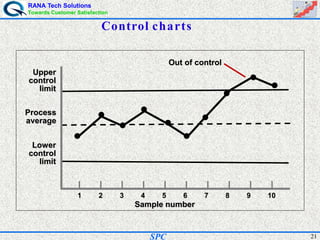
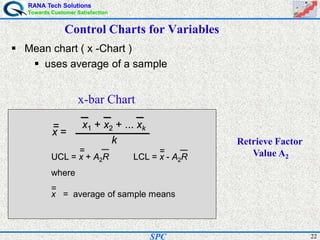
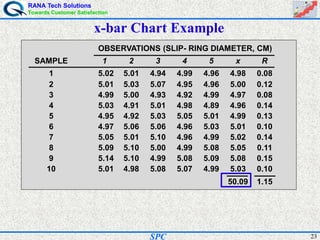
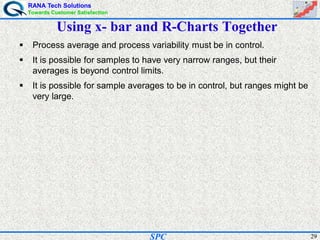
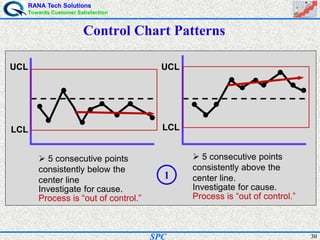
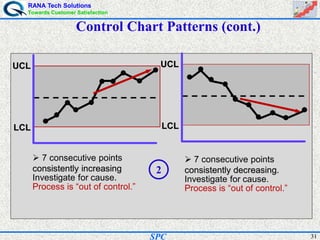
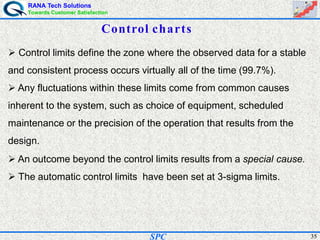


- Statistical process control (SPC) is a method for monitoring and controlling a process to ensure it operates at its full potential and produces conforming product. Variation exists in all processes and SPC helps distinguish between natural and uncontrolled variation. - SPC was pioneered in the 1920s and applied during World War II to improve quality. Control charts are a key SPC tool used to monitor processes over time and identify factors causing non-random variation. The two main types are x-bar charts for variables and R charts for dispersion. Proper application of SPC can reduce waste and costs while improving customer satisfaction.


![7 qc tools training material[1]](https://cdn.slidesharecdn.com/ss_thumbnails/7qctoolstrainingmaterial1-120925054558-phpapp02-thumbnail.jpg?width=640&height=640&fit=bounds)


