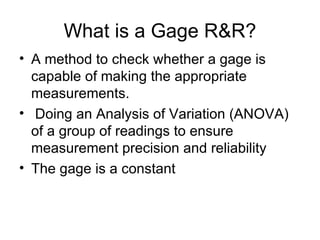
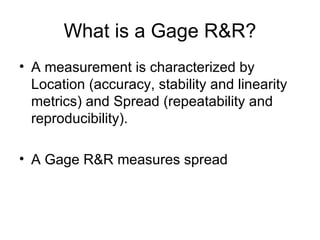
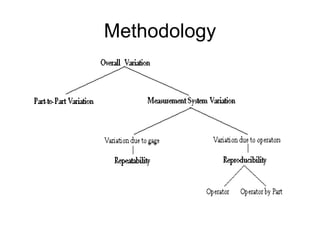
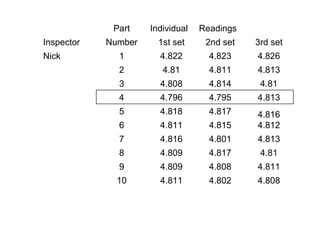
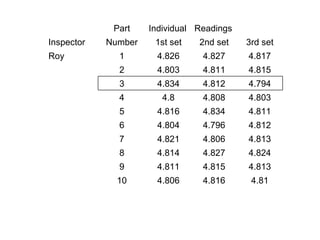
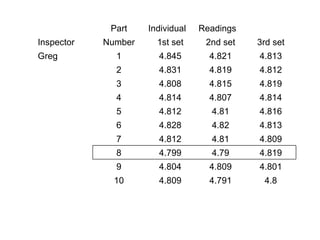
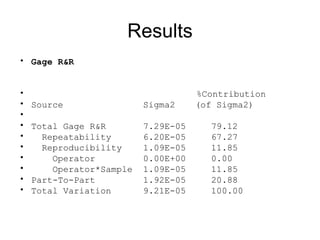
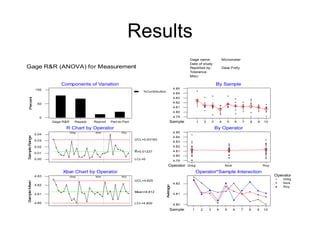
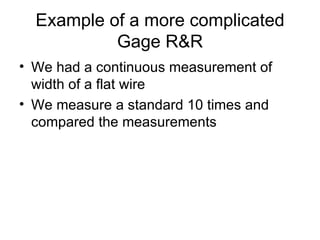
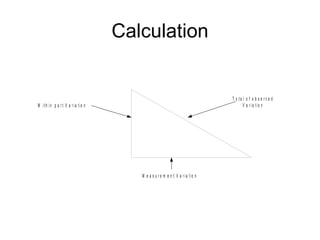
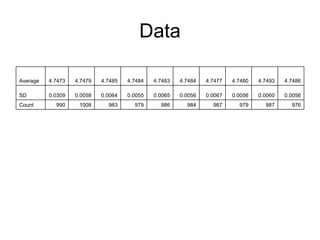
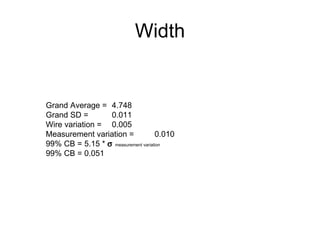
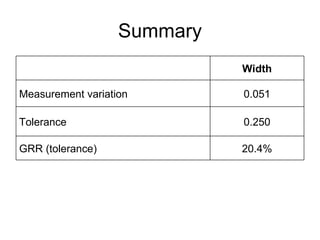
Gage
Repeatability &
Reproducibility
Introduction
•   What is a Gage R&R
•   Definitions
•   Standards that companies use
•   Examples of Gage R&Rs
What will not be covered
• The Equations for Gage R&R
  – There are many statistics programs
  – Go to www.google.com and type in Gage
    R&R and there are work sheets
Example
                                                                      Thickness

          0.0440


          0.0430
Reading


          0.0420


          0.0410


          0.0400
                   1   2   3   4   5   6   7   8   9   10   11   12   13 14   15 16   17 18   19   20   21 22   23 24 25   26 27   28 29   30
                                                                              Count
What is a Gage R&R?
• A method to check whether a gage is
  capable of making the appropriate
  measurements.
• Doing an Analysis of Variation (ANOVA)
  of a group of readings to ensure
  measurement precision and reliability
• The gage is a constant
What is a Gage R&R?
• A measurement is characterized by
  Location (accuracy, stability and linearity
  metrics) and Spread (repeatability and
  reproducibility).

• A Gage R&R measures spread
Definitions
• Variation
  – the differences within a piece, from piece to piece,
    measurement to measurement, and other variation
    such as process step to process step, etc.

• Every process has variation including in
  the measuring gage

• Want to make sure that variation in the
  gage is acceptable
Definitions
• Accuracy
  – Bias. Difference between an average of a
    number of measurements and the true value

• Gage must be accurate

• Test for accuracy is calibration

• The Gage must be calibrated
Definitions
• Repeatability
  – Precision. The ability to repeat the
    measurements by the same operator at or
    near the same time


• Reproducibility
  – Reliability. The ability to reproduce the
    measurements by different operators at
    different times.
Methodology
Standards
• What are some standards that companies
  such as GE are using for acceptable
  gages?
Standards
• For gages that are used to make pass/fail
  decisions < 30% of the process variation
  can come from the gage

• For gages that are used to measure
  improvements in the process < 10% of the
  process variation can come from the gage
Any Questions?
Examples from the simplest
 measuring gages to more
  complicated equipment
Example of a simple Gage R&R
• A micrometer is tested by having 3 people
  measure 5 to 10 parts 3 times each in
  random order
Part    Individual   Readings
Inspector   Number     1st set     2nd set   3rd set
Nick          1        4.822        4.823    4.826
              2         4.81        4.811    4.813
              3        4.808        4.814     4.81
              4        4.796        4.795    4.813
              5        4.818        4.817    4.816
              6        4.811        4.815    4.812
              7        4.816        4.801    4.813
              8        4.809        4.817     4.81
              9        4.809        4.808    4.811
              10       4.811        4.802    4.808
Part    Individual Readings
Inspector   Number    1st set   2nd set    3rd set
Roy           1       4.826      4.827     4.817
              2       4.803      4.811     4.815
              3       4.834      4.812     4.794
              4         4.8      4.808     4.803
              5       4.816      4.834     4.811
              6       4.804      4.796     4.812
              7       4.821      4.806     4.813
              8       4.814      4.827     4.824
              9       4.811      4.815     4.813
              10      4.806      4.816      4.81
Part    Individual   Readings
Inspector   Number     1st set     2nd set   3rd set
Greg          1        4.845        4.821    4.813
              2        4.831        4.819    4.812
              3        4.808        4.815    4.819
              4        4.814        4.807    4.814
              5        4.812        4.81     4.816
              6        4.828        4.82     4.813
              7        4.812        4.81     4.809
              8        4.799        4.79     4.819
              9        4.804        4.809    4.801
              10       4.809        4.791     4.8
Results
• Gage R&R


•                                    %Contribution
•   Source                Sigma2     (of Sigma2)
•
•   Total Gage R&R        7.29E-05     79.12
•     Repeatability       6.20E-05     67.27
•     Reproducibility     1.09E-05     11.85
•       Operator          0.00E+00     0.00
•       Operator*Sample   1.09E-05     11.85
•   Part-To-Part          1.92E-05     20.88
•   Total Variation       9.21E-05     100.00
Results
                                                                                                           Gage name:                        Micrometer
                                                                                                           Date of study:
Gage R&R (ANOVA) for Measurement                                                                           Reported by:                      Dave Potty
                                                                                                           Tolerance:
                                                                                                           Misc:

                              Components of Variation                                                                                By Sample
               100                                                                                 4.85
                                                                             %Contribution
                                                                                                   4.84
                                                                                                   4.83
  Percent


                50                                                                                 4.82
                                                                                                   4.81
                                                                                                   4.80
                 0                                                                                 4.79
                          Gage R&R      Repeat   Reprod   Part-to-Part                        Sample             1       2       3       4        5   6   7   8   9   10

                                R Chart by Operator                                                                                  By Operator
                                     Greg        Nick            Roy                               4.85
               0.04
Sample Range


                                                                                                   4.84
               0.03                                                      UCL=0.03183
                                                                                                   4.83
               0.02                                                                                4.82
                                                                         R=0.01237                 4.81
               0.01
                                                                                                   4.80
               0.00                                                      LCL=0
                                                                                                   4.79
                      0                                                                      Operator     Greg                                Nick                    Roy

                               Xbar Chart by Operator                                                            Operator*Sample Interaction
               4.83                  Greg        Nick            Roy                                                                                                        Operator
                                                                                                                                                                                Greg
                                                                         UCL=4.825
        ean


                                                                                                   4.82                                                                         Nick
               4.82
                                                                                         Average


                                                                                                                                                                                Roy
Sample M


                                                                         Mean=4.812
               4.81                                                                                4.81


               4.80                                                      LCL=4.800                 4.80
                      0                                                                       Sample        1        2       3       4        5       6   7   8   9   10
Example of a more complicated
           Gage R&R
• We had a continuous measurement of
  width of a flat wire
• We measure a standard 10 times and
  compared the measurements
Calculation


                                                                            T o ta l o f o b s e rv e d
W ith in p a r t V a r ia tio n                                                    V a r ia tio n


                                     M e a s u r e m e n t V a r ia tio n
Data

Average   4.7473   4.7479   4.7485   4.7484   4.7483   4.7484   4.7477   4.7480   4.7493   4.7486

SD        0.0309   0.0058   0.0064   0.0055   0.0065   0.0056   0.0067   0.0056   0.0060   0.0056
Count       990     1008      983      979      986      984      987      979      987      976
Width


Grand Average = 4.748
Grand SD =       0.011
Wire variation = 0.005
Measurement variation =             0.010
99% CB = 5.15 * σ measurement variation
99% CB = 0.051
Summary
                             Width

Measurement variation        0.051

Tolerance                    0.250

GRR (tolerance)              20.4%
Review
•   What is a Gage R&R
•   Definitions
•   Standards that companies use
•   Examples of Gage R&Rs
Any Questions?
Thank You!

Gage r&r

  • 1.
  • 2.
    Introduction • What is a Gage R&R • Definitions • Standards that companies use • Examples of Gage R&Rs
  • 3.
    What will notbe covered • The Equations for Gage R&R – There are many statistics programs – Go to www.google.com and type in Gage R&R and there are work sheets
  • 4.
    Example Thickness 0.0440 0.0430 Reading 0.0420 0.0410 0.0400 1 2 3 4 5 6 7 8 9 10 11 12 13 14 15 16 17 18 19 20 21 22 23 24 25 26 27 28 29 30 Count
  • 5.
    What is aGage R&R? • A method to check whether a gage is capable of making the appropriate measurements. • Doing an Analysis of Variation (ANOVA) of a group of readings to ensure measurement precision and reliability • The gage is a constant
  • 6.
    What is aGage R&R? • A measurement is characterized by Location (accuracy, stability and linearity metrics) and Spread (repeatability and reproducibility). • A Gage R&R measures spread
  • 7.
    Definitions • Variation – the differences within a piece, from piece to piece, measurement to measurement, and other variation such as process step to process step, etc. • Every process has variation including in the measuring gage • Want to make sure that variation in the gage is acceptable
  • 8.
    Definitions • Accuracy – Bias. Difference between an average of a number of measurements and the true value • Gage must be accurate • Test for accuracy is calibration • The Gage must be calibrated
  • 9.
    Definitions • Repeatability – Precision. The ability to repeat the measurements by the same operator at or near the same time • Reproducibility – Reliability. The ability to reproduce the measurements by different operators at different times.
  • 10.
  • 11.
    Standards • What aresome standards that companies such as GE are using for acceptable gages?
  • 12.
    Standards • For gagesthat are used to make pass/fail decisions < 30% of the process variation can come from the gage • For gages that are used to measure improvements in the process < 10% of the process variation can come from the gage
  • 13.
  • 14.
    Examples from thesimplest measuring gages to more complicated equipment
  • 15.
    Example of asimple Gage R&R • A micrometer is tested by having 3 people measure 5 to 10 parts 3 times each in random order
  • 16.
    Part Individual Readings Inspector Number 1st set 2nd set 3rd set Nick 1 4.822 4.823 4.826 2 4.81 4.811 4.813 3 4.808 4.814 4.81 4 4.796 4.795 4.813 5 4.818 4.817 4.816 6 4.811 4.815 4.812 7 4.816 4.801 4.813 8 4.809 4.817 4.81 9 4.809 4.808 4.811 10 4.811 4.802 4.808
  • 17.
    Part Individual Readings Inspector Number 1st set 2nd set 3rd set Roy 1 4.826 4.827 4.817 2 4.803 4.811 4.815 3 4.834 4.812 4.794 4 4.8 4.808 4.803 5 4.816 4.834 4.811 6 4.804 4.796 4.812 7 4.821 4.806 4.813 8 4.814 4.827 4.824 9 4.811 4.815 4.813 10 4.806 4.816 4.81
  • 18.
    Part Individual Readings Inspector Number 1st set 2nd set 3rd set Greg 1 4.845 4.821 4.813 2 4.831 4.819 4.812 3 4.808 4.815 4.819 4 4.814 4.807 4.814 5 4.812 4.81 4.816 6 4.828 4.82 4.813 7 4.812 4.81 4.809 8 4.799 4.79 4.819 9 4.804 4.809 4.801 10 4.809 4.791 4.8
  • 19.
    Results • Gage R&R • %Contribution • Source Sigma2 (of Sigma2) • • Total Gage R&R 7.29E-05 79.12 • Repeatability 6.20E-05 67.27 • Reproducibility 1.09E-05 11.85 • Operator 0.00E+00 0.00 • Operator*Sample 1.09E-05 11.85 • Part-To-Part 1.92E-05 20.88 • Total Variation 9.21E-05 100.00
  • 20.
    Results Gage name: Micrometer Date of study: Gage R&R (ANOVA) for Measurement Reported by: Dave Potty Tolerance: Misc: Components of Variation By Sample 100 4.85 %Contribution 4.84 4.83 Percent 50 4.82 4.81 4.80 0 4.79 Gage R&R Repeat Reprod Part-to-Part Sample 1 2 3 4 5 6 7 8 9 10 R Chart by Operator By Operator Greg Nick Roy 4.85 0.04 Sample Range 4.84 0.03 UCL=0.03183 4.83 0.02 4.82 R=0.01237 4.81 0.01 4.80 0.00 LCL=0 4.79 0 Operator Greg Nick Roy Xbar Chart by Operator Operator*Sample Interaction 4.83 Greg Nick Roy Operator Greg UCL=4.825 ean 4.82 Nick 4.82 Average Roy Sample M Mean=4.812 4.81 4.81 4.80 LCL=4.800 4.80 0 Sample 1 2 3 4 5 6 7 8 9 10
  • 21.
    Example of amore complicated Gage R&R • We had a continuous measurement of width of a flat wire • We measure a standard 10 times and compared the measurements
  • 22.
    Calculation T o ta l o f o b s e rv e d W ith in p a r t V a r ia tio n V a r ia tio n M e a s u r e m e n t V a r ia tio n
  • 23.
    Data Average 4.7473 4.7479 4.7485 4.7484 4.7483 4.7484 4.7477 4.7480 4.7493 4.7486 SD 0.0309 0.0058 0.0064 0.0055 0.0065 0.0056 0.0067 0.0056 0.0060 0.0056 Count 990 1008 983 979 986 984 987 979 987 976
  • 24.
    Width Grand Average =4.748 Grand SD = 0.011 Wire variation = 0.005 Measurement variation = 0.010 99% CB = 5.15 * σ measurement variation 99% CB = 0.051
  • 25.
    Summary Width Measurement variation 0.051 Tolerance 0.250 GRR (tolerance) 20.4%
  • 26.
    Review • What is a Gage R&R • Definitions • Standards that companies use • Examples of Gage R&Rs
  • 27.
  • 28.