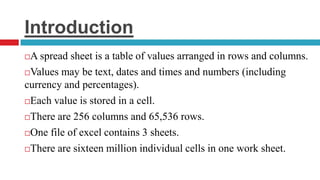
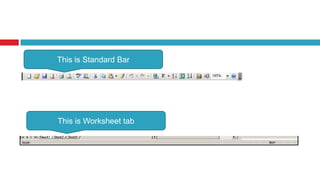
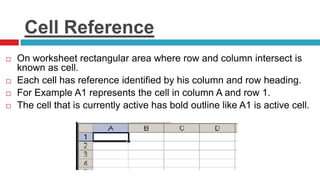
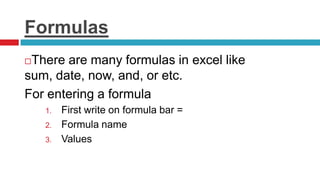
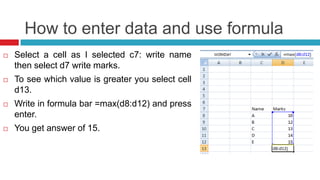
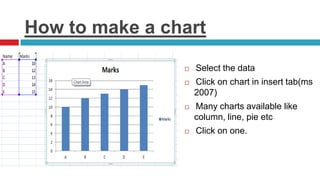
INTRODUCTION OF MICRO
SOFT EXCEL


      Presented By: Muhammad Zeeshan Baloch
Introduction
A spread sheet is a table of values arranged in rows and columns.
Values may be text, dates and times and numbers (including

currency and percentages).
Each value is stored in a cell.

There are 256 columns and 65,536 rows.

One file of excel contains 3 sheets.

There are sixteen million individual cells in one work sheet.
Excel Screen View
Cnt…
     This is title Bar


    This is Menu Bar


  This is Formatting Bar
This is Standard Bar


This is Worksheet tab
Cell Reference
   On worksheet rectangular area where row and column intersect is
    known as cell.
   Each cell has reference identified by his column and row heading.
   For Example A1 represents the cell in column A and row 1.
   The cell that is currently active has bold outline like A1 is active cell.
Formulas
There are many formulas in excel like
sum, date, now, and, or etc.
For entering a formula
    1.   First write on formula bar =
    2.   Formula name
    3.   Values
How to enter data and use formula
   Select a cell as I selected c7: write name
    then select d7 write marks.
   To see which value is greater you select cell
    d13.
   Write in formula bar =max(d8:d12) and press
    enter.
   You get answer of 15.
How to make a chart

                   Select the data
                   Click on chart in insert tab(ms
                    2007)
                   Many charts available like
                    column, line, pie etc
                   Click on one.

Introduction of ms excel

  • 1.
    INTRODUCTION OF MICRO SOFTEXCEL Presented By: Muhammad Zeeshan Baloch
  • 2.
    Introduction A spread sheetis a table of values arranged in rows and columns. Values may be text, dates and times and numbers (including currency and percentages). Each value is stored in a cell. There are 256 columns and 65,536 rows. One file of excel contains 3 sheets. There are sixteen million individual cells in one work sheet.
  • 3.
  • 4.
    Cnt… This is title Bar This is Menu Bar This is Formatting Bar
  • 5.
    This is StandardBar This is Worksheet tab
  • 6.
    Cell Reference  On worksheet rectangular area where row and column intersect is known as cell.  Each cell has reference identified by his column and row heading.  For Example A1 represents the cell in column A and row 1.  The cell that is currently active has bold outline like A1 is active cell.
  • 7.
    Formulas There are manyformulas in excel like sum, date, now, and, or etc. For entering a formula 1. First write on formula bar = 2. Formula name 3. Values
  • 8.
    How to enterdata and use formula  Select a cell as I selected c7: write name then select d7 write marks.  To see which value is greater you select cell d13.  Write in formula bar =max(d8:d12) and press enter.  You get answer of 15.
  • 9.
    How to makea chart  Select the data  Click on chart in insert tab(ms 2007)  Many charts available like column, line, pie etc  Click on one.