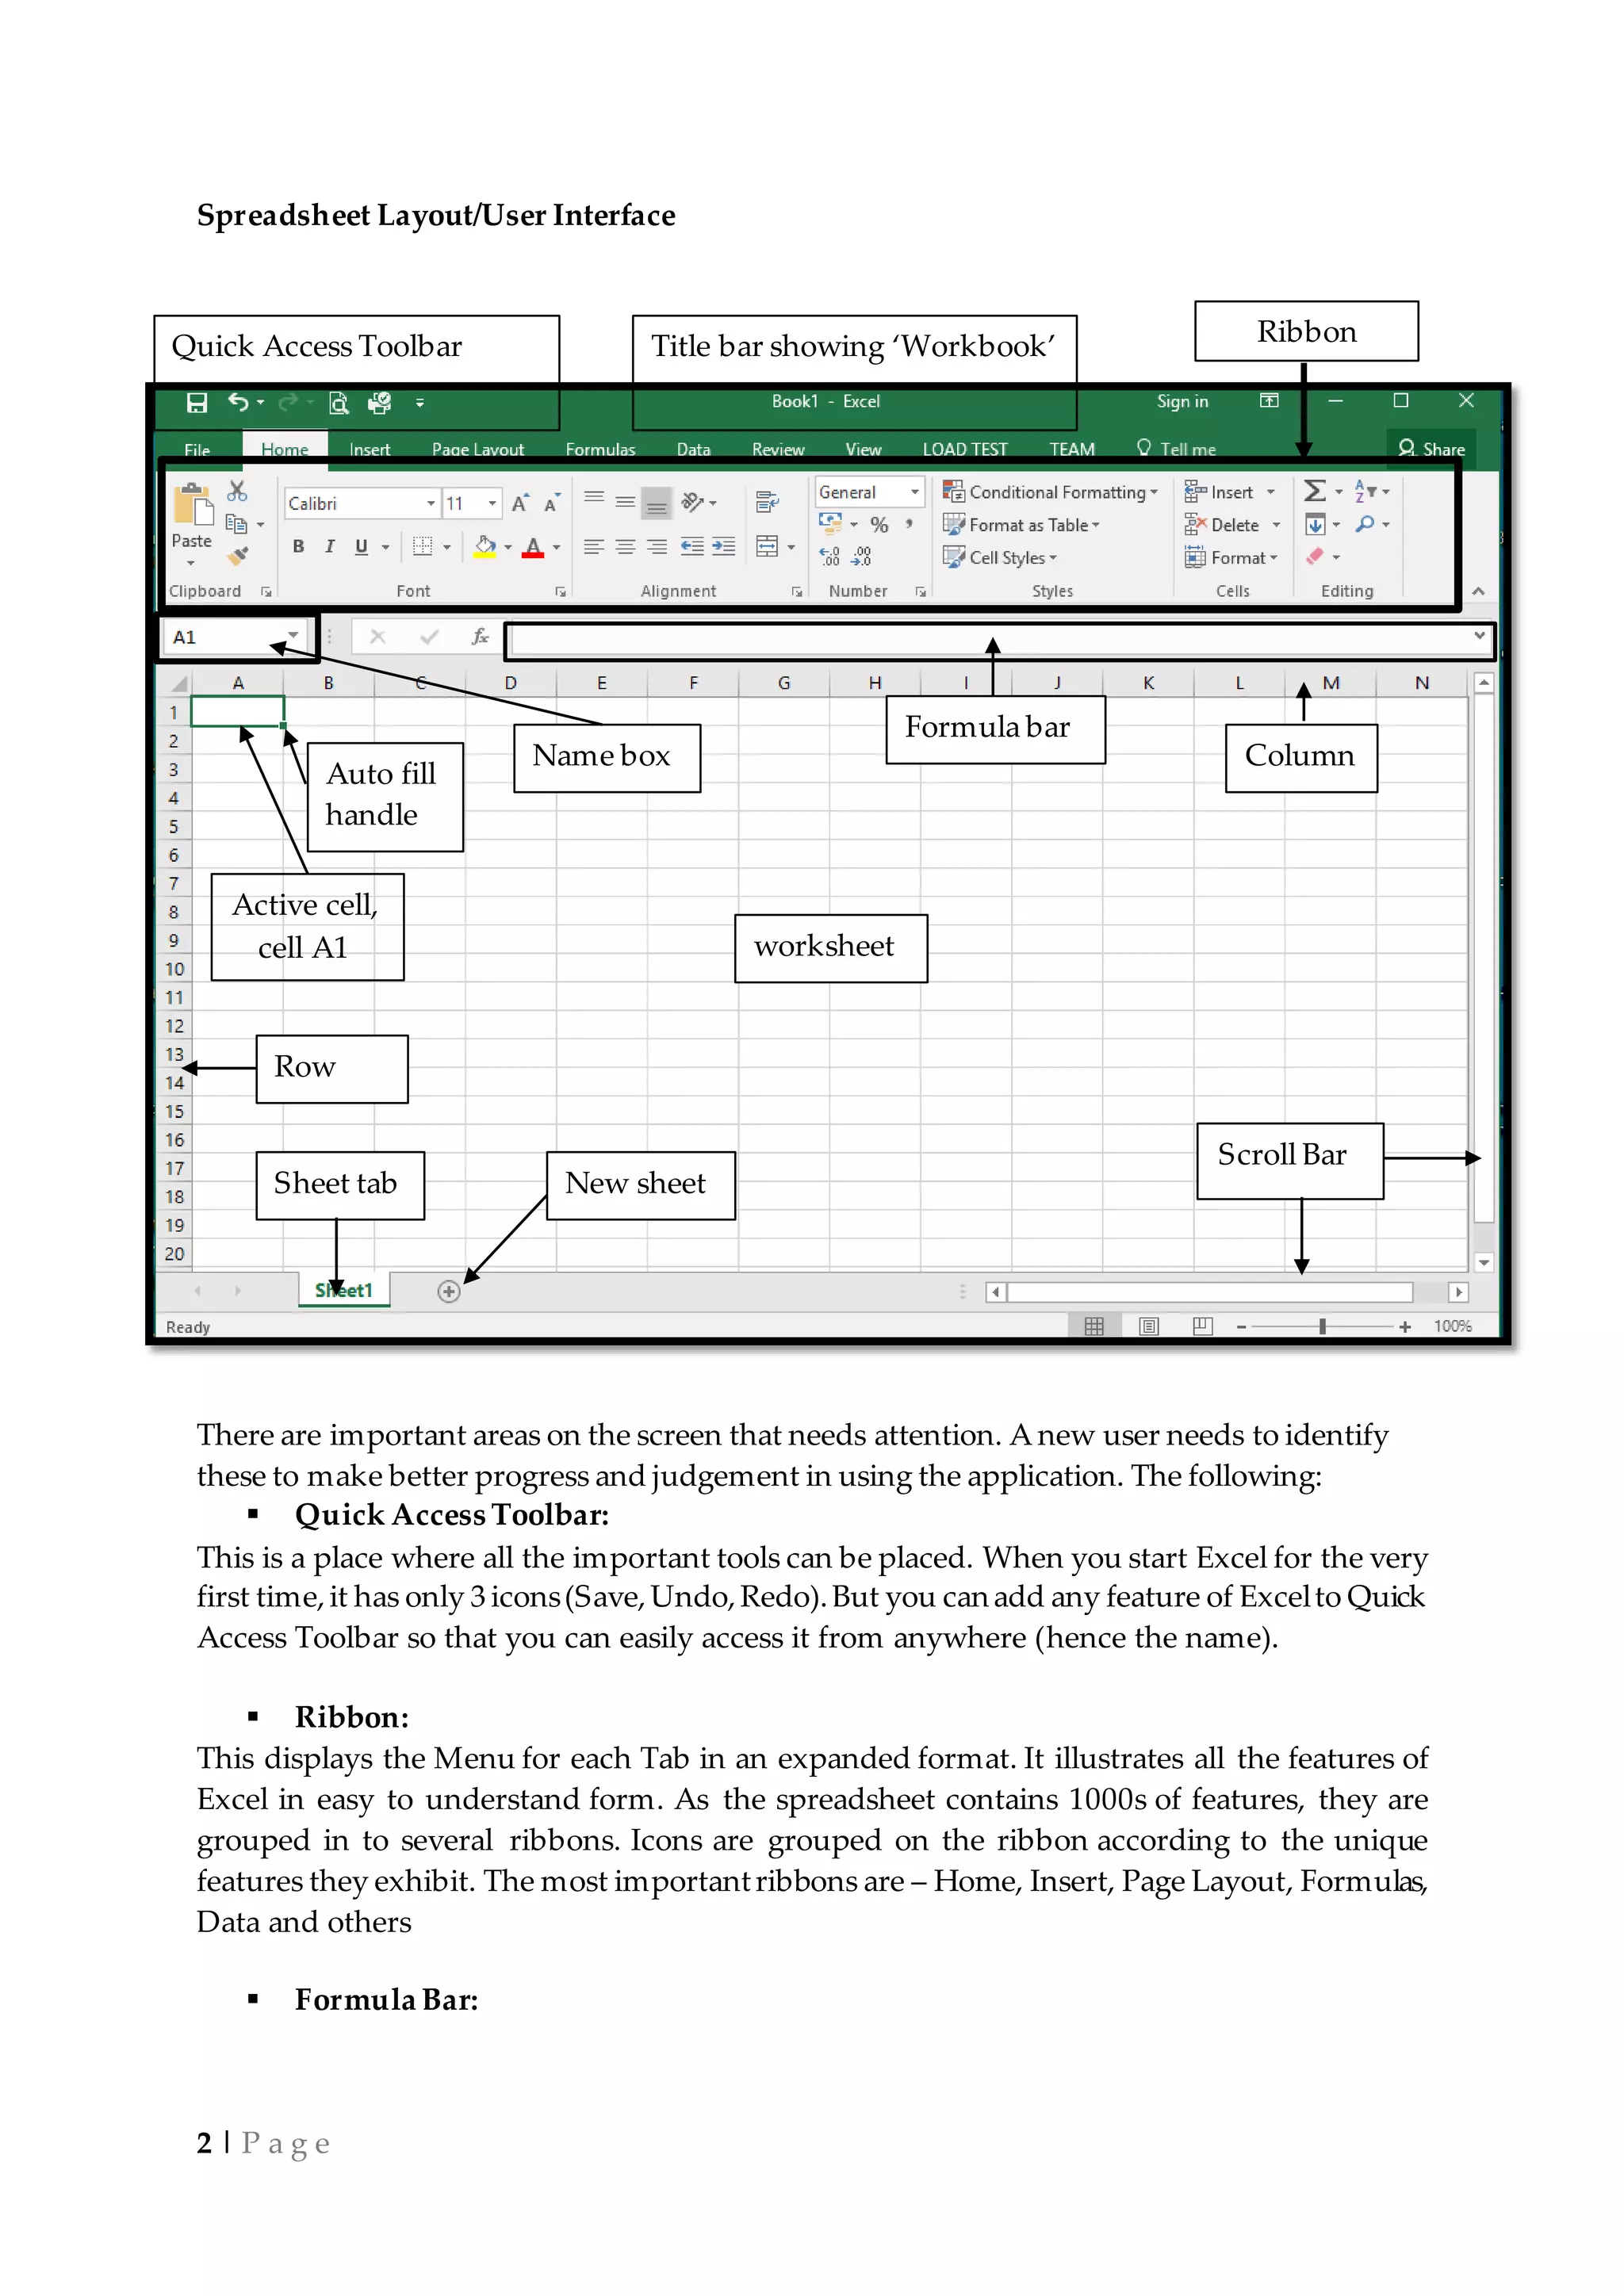
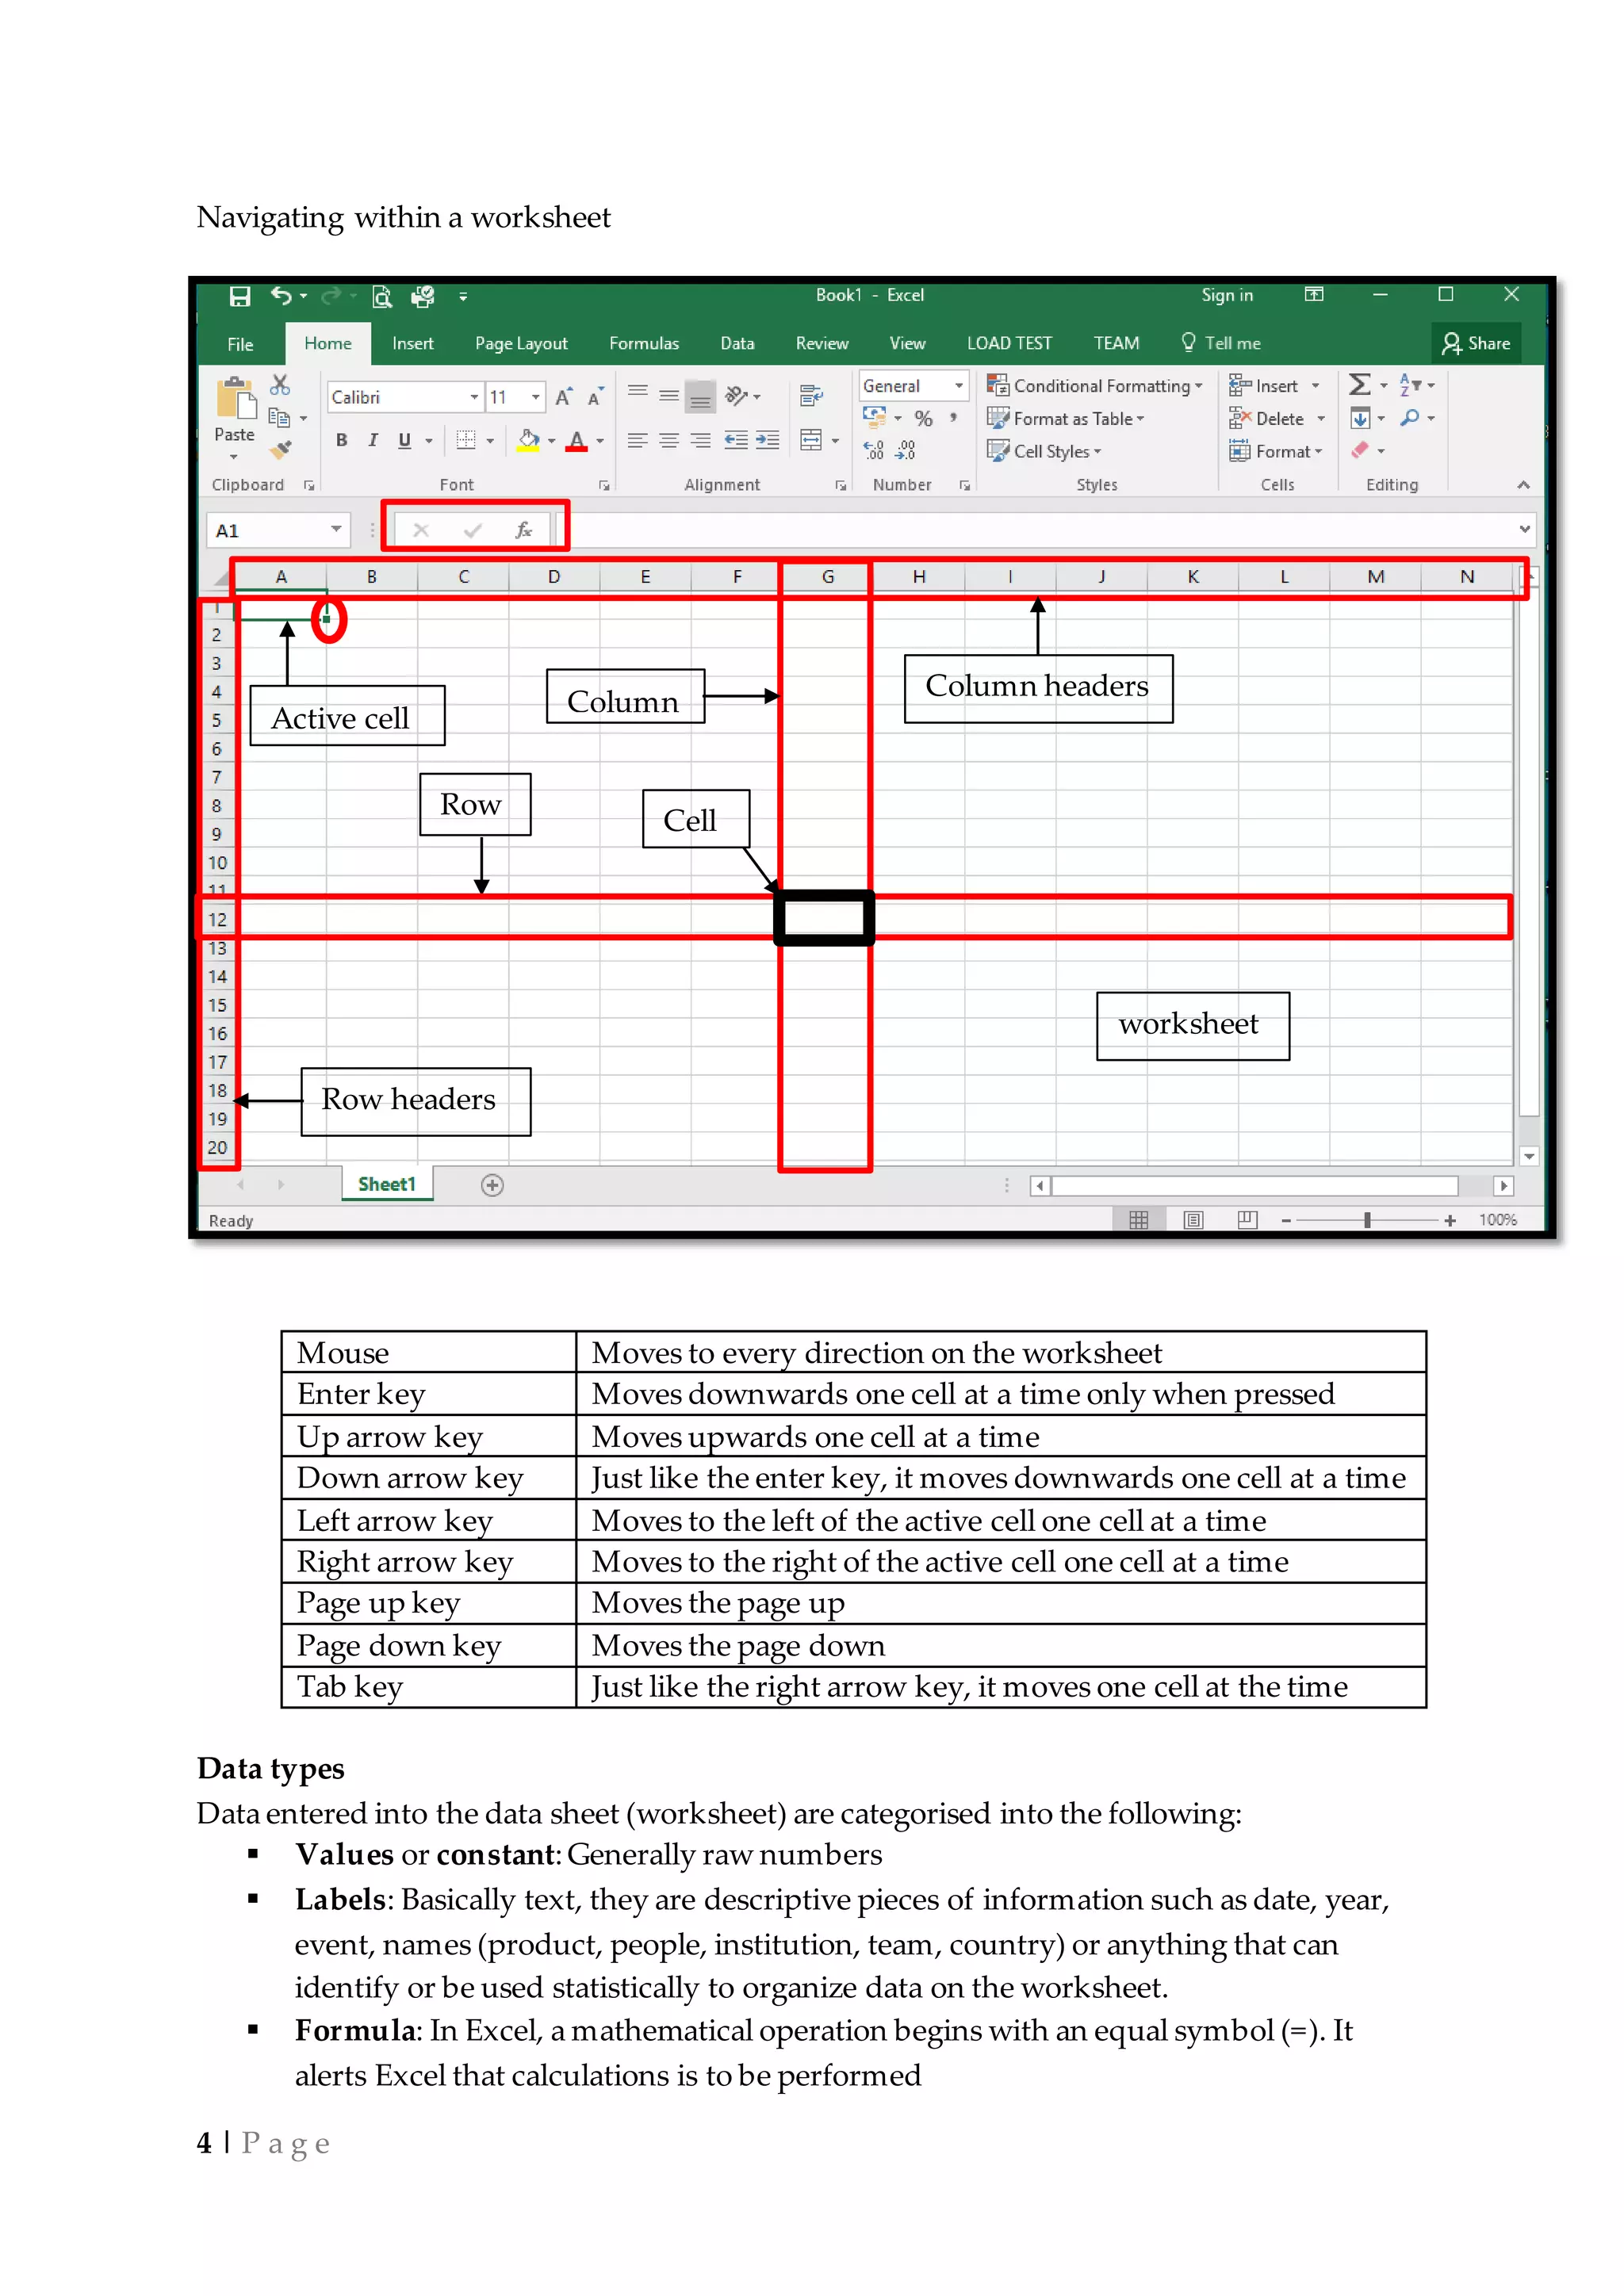
This document provides an introduction to using Microsoft Excel spreadsheets. It discusses the layout of an Excel workbook and worksheet, including cells, columns, rows, and other interface elements like the ribbon and formula bar. It explains how to navigate within a worksheet using keys, buttons and the mouse. The document also covers entering different data types into cells, customizing worksheets by renaming tabs and inserting new sheets, and resizing cells to fit text. Formulas can be added to cells from the formula bar and auto-filled into adjacent cells.
Excel – is the world’s most widely used spreadsheet calculating program
It is used in many places like hospitals, hotels, school and companies etc.
A program that allows you to use data to forecast, manage, predict, and present information
Lets Just Go For It! Wish you an Awesome Leaning Experience.
Subscribe to our YouTube channel: https://www.youtube.com/c/TimesRide?sub_confirmation=1
Our Official Website: http://timesride.com
Follow us:
Facebook: https://www.facebook.com/rs.agrawal.9026
Instagram: https://www.instagram.com/timesridenetwork/
Twitter: https://twitter.com/TimesRide
Pinterest: https://in.pinterest.com/ride0472/
Thank You
#AwesomeLearningExperience
#SmartQuickTips&Tricks #LeaningVideos #TimesRide #Keep Learning to Keep Winning!
Watch this with a 10-15 minute audiotrack at http://vimeo.com/novusprogram/powerpoint1
This lesson provides information on the basics of PowerPoint, Microsoft’s powerful presentation development tool. The topics covered include a basic review of the program’s toolbars and options, and an introduction to slide creation. The objective of the lesson is for the user to be comfortable with operations like opening and creating PowerPoint documents, saving PowerPoint documents, navigating the options and toolbar, adding new slides, formatting text, formatting textboxes, using different program views, and starting a presentation. The lesson teaches concepts through a combination of image-based slides and video tutorials.
The Novus project is a combination of video tutorials designed to be used in conjunction with a free business simulation software program. The Novus Business and IT Program contains 36 business and IT training videos, covering basic finance, accounting, marketing, economics, business strategy, Word, Excel, and PowerPoint. Users will have an opportunity to apply the lessons in the Novus Business Simulator. Over six rounds, the user or teams will have to make decisions on capital purchases, financing, production, financing, and human resources for a microbrewery. This channel has arranged the 36 video lessons into the order in which they are meant to be used with the simulator. To watch this slideshow as a video, please go to our Vimeo page at: https://vimeo.com/novusprogram. To download our free business simulation software, please go to our SourceForge page at: http://sourceforge.net/projects/novus/.
For full text article go to : http://www.excel-microsoft-excel.com/excel-for-dummies/
This article on "Excel for dummies" showcases basic yet important tools of Excel - ut copy paste and important shortcuts etc that can be useful in the daily life.
The Roman Empire A Historical Colossus.pdfkaushalkr1407
The Roman Empire, a vast and enduring power, stands as one of history's most remarkable civilizations, leaving an indelible imprint on the world. It emerged from the Roman Republic, transitioning into an imperial powerhouse under the leadership of Augustus Caesar in 27 BCE. This transformation marked the beginning of an era defined by unprecedented territorial expansion, architectural marvels, and profound cultural influence.
The empire's roots lie in the city of Rome, founded, according to legend, by Romulus in 753 BCE. Over centuries, Rome evolved from a small settlement to a formidable republic, characterized by a complex political system with elected officials and checks on power. However, internal strife, class conflicts, and military ambitions paved the way for the end of the Republic. Julius Caesar’s dictatorship and subsequent assassination in 44 BCE created a power vacuum, leading to a civil war. Octavian, later Augustus, emerged victorious, heralding the Roman Empire’s birth.
Under Augustus, the empire experienced the Pax Romana, a 200-year period of relative peace and stability. Augustus reformed the military, established efficient administrative systems, and initiated grand construction projects. The empire's borders expanded, encompassing territories from Britain to Egypt and from Spain to the Euphrates. Roman legions, renowned for their discipline and engineering prowess, secured and maintained these vast territories, building roads, fortifications, and cities that facilitated control and integration.
The Roman Empire’s society was hierarchical, with a rigid class system. At the top were the patricians, wealthy elites who held significant political power. Below them were the plebeians, free citizens with limited political influence, and the vast numbers of slaves who formed the backbone of the economy. The family unit was central, governed by the paterfamilias, the male head who held absolute authority.
Culturally, the Romans were eclectic, absorbing and adapting elements from the civilizations they encountered, particularly the Greeks. Roman art, literature, and philosophy reflected this synthesis, creating a rich cultural tapestry. Latin, the Roman language, became the lingua franca of the Western world, influencing numerous modern languages.
Roman architecture and engineering achievements were monumental. They perfected the arch, vault, and dome, constructing enduring structures like the Colosseum, Pantheon, and aqueducts. These engineering marvels not only showcased Roman ingenuity but also served practical purposes, from public entertainment to water supply.
The French Revolution, which began in 1789, was a period of radical social and political upheaval in France. It marked the decline of absolute monarchies, the rise of secular and democratic republics, and the eventual rise of Napoleon Bonaparte. This revolutionary period is crucial in understanding the transition from feudalism to modernity in Europe.
For more information, visit-www.vavaclasses.com
A Strategic Approach: GenAI in EducationPeter Windle
Artificial Intelligence (AI) technologies such as Generative AI, Image Generators and Large Language Models have had a dramatic impact on teaching, learning and assessment over the past 18 months. The most immediate threat AI posed was to Academic Integrity with Higher Education Institutes (HEIs) focusing their efforts on combating the use of GenAI in assessment. Guidelines were developed for staff and students, policies put in place too. Innovative educators have forged paths in the use of Generative AI for teaching, learning and assessments leading to pockets of transformation springing up across HEIs, often with little or no top-down guidance, support or direction.
This Gasta posits a strategic approach to integrating AI into HEIs to prepare staff, students and the curriculum for an evolving world and workplace. We will highlight the advantages of working with these technologies beyond the realm of teaching, learning and assessment by considering prompt engineering skills, industry impact, curriculum changes, and the need for staff upskilling. In contrast, not engaging strategically with Generative AI poses risks, including falling behind peers, missed opportunities and failing to ensure our graduates remain employable. The rapid evolution of AI technologies necessitates a proactive and strategic approach if we are to remain relevant.
Honest Reviews of Tim Han LMA Course Program.pptxtimhan337
Personal development courses are widely available today, with each one promising life-changing outcomes. Tim Han’s Life Mastery Achievers (LMA) Course has drawn a lot of interest. In addition to offering my frank assessment of Success Insider’s LMA Course, this piece examines the course’s effects via a variety of Tim Han LMA course reviews and Success Insider comments.
Francesca Gottschalk - How can education support child empowerment.pptxEduSkills OECD
Francesca Gottschalk from the OECD’s Centre for Educational Research and Innovation presents at the Ask an Expert Webinar: How can education support child empowerment?
Embracing GenAI - A Strategic ImperativePeter Windle
Artificial Intelligence (AI) technologies such as Generative AI, Image Generators and Large Language Models have had a dramatic impact on teaching, learning and assessment over the past 18 months. The most immediate threat AI posed was to Academic Integrity with Higher Education Institutes (HEIs) focusing their efforts on combating the use of GenAI in assessment. Guidelines were developed for staff and students, policies put in place too. Innovative educators have forged paths in the use of Generative AI for teaching, learning and assessments leading to pockets of transformation springing up across HEIs, often with little or no top-down guidance, support or direction.
This Gasta posits a strategic approach to integrating AI into HEIs to prepare staff, students and the curriculum for an evolving world and workplace. We will highlight the advantages of working with these technologies beyond the realm of teaching, learning and assessment by considering prompt engineering skills, industry impact, curriculum changes, and the need for staff upskilling. In contrast, not engaging strategically with Generative AI poses risks, including falling behind peers, missed opportunities and failing to ensure our graduates remain employable. The rapid evolution of AI technologies necessitates a proactive and strategic approach if we are to remain relevant.
Acetabularia Information For Class 9 .docxvaibhavrinwa19
Acetabularia acetabulum is a single-celled green alga that in its vegetative state is morphologically differentiated into a basal rhizoid and an axially elongated stalk, which bears whorls of branching hairs. The single diploid nucleus resides in the rhizoid.
How to Make a Field invisible in Odoo 17Celine George
It is possible to hide or invisible some fields in odoo. Commonly using “invisible” attribute in the field definition to invisible the fields. This slide will show how to make a field invisible in odoo 17.
Biological screening of herbal drugs: Introduction and Need for
Phyto-Pharmacological Screening, New Strategies for evaluating
Natural Products, In vitro evaluation techniques for Antioxidants, Antimicrobial and Anticancer drugs. In vivo evaluation techniques
for Anti-inflammatory, Antiulcer, Anticancer, Wound healing, Antidiabetic, Hepatoprotective, Cardio protective, Diuretics and
Antifertility, Toxicity studies as per OECD guidelines
Read| The latest issue of The Challenger is here! We are thrilled to announce that our school paper has qualified for the NATIONAL SCHOOLS PRESS CONFERENCE (NSPC) 2024. Thank you for your unwavering support and trust. Dive into the stories that made us stand out!
TESDA TM1 REVIEWER FOR NATIONAL ASSESSMENT WRITTEN AND ORAL QUESTIONS WITH A...
Lesson 1 introduction to spreadsheet
1. 1 | P a g e
Welcome to Elective ICT for SHS 2
Lesson 1 - Introduction to Spreadsheet Application
Introduction:
RPK
Every month we try to organise how we spend our money. Whenever we receive money we
try to prioritise our needs and spend money on them. List some of the things we consider
important before committing to it.
Objectives:
In this lesson, we will look at the following:
Layout of Microsoft office Excel Spreadsheet application
Differentiate a workbook from a worksheet
Customize a worksheet
Navigate within the worksheet
Categorise the data entered onto the spreadsheet
Resize cells
Notes:
It is very easy to get confused once you launch Microsoft Excel Application. The basic
endurance skills is to understand how to navigate within the Excel Application and access the
features you are looking for.
Getting Started with Microsoft Excel Application
Starting Microsoft Excel
Click the start button
Click Programs
Look for Microsoft Office Excel
Click to launch Microsoft Excel
Microsoft Excel Application contains vertical lines (Columns) and horizontal lines (Rows)
also called grid lines. Columns and rows intersect to form a cell. Each cell is referenced by
an address in a format Letter and a Number. The lines will not show when printed unless a
border is added or inserted. Columns are identified by the column heading which is labelled
bya letter andthe row headingidentifiedbynumberse.g. A1.TheletterA representscolumn
A and the number 1 represents row number 1. An excel file is called a workbook, a workbook
contains worksheet.
2. 2 | P a g e
Spreadsheet Layout/User Interface
There are important areas on the screen that needs attention. A new user needs to identify
these to make better progress and judgement in using the application. The following:
Quick Access Toolbar:
This is a place where all the important tools can be placed. When you start Excel for the very
first time,it has only 3 icons(Save,Undo,Redo).But you canadd any feature of Excelto Quick
Access Toolbar so that you can easily access it from anywhere (hence the name).
Ribbon:
This displays the Menu for each Tab in an expanded format. It illustrates all the features of
Excel in easy to understand form. As the spreadsheet contains 1000s of features, they are
grouped in to several ribbons. Icons are grouped on the ribbon according to the unique
features they exhibit. The most importantribbons are – Home, Insert, Page Layout, Formulas,
Data and others
Formula Bar:
Active cell,
cell A1
Scroll Bar
Sheet tab
Column
Row
worksheet
Formula bar
Auto fill
handle
Name box
Title bar showing ‘Workbook’Quick Access Toolbar Ribbon
New sheet
3. 3 | P a g e
This is where any calculations or formulas you write will appear. You will understand the
relevance of it once you start building formulas.
Spreadsheet Grid:
This is where all your numbers, data, charts & drawings will go. Each Excel file can contain
several sheets. But the spreadsheet grid shows few rows & columns of active spreadsheet. To
see more rows or columns you can use the scroll bars to the left or at bottom. If you want to
access other sheets, just click on the sheet name (or use the shortcut CTRL+Page Up or
CTRL+Page Down).
Status bar:
This tells us what is going on with Excel at any time. You can tell if Excel is busy calculating
a formula, creating a pivot report or recording a macro by just looking at the status bar. The
status bar also shows quick summaries of selected cells (count, sum, average, minimum or
maximum values). You can change this by right clicking on it and choosing which summaries
to show.
Name Description
Title bar The title bar spans the top of the program window and displays the
name of the workbook and the program. The buttons on the right side
of the Title bar are used to get help; change the display of the Ribbon;
and minimize, restore, maximize, and close the program window.
Quick Access
Toolbar
Appears on the left side of the Title bar and contains frequently used
commands that are independent of the tab displayed on the Ribbon.
Ribbon Extends across the top of the program window, directly below the
Title bar, and consists of a set of tabs, each of which contains groups of
related commands.
Formula bar Appears below the Ribbon and displays the data or formula stored in
the active cell. It can also be used to enter or edit cell contents.
Name Box Appears on the left side of the Formula bar and displays the active cell
address or the name of the selected cell, range, or object.
Sheet tab Each worksheet has a tab that appears below the workbook window
and displays the name of the worksheet.
Scroll bars Appear along the right side and bottom of the workbook window and
enable you to scroll through the worksheet.
Status bar Appears at the bottom of the program window and displays the status
of Excel (such as Ready). The tools on the right side of the Status bar
can be used to display the worksheet in a variety of views and to
change the zoom level.
4. 4 | P a g e
Navigating within a worksheet
Mouse Moves to every direction on the worksheet
Enter key Moves downwards one cell at a time only when pressed
Up arrow key Moves upwards one cell at a time
Down arrow key Just like the enter key, it moves downwards one cell at a time
Left arrow key Moves to the left of the active cell one cell at a time
Right arrow key Moves to the right of the active cell one cell at a time
Page up key Moves the page up
Page down key Moves the page down
Tab key Just like the right arrow key, it moves one cell at the time
Data types
Data entered into the data sheet (worksheet) are categorised into the following:
Values or constant: Generally raw numbers
Labels: Basically text, they are descriptive pieces of information such as date, year,
event, names (product, people, institution, team, country) or anything that can
identify or be used statistically to organize data on the worksheet.
Formula: In Excel, a mathematical operation begins with an equal symbol (=). It
alerts Excel that calculations is to be performed
Column headers
Active cell
Column
worksheet
Row headers
Cell
Row
5. 5 | P a g e
Customise your workbook/worksheet
Renaming Worksheets
The worksheet is labelled with a default name as sheet followed by a number 1. You can
replace the default worksheet names with descriptive names to help you easily locate data in
a workbook.
To rename a worksheet:
Double-click the tab of the worksheet that you want to rename.
Or, right-click the sheet tab, and then click Rename on the shortcut menu.
The worksheet name is selected on the tab.
Type a new name, and then press the Enter key. The sheet tab size adjusts to fit the
name.
Double click sheet tab
Right click on sheet tab
To insert a worksheet:
Click the tab of the worksheet to the left of which you want to insert a new
worksheet.
Click the New sheet button located on the right side of the last visible tab. This
inserts a new worksheet to the right of the active sheet.
Sheet 1 is ready for editing.
Sheet tab is highlighted for renaming
Right click the sheet1 tab,
Click on rename
Type the name you want to use
6. 6 | P a g e
The Formula bar displays the contents of the active cell, it can be used to enter or edit cell
contents. The Formula bar contains three buttons. The Insert Function button is always
available, but the other two buttons are only active when you are entering or editing data in
a cell. Clicking the Cancel button cancels the changes you make in the cell, which is the same
as pressing theEsc key. ClickingtheEnter button completesthechangesyoumakein thecell,
whichis thesame as pressing theEnter key.ClickingtheInsertFunctionbuttonopensadialog
box that helps you construct formulas.
To enter data from the formula bar,
Click on a cell and then click in the formula bar
Type the data
You will see the data in both the formula bar and the active cell
Resize a Cell
When data entered into a cell gets into the adjoining cell, there is the need to expand the cell
to accommodate the word, placing the mouse in between the affected cell will turn the mouse
pointer into a double headed arrow, one arrow head pointing to the right and the other
pointing to the left as shown in the diagram below.
New sheet button
Worksheet
Insert Function Button
Cancel
Button
Enter
Button
Move mouse pointer to the gap between column B and C,
Double clicking will automatically expand to
accommodate the word “Assessment”
Click hold and drag to the right will also expand to
accommodate the word “Assessment”
7. 7 | P a g e
Labels Values
Formula
showing on
worksheet
Formula showing
in formula bar
Click the enter icon
to accept the data
Place mouse button on
the bottom right hand
corner to engage the
fill formula handle. Let
it turn into a plus
You may double click
to fill the formula
down or click hold and
drag down
Mouse pointer turns into plus when
moved to the bottom right hand corner
right hand corner
Formula bar displaying
content of active cell and
active buttons
8. 8 | P a g e
Conclusion
Data entered on the spreadsheet are grouped under three categories
The excel application is called a workbook
The workbook contains worksheet
The arrow directional keys are used to navigate within the worksheet
The Tab key, enter key and the mouse are also used to navigate within the worksheet
Each worksheet can be given a unique name to identify the data on it
Clicking the enter icon accepts the data, the cell becomes the active cell