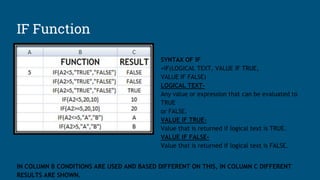
The document provides an introduction to Microsoft Excel, detailing its functionalities such as creating spreadsheets, using formulas like SUMIF and IF, and applying conditional formatting. It explains key Excel concepts including workbooks, worksheets, and cell structures, alongside useful shortcuts for efficient navigation and data management. Additionally, the document covers lookup functions like VLOOKUP and HLOOKUP, explaining their syntax and usage.


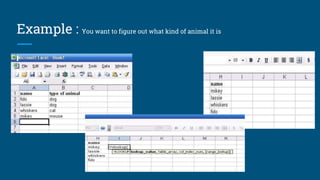
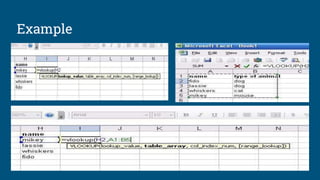
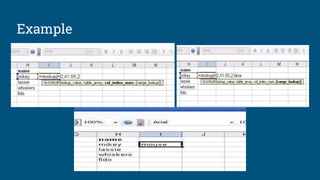
![Syntax of VLOOKUP
•VLOOKUP(which_value_to_search, in_which_range_to_search, column_num, [is_it_a_range_lookup])
•The function have 4 parameters
•which_value_to_search: This is the value you want to search in another table, it could be a value or a cell reference
•in_which_range_to_search : This is the range of that table in which you want the value to be searched
•column_num : This is the column number which contains the value you want to be returned if the required value found
•[is_it_a_range_lookup]: This is the final & optional parameter, which indicates that if it is true (range of values) else if false VLOOKUP will look
for (exact value)](https://image.slidesharecdn.com/msexcel-160503010841/85/Ms-excel-11-320.jpg)
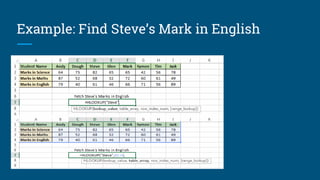
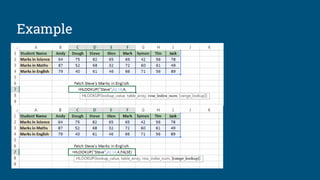
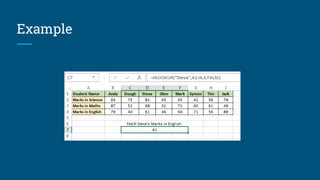
![HLOOKUP
This function retrieves data from the table horizontally
Syntax
HLOOKUP(lookup_value, table_array, row_index_num, [range_lookup])](https://image.slidesharecdn.com/msexcel-160503010841/85/Ms-excel-15-320.jpg)