This document provides an overview of simulation modeling. It defines a system as any set of interrelated components acting together to achieve a common objective. A model represents the structure of a real system through simplification, abstraction, and assumptions. Simulation is the process of running a computer model of a real system to study or experiment with it. There are different types of simulations depending on whether changes are continuous or discrete over time and whether aspects are deterministic or stochastic. Monte Carlo simulation uses random sampling to approximate expectations while discrete event simulation models systems as sequences of discrete events over time. Examples provided include using Monte Carlo to estimate pi and modeling a single machine system in discrete event simulation software.
The presentation is about basic statistical techniques and how statistics can be used effectively in the quality control and process control. It also presents statistical package Minitab version 16 and some of its applications in the field of statistical process control.
this ppt is helpful for BBA/B.tech//MBA/M.tech students.
the ppt is on simulation topic...its covers -
Meaning
Advantages & Disadvantages
Uses
Process
Monte Carlo SImulation
Advantages & Disadvantages
Its example
Histograms are frequency charts. In Lean Six Sigma, they show the distribution of values produced by a process. In other words, a histogram is a visual display of how much variation exists in a process.
https://goleansixsigma.com/histogram/
A Pareto Chart is a quality chart of discrete data that helps identify the most significant types of defect occurrences.
https://goleansixsigma.com/pareto-chart/
Control Charts are time charts designed to display signals or warnings of special cause variation.
https://goleansixsigma.com/control-chart/
Mangt tool with statistical process control ch 18 asif jamalAsif Jamal
It is basic way to understand Total Quality Management
Tools & Procedures of CI
Varies from simple suggestion system based on brain storming to structured programs utilizing statistical process control tools (SPC Tools)
Deming wheel (PDCA) cycle
Zero defect concept
Bench Marking
Six sigma
Kaizen
this is book which prescribed for mechanical engineering students its one of there paper in engineering subjects dat to for final years. it is easy to understand nd best for scoring
Unit I (8 Hrs)
Introduction to Linear Programming – Various definitions, Statements of basic
theorems and properties, Advantages Limitations and Application areas of Linear
Programming, Linear Programming -Graphical method, - graphical solution
methods of Linear Programming problems, The Simplex Method: -the Simplex
Algorithm, Phase II in simplex method, Primal and Dual Simplex Method, Big-M
Method
Unit II (8 Hrs)
Transportation Model and its variants: Definition of the Transportation Model
-Nontraditional Transportation Models-the Transportation Algorithm-the Assignment
Model– The Transshipment Model
Unit III (8 Hrs)
Network Models: Basic differences between CPM and PERT, Arrow Networks,
Time estimates, earliest completion time, Latest allowable occurrences time,
Forward Press Computation, Backward Press Computation, Representation in
tabular form, Critical Path, Probability of meeting the scheduled date of completion,
Various floats for activities, Critical Path updating projects, Operation time cost trade
off Curve project,
Selection of schedule based on :- Cost analysis, Crashing the network
Sequential model & related problems, processing n jobs through – 1 machine & 2
machines
Unit IV (8 Hrs)
Network Models: Scope of Network Applications – Network definitions, Goal
Programming Algorithms, Minimum Spanning Tree Algorithm, Shortest Route
Problem, Maximal flow model, Minimum cost capacitated flow problem
Unit V (8 Hrs)
Decision Analysis: Decision - Making under certainty - Decision - Making under
Risk, Decision
under uncertainty.
Unit VI (8 Hrs)
Simulation Modeling: Monte Carlo Simulation, Generation of Random Numbers,
Method for
Gathering Statistical observations
FellowBuddy.com is an innovative platform that brings students together to share notes, exam papers, study guides, project reports and presentation for upcoming exams.
We connect Students who have an understanding of course material with Students who need help.
Benefits:-
# Students can catch up on notes they missed because of an absence.
# Underachievers can find peer developed notes that break down lecture and study material in a way that they can understand
# Students can earn better grades, save time and study effectively
Our Vision & Mission – Simplifying Students Life
Our Belief – “The great breakthrough in your life comes when you realize it, that you can learn anything you need to learn; to accomplish any goal that you have set for yourself. This means there are no limits on what you can be, have or do.”
Like Us - https://www.facebook.com/FellowBuddycom
introduction to modeling, Types of Models, Classification of mathematical mod...Waqas Afzal
Types of Systems
Ways to study system
Model
Types of Models
Why Mathematical Model
Classification of mathematical models
Black box, white box, Gray box
Lumped systems
Dynamic Systems
Simulation
Modeling and simulation is the use of models as a basis for simulations to develop data utilized for managerial or technical decision making. In the computer application of modeling and simulation a computer is used to build a mathematical model which contains key parameters of the physical model.
Simulation may be defined as a technique that imitates the
operation of a real-world system as it evolves over time. This is normally
done by developing a simulation model.
A simulation model take the form of a set of assumptions about
the operation of the system, expressed as mathematical or logical
relations between the objects of interest in the system.
Read| The latest issue of The Challenger is here! We are thrilled to announce that our school paper has qualified for the NATIONAL SCHOOLS PRESS CONFERENCE (NSPC) 2024. Thank you for your unwavering support and trust. Dive into the stories that made us stand out!
How to Split Bills in the Odoo 17 POS ModuleCeline George
Bills have a main role in point of sale procedure. It will help to track sales, handling payments and giving receipts to customers. Bill splitting also has an important role in POS. For example, If some friends come together for dinner and if they want to divide the bill then it is possible by POS bill splitting. This slide will show how to split bills in odoo 17 POS.
The French Revolution, which began in 1789, was a period of radical social and political upheaval in France. It marked the decline of absolute monarchies, the rise of secular and democratic republics, and the eventual rise of Napoleon Bonaparte. This revolutionary period is crucial in understanding the transition from feudalism to modernity in Europe.
For more information, visit-www.vavaclasses.com
Instructions for Submissions thorugh G- Classroom.pptxJheel Barad
This presentation provides a briefing on how to upload submissions and documents in Google Classroom. It was prepared as part of an orientation for new Sainik School in-service teacher trainees. As a training officer, my goal is to ensure that you are comfortable and proficient with this essential tool for managing assignments and fostering student engagement.
Palestine last event orientationfvgnh .pptxRaedMohamed3
An EFL lesson about the current events in Palestine. It is intended to be for intermediate students who wish to increase their listening skills through a short lesson in power point.
Ethnobotany and Ethnopharmacology:
Ethnobotany in herbal drug evaluation,
Impact of Ethnobotany in traditional medicine,
New development in herbals,
Bio-prospecting tools for drug discovery,
Role of Ethnopharmacology in drug evaluation,
Reverse Pharmacology.
How to Make a Field invisible in Odoo 17Celine George
It is possible to hide or invisible some fields in odoo. Commonly using “invisible” attribute in the field definition to invisible the fields. This slide will show how to make a field invisible in odoo 17.
The Art Pastor's Guide to Sabbath | Steve ThomasonSteve Thomason
What is the purpose of the Sabbath Law in the Torah. It is interesting to compare how the context of the law shifts from Exodus to Deuteronomy. Who gets to rest, and why?
Digital Tools and AI for Teaching Learning and Research
Into to simulation
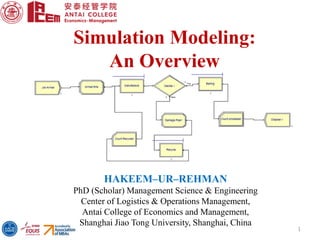
1. HAKEEM–UR–REHMAN
PhD (Scholar) Management Science & Engineering
Center of Logistics & Operations Management,
Antai College of Economics and Management,
Shanghai Jiao Tong University, Shanghai, China
1
Simulation Modeling:
An Overview
2. Outlines
2
What is a System?
Components of a System
Types of Systems
Model of a system
Simulation & Simulation model types
Monte Carlo Simulation: Example
Discrete Event Simulation: Example
3. What is a System?
3
A system is any set of interrelated components acting together to
achieve a common objective.
INPUT OUTPUTSYSTEM
Manufacturing
Healthcare
Banking
4. Components of a System
4
Entity: “Flow units transformed by the system over time”
Attribute: “A property of an entity”
Activity: “Time period of specified Length”
o Example: Banking System
o Customers might be one of the entities
o The balance in their checking accounts might be an attribute
o Making deposits might be an activity
Sate of a System: “Collation of variables necessary to describe the
system at any time relative to the objectives of the study”
o Bank: # of busy tellers, # of customers waiting in the queue,
arrival time of the next customer”
5. Three Types of Systems
5
System
Quantum
System
Subatomic
World
Cosmological
Systems
Continuous
System
Electro-
mechanical
Systems
Socio-economic,
Ecological
Systems
Discrete–Event
System
Industrial Systems
(Factory, Office,
etc.)
Components of a system are
described using quantum
mechanics
physical dynamics are
described using differential
equations of effort,
such as force and voltage, and
flow, such as velocity and
current
event-driven system
an instance of
changes in state
variables
6. Model of a System
6
A model is a representation of the structure of a real life system.
REAL
SYSTEM
o Simplification
o Abstraction
o Assumptions
MODEL
System
7. What is a Simulation?
7
The process of running a computer model of a real system to study
or conduct experiments
For understanding the model or its behavior
To evaluate strategies for operation of the system
used to draw conclusions about the real system.
Simulation
vs.
Real World
8. Different Kinds of Simulation
8
Continuous Vs. Discrete Change
Can “state” change continuously,
or only at discrete points in time?
Deterministic Vs. Stochastic
Is everything for sure or is there
uncertainty?
Static Vs. Dynamic
Does time have a role in model?
Most operational models: Stochastic, Dynamic, Discrete-change
System Model
Deterministic Stochastic
Static Dynamic Static Dynamic
Continuous Discrete Continuous Discrete
Monte Carlo
Simulation
Continuous
Simulation
Continuous
Simulation
Discrete
Event
Simulation
Discrete
Event
Simulation
9. Monte Carlo Simulation
9
Monte Carlo methods (or Monte Carlo experiments) are a broad
class of computational algorithms that rely on repeated random
sampling to obtain numerical results.
“Monte Carlo is a method of approximating things using samples”
Monte Carlo: approximates expectations with a sample average
𝐴𝑝𝑝𝑟𝑜𝑥𝑖𝑚𝑎𝑡𝑒 𝐸 𝑓 𝑥 = 𝑓 𝑥 𝑃 𝑥 𝑑𝑥 ≈
1
𝑆 𝑠=1
𝑆
𝑓 𝑥 𝑠 𝑥 𝑠 ~𝑃 𝑥
ACCEPTANCE–REJECTION SAMPLING:
Sampling Underneath a 𝑃 𝑥 ∝ 𝑃(𝑥) curve is also
valid
o Draw underneath a simple curve 𝑘 𝑄(𝑥) ≥ 𝑃(𝑥)
• Draw 𝑥 ~𝑄(𝑥)
• Height 𝑢 ~𝑈𝑛𝑖𝑓𝑜𝑟𝑚[0, 𝑘 𝑄(𝑥)]
o Discard the point if above 𝑃 𝑥 ,
(i.e. if 𝑢 > 𝑃(𝑥))
10. Monte Carlo Simulation: Example
10
Using MC to Estimate 𝜋
𝐴𝑟𝑒𝑎 𝑜𝑓 𝐶𝑖𝑟𝑐𝑙𝑒 = 𝜋𝑟2
𝐴𝑟𝑒𝑎 𝑜𝑓 𝑆𝑞𝑢𝑎𝑟𝑒 = 4𝑟2
𝑥2
+ 𝑦2
= 𝑟2
𝑃𝑟𝑜𝑏𝑎𝑏𝑖𝑙𝑡𝑦 𝑝𝑜𝑖𝑛𝑡 𝑖𝑛𝑠𝑖𝑑𝑒 𝑡ℎ𝑒 𝑐𝑖𝑟𝑐𝑙𝑒 =
𝜋𝑟2
4𝑟2
𝝅 = 4 ∗ 𝑃𝑟𝑜𝑏𝑎𝑏𝑖𝑙𝑡𝑦 𝑝𝑜𝑖𝑛𝑡 𝑖𝑛𝑠𝑖𝑑𝑒 𝑡ℎ𝑒 𝑐𝑖𝑟𝑐𝑙𝑒
11. Discrete Event Simulation
11
A single Machine system
Simulation Model Trajectory
Also called System Simulation
“process of codifying the behavior of a complex system as an
ordered sequence of well-defined events”
12. Discrete Event Simulation…
12
Collecting Statistics from the Model Trajectory:
Queue Length 𝑞(𝑡) statistics during 𝑡 ∈ [𝑡0, 𝑡10]
Average waiting time
Average System time (Waiting time + Service time)
Resource utilization
13. Discrete Event Simulation…
13
Arena Simulation Software
https://www.arenasimulation.com/academic/students
A Single Machine System
Entity: Job arrives every 𝑡 𝑎 minutes (𝑡 𝑎~𝐸𝑥𝑝(5))
Active Resource: Machine
Passive Resource: Buffer (unlimited)
Activity: service time 𝑡 𝑠~𝑇𝑟𝑖𝑎𝑛𝑔𝑢𝑙𝑎𝑟(1,3,6))
Example