Download as PDF, PPTX

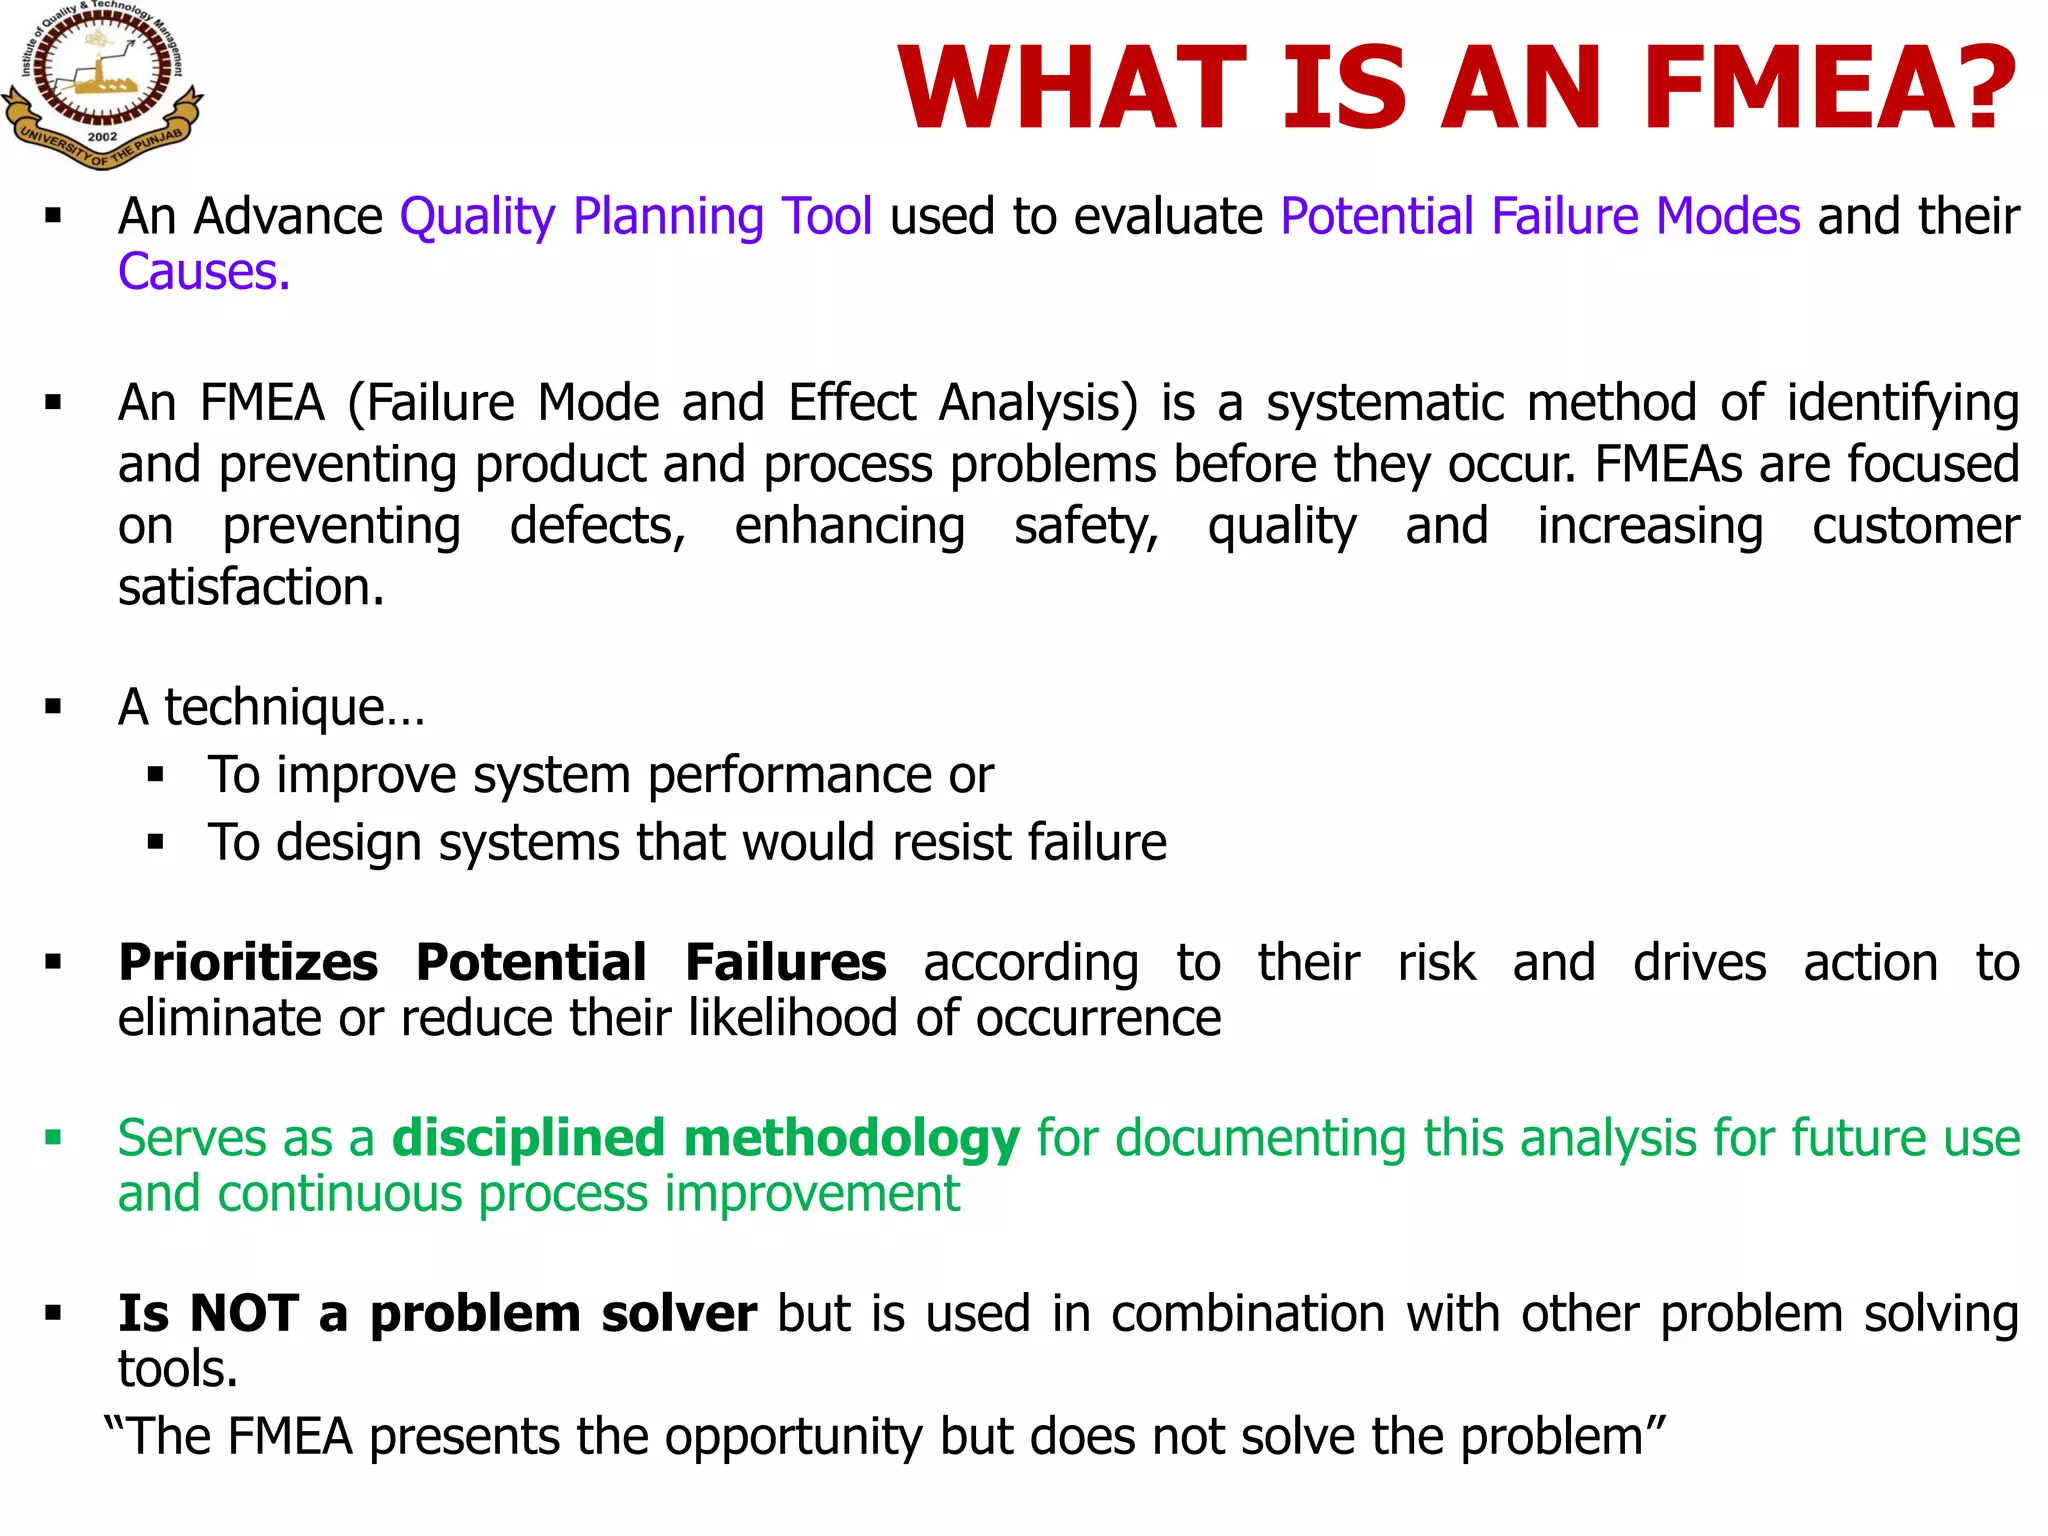
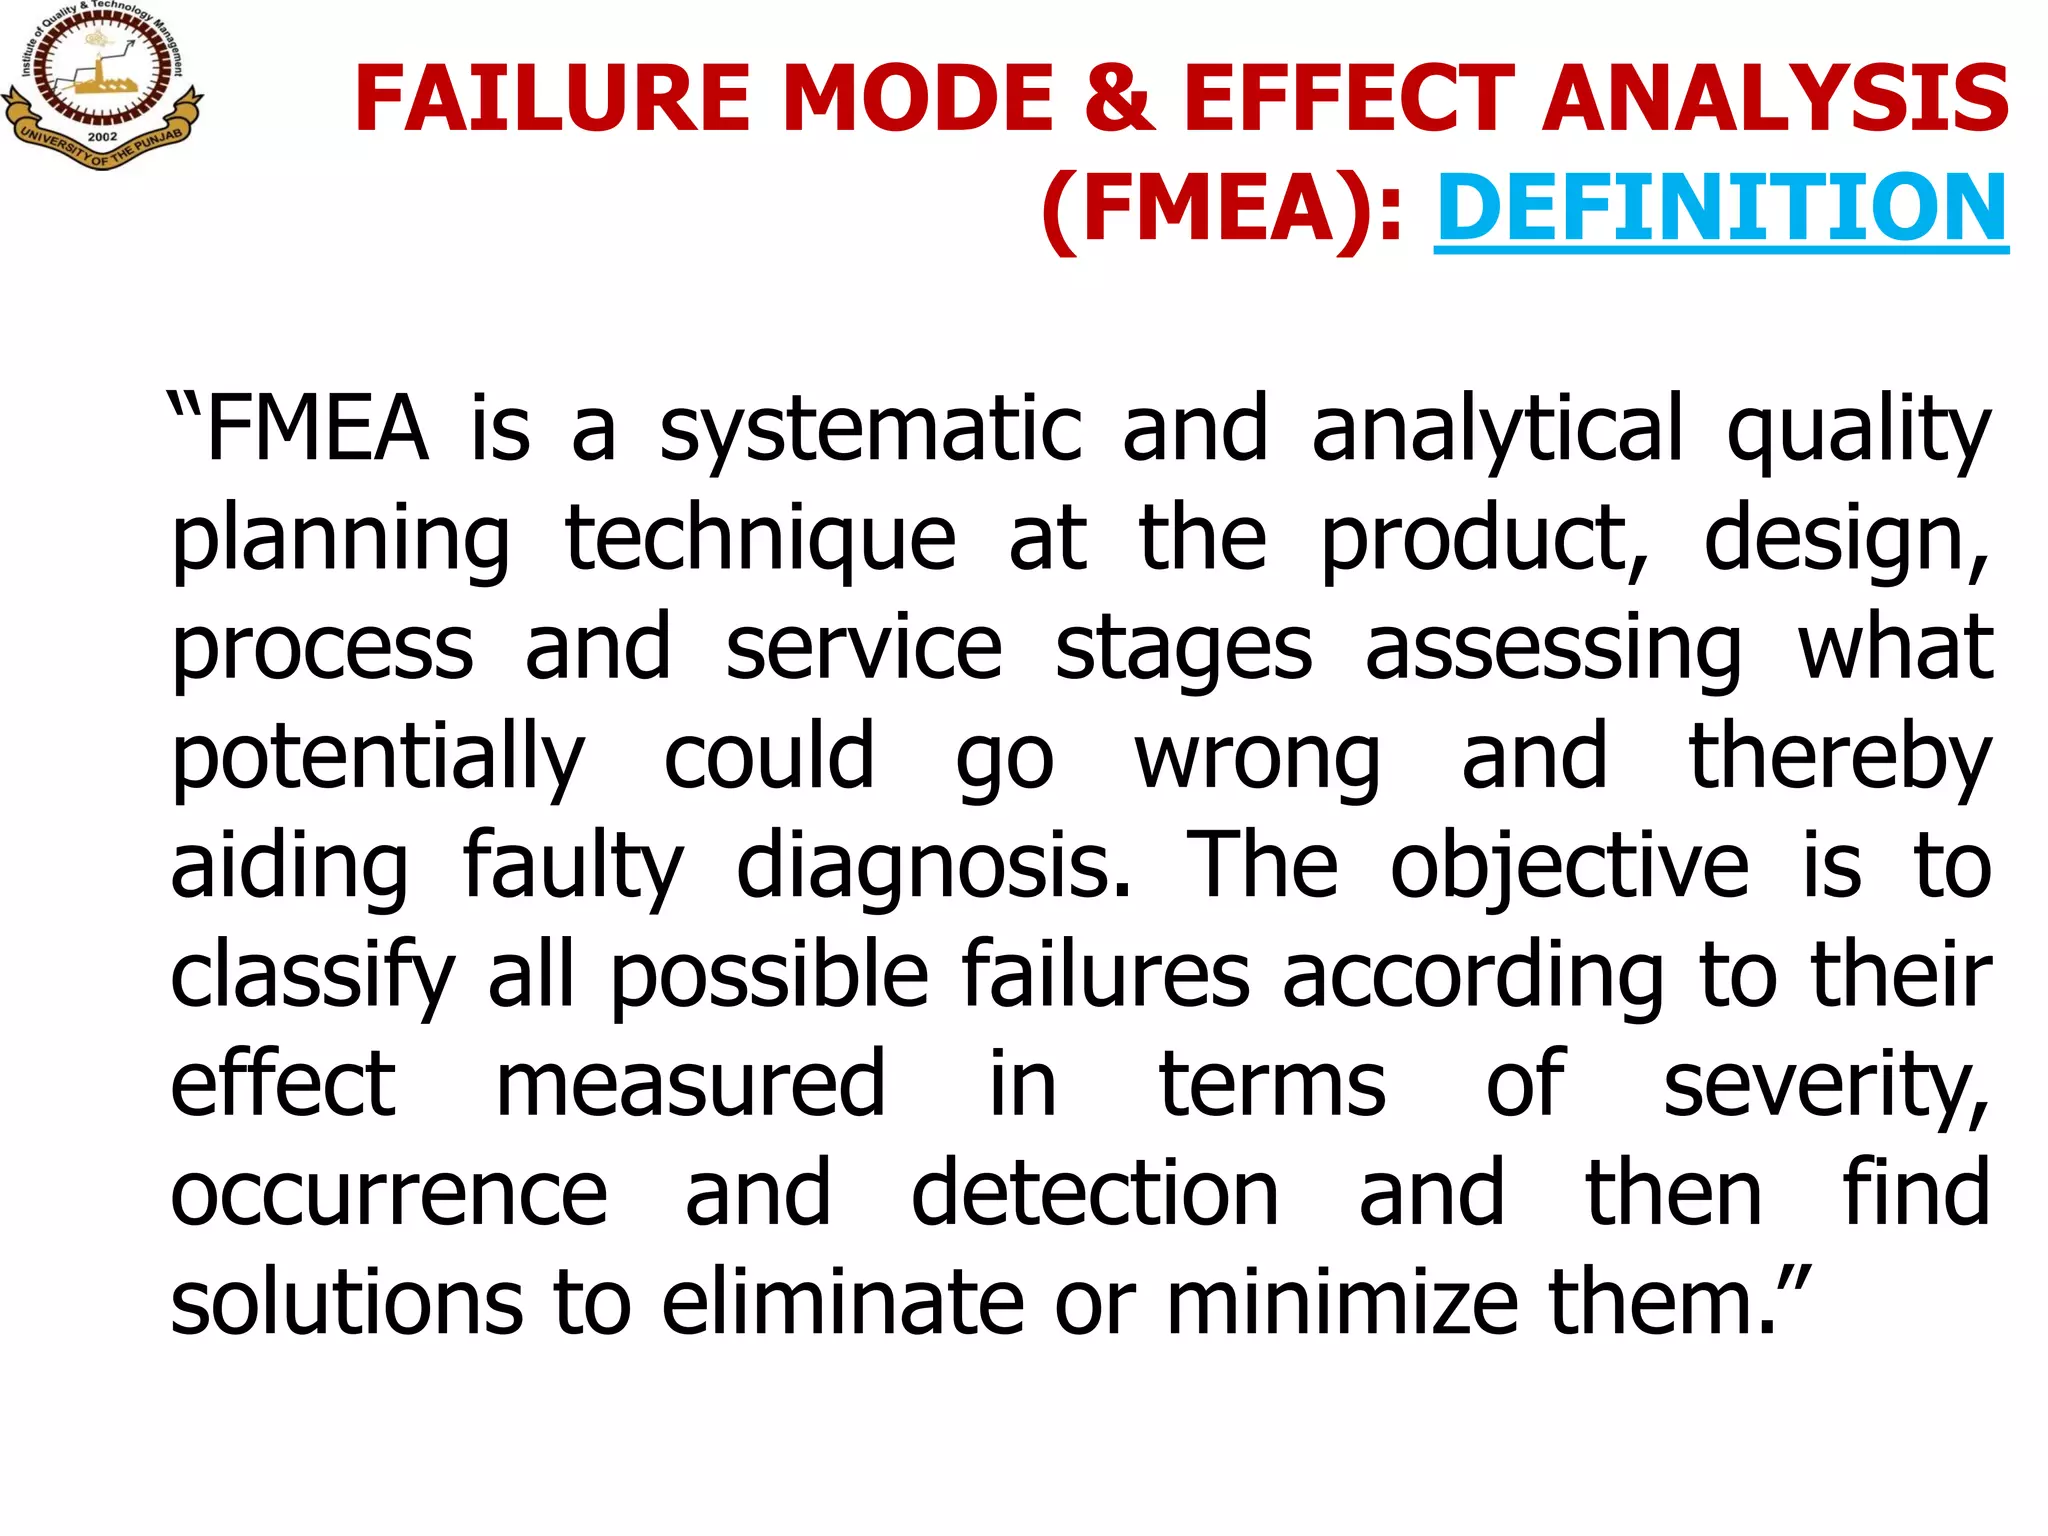
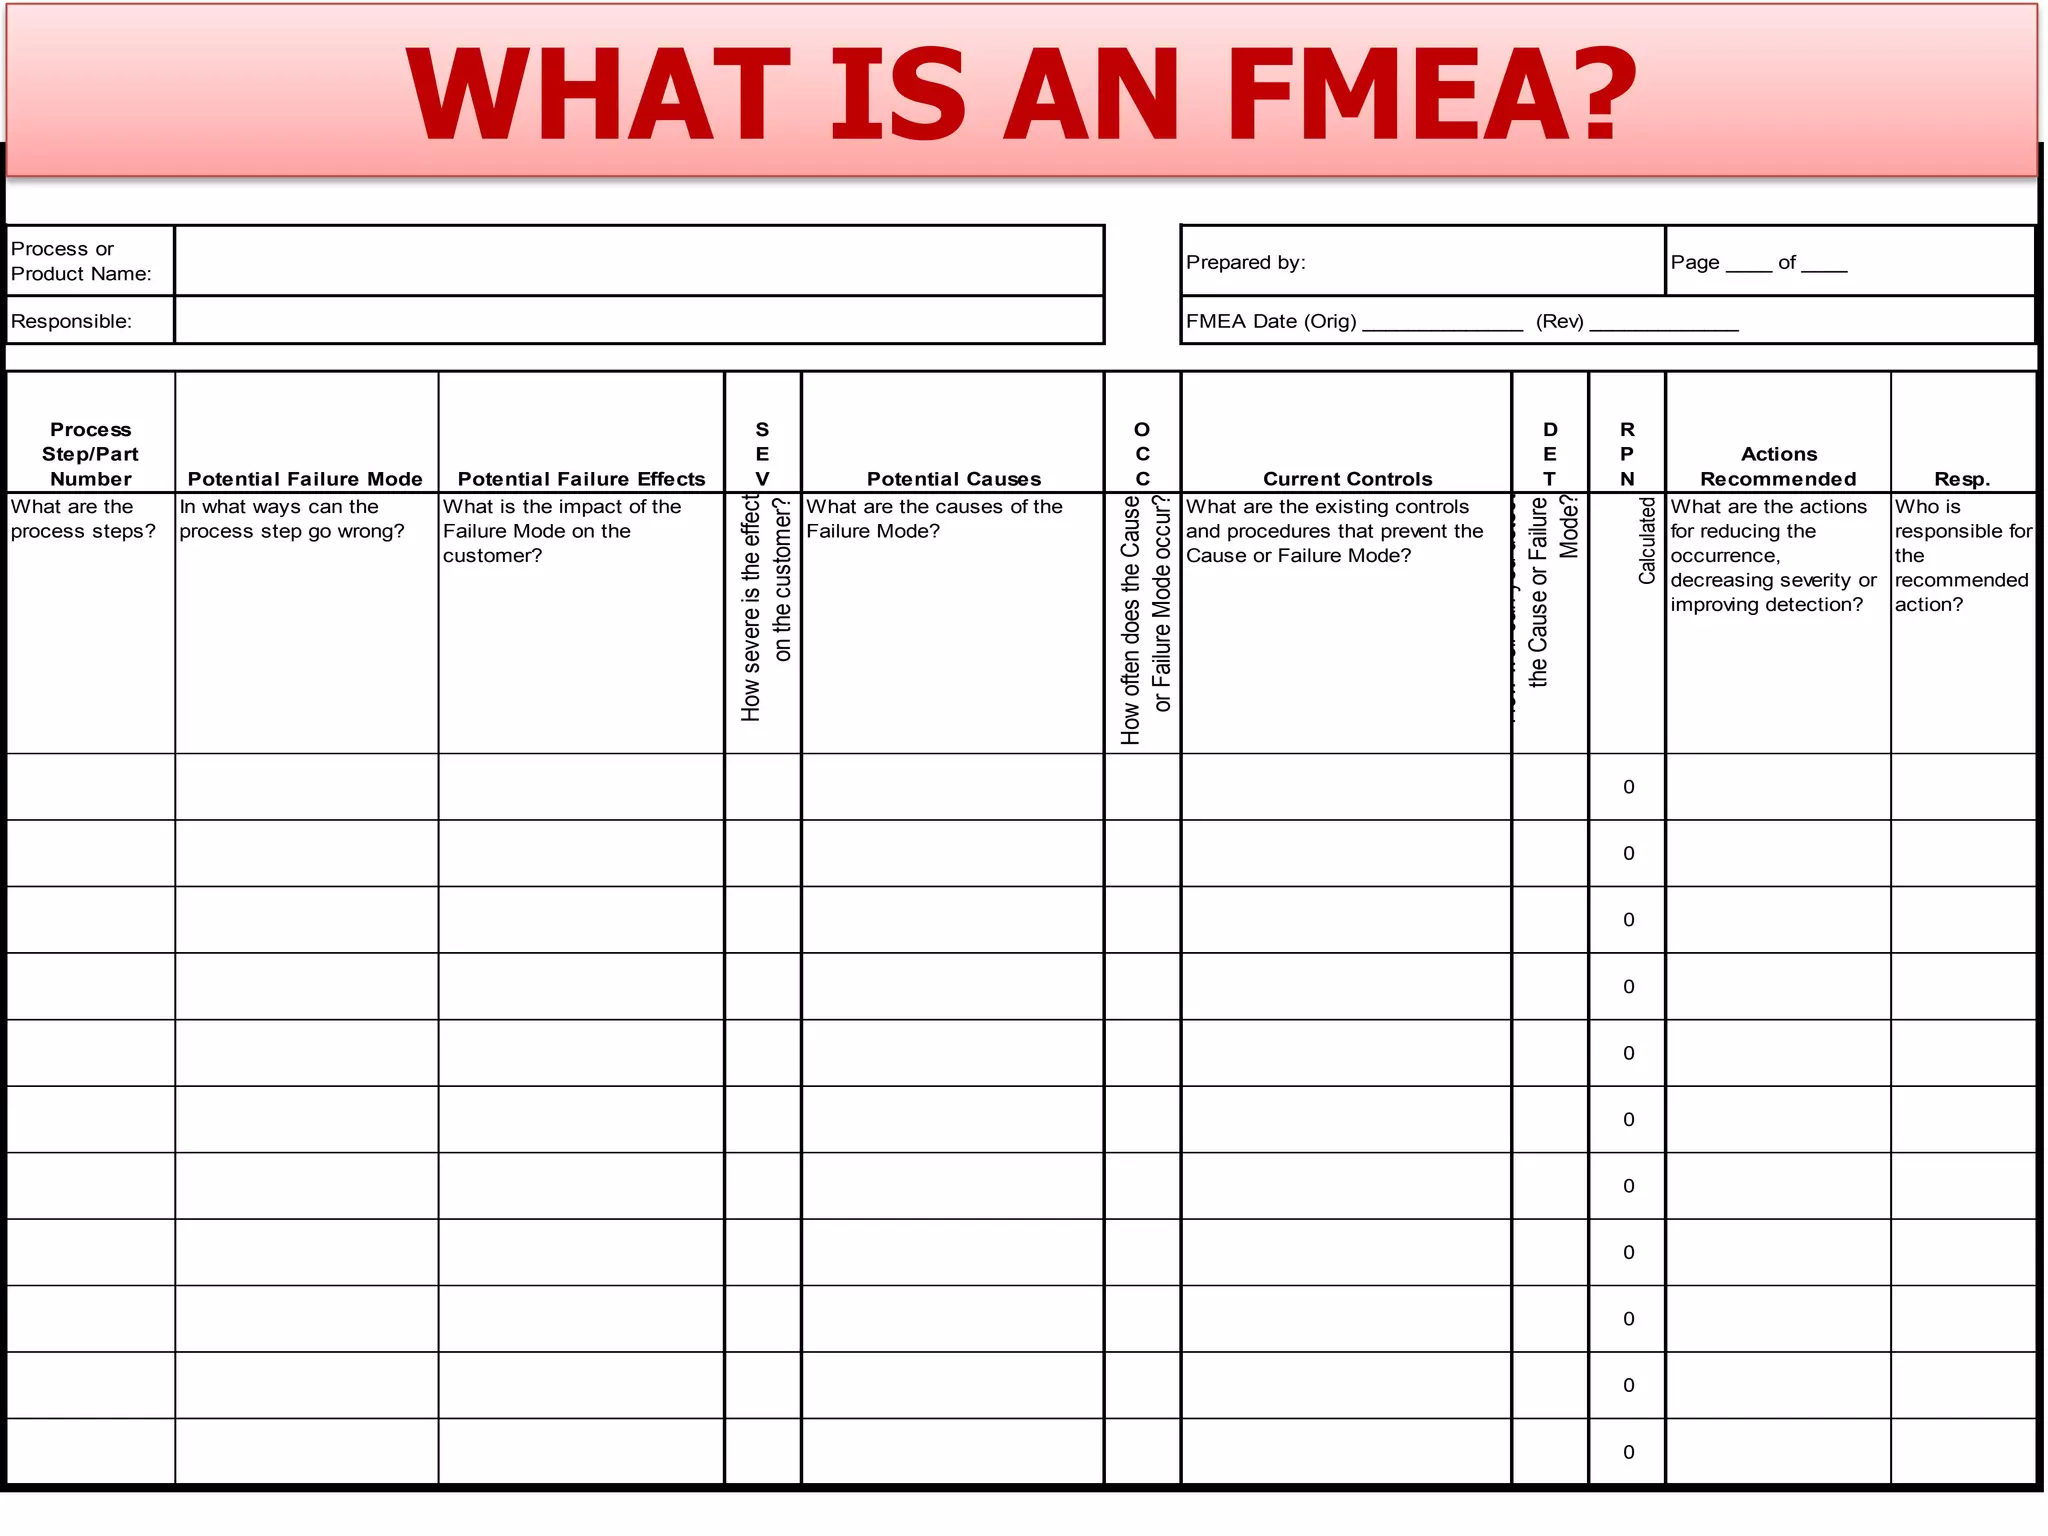
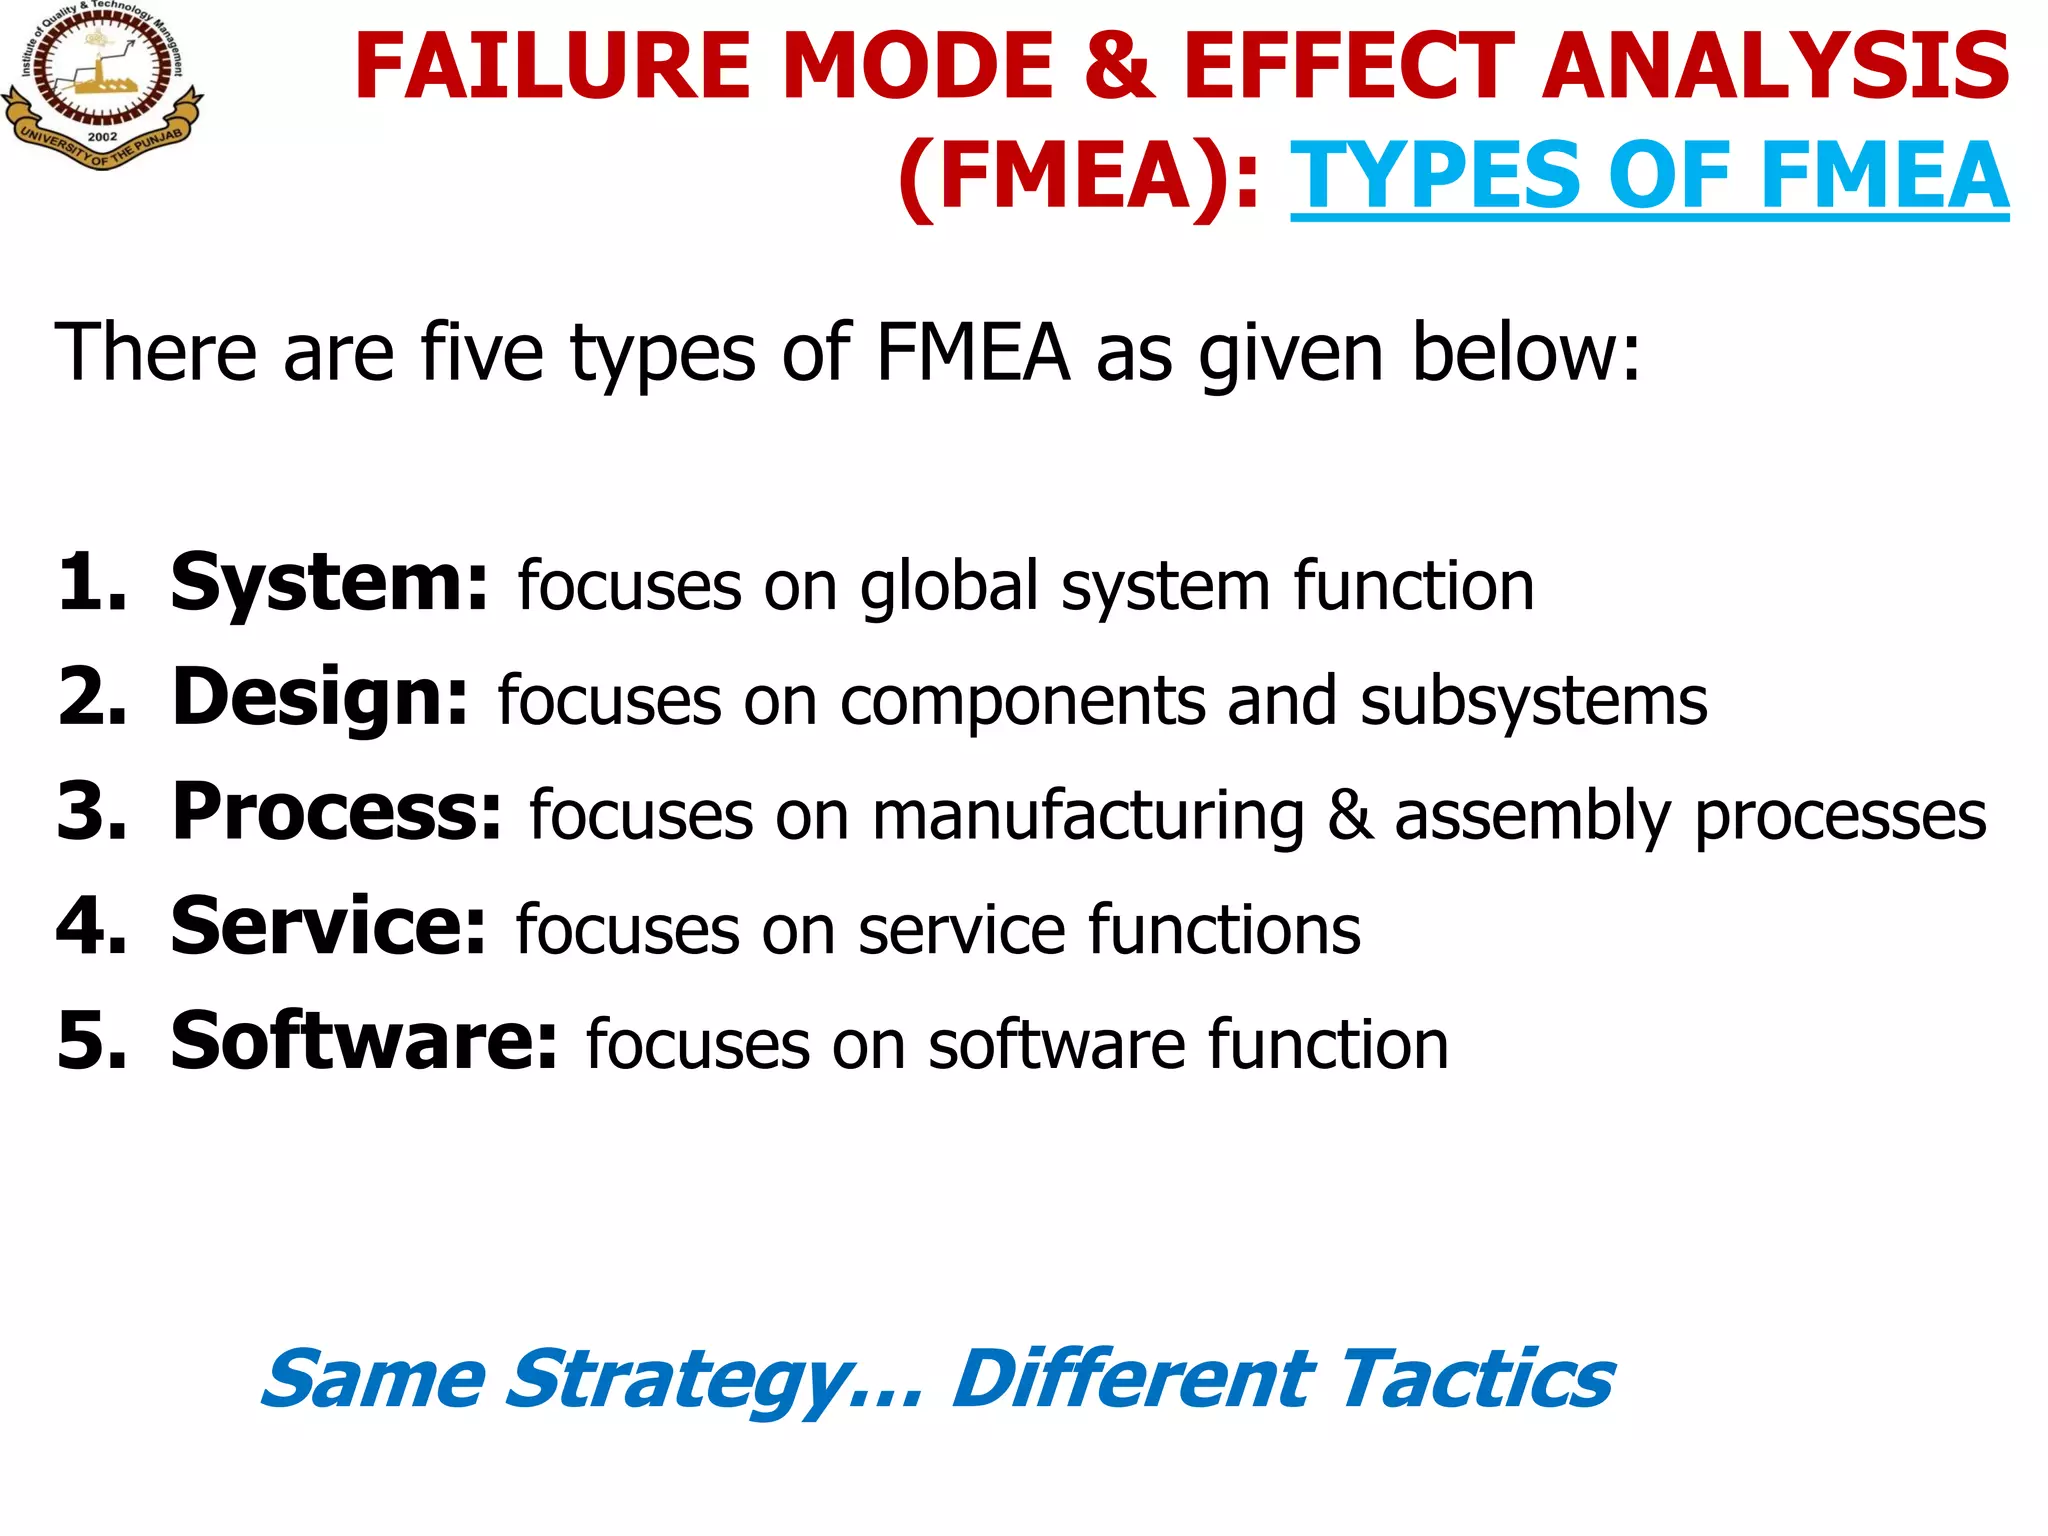
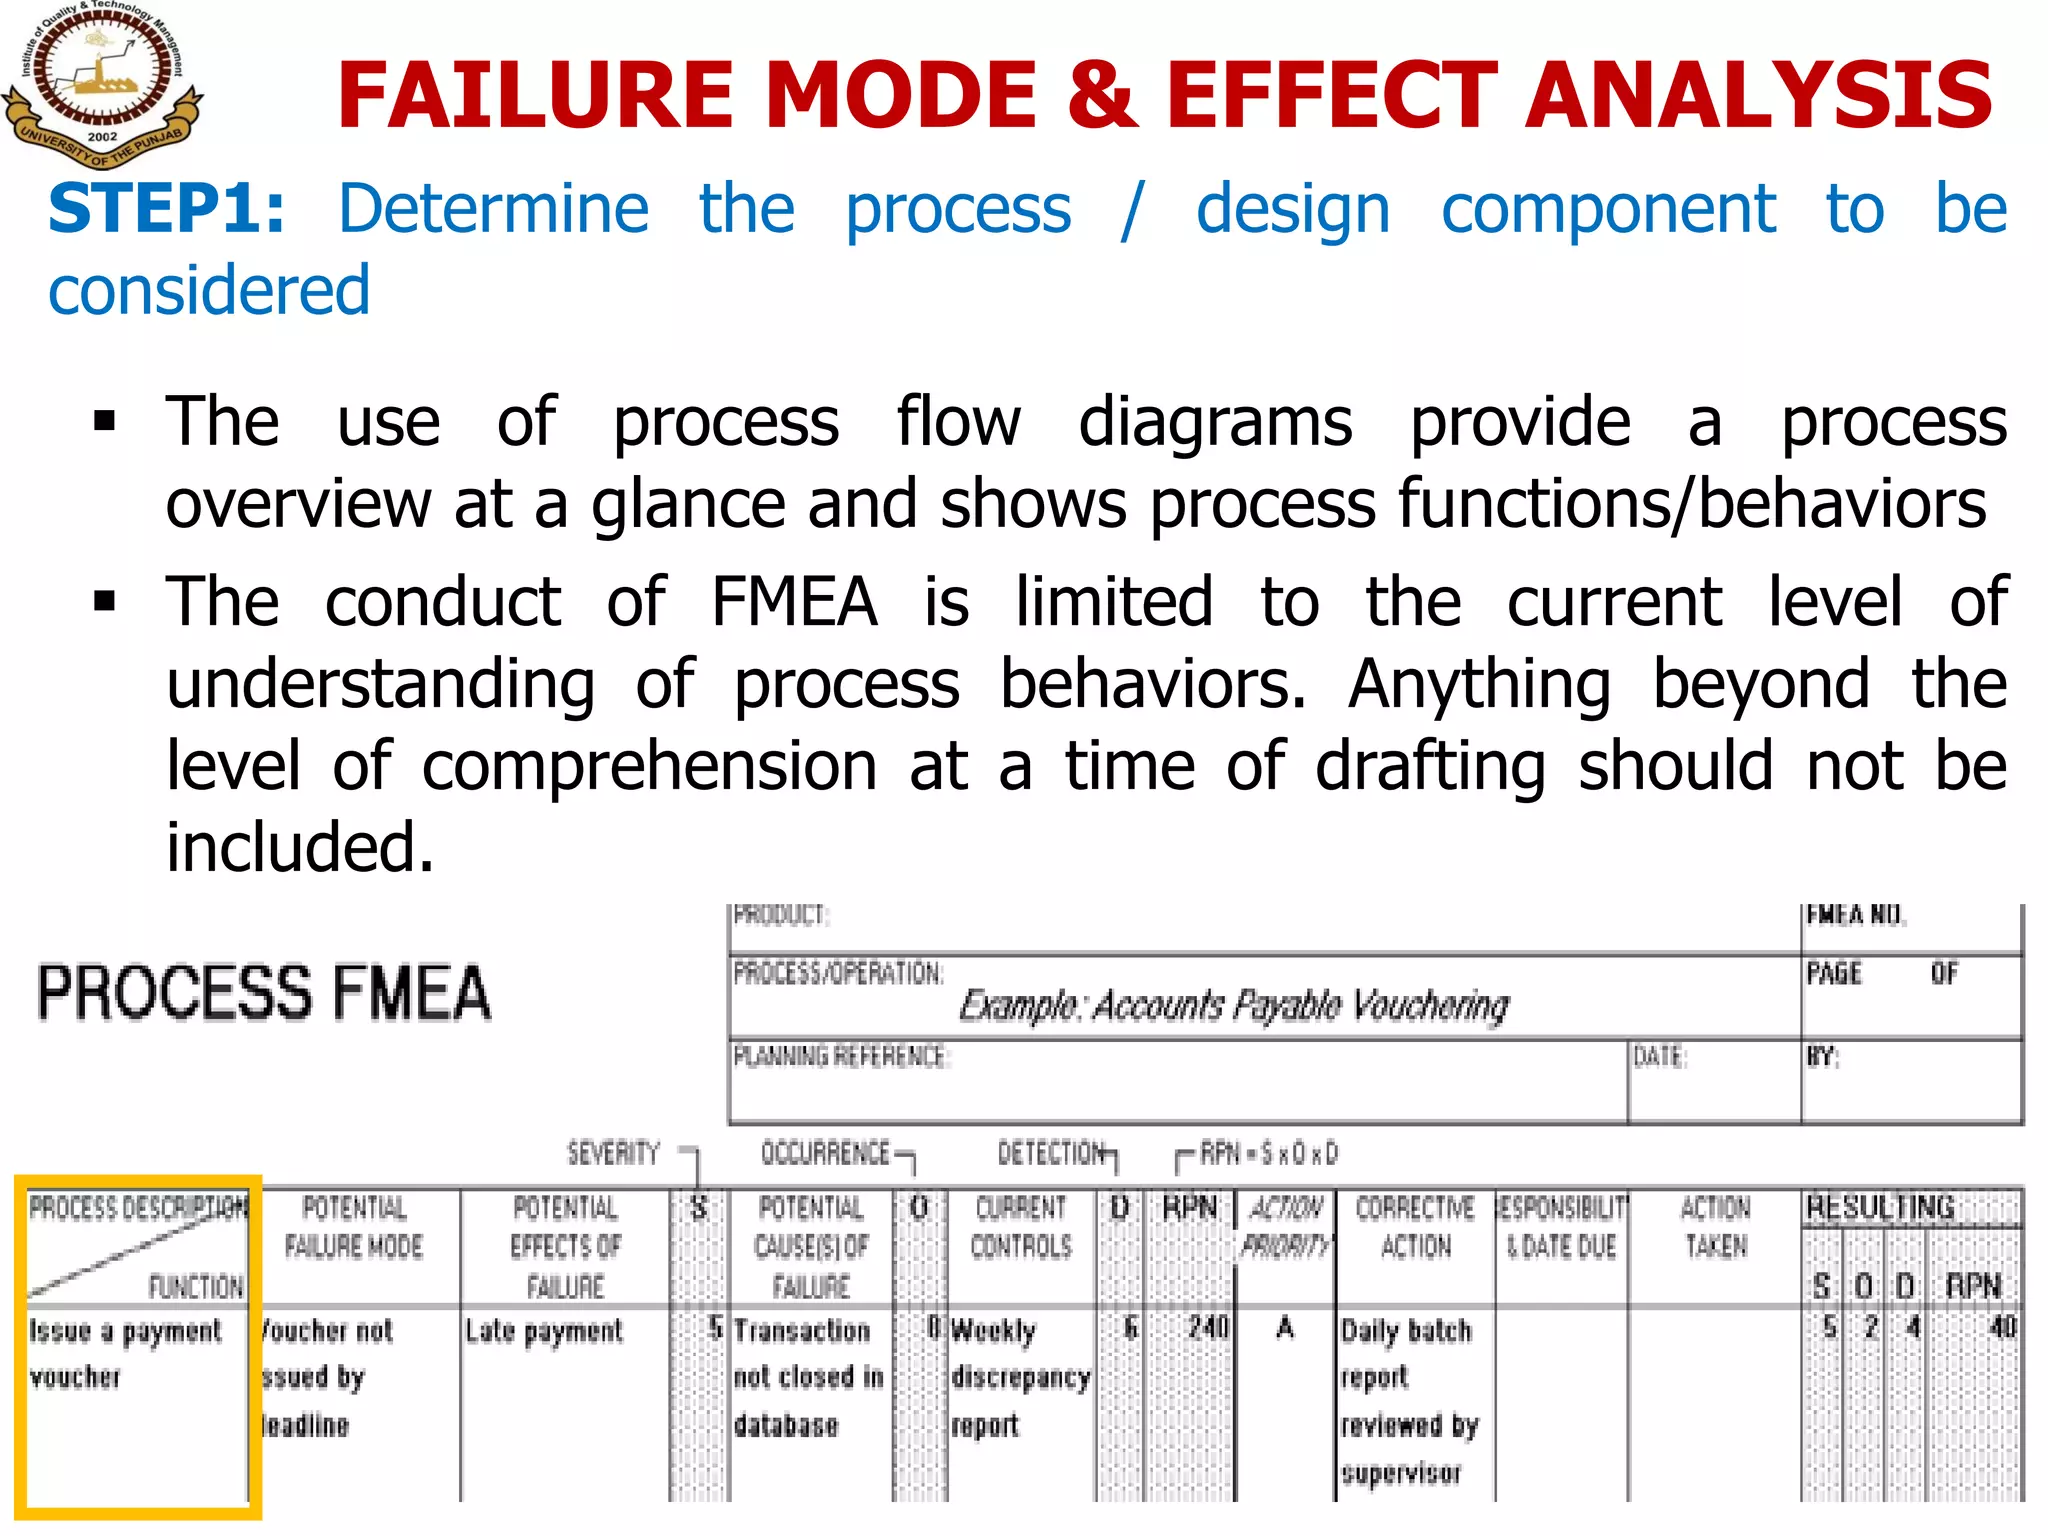
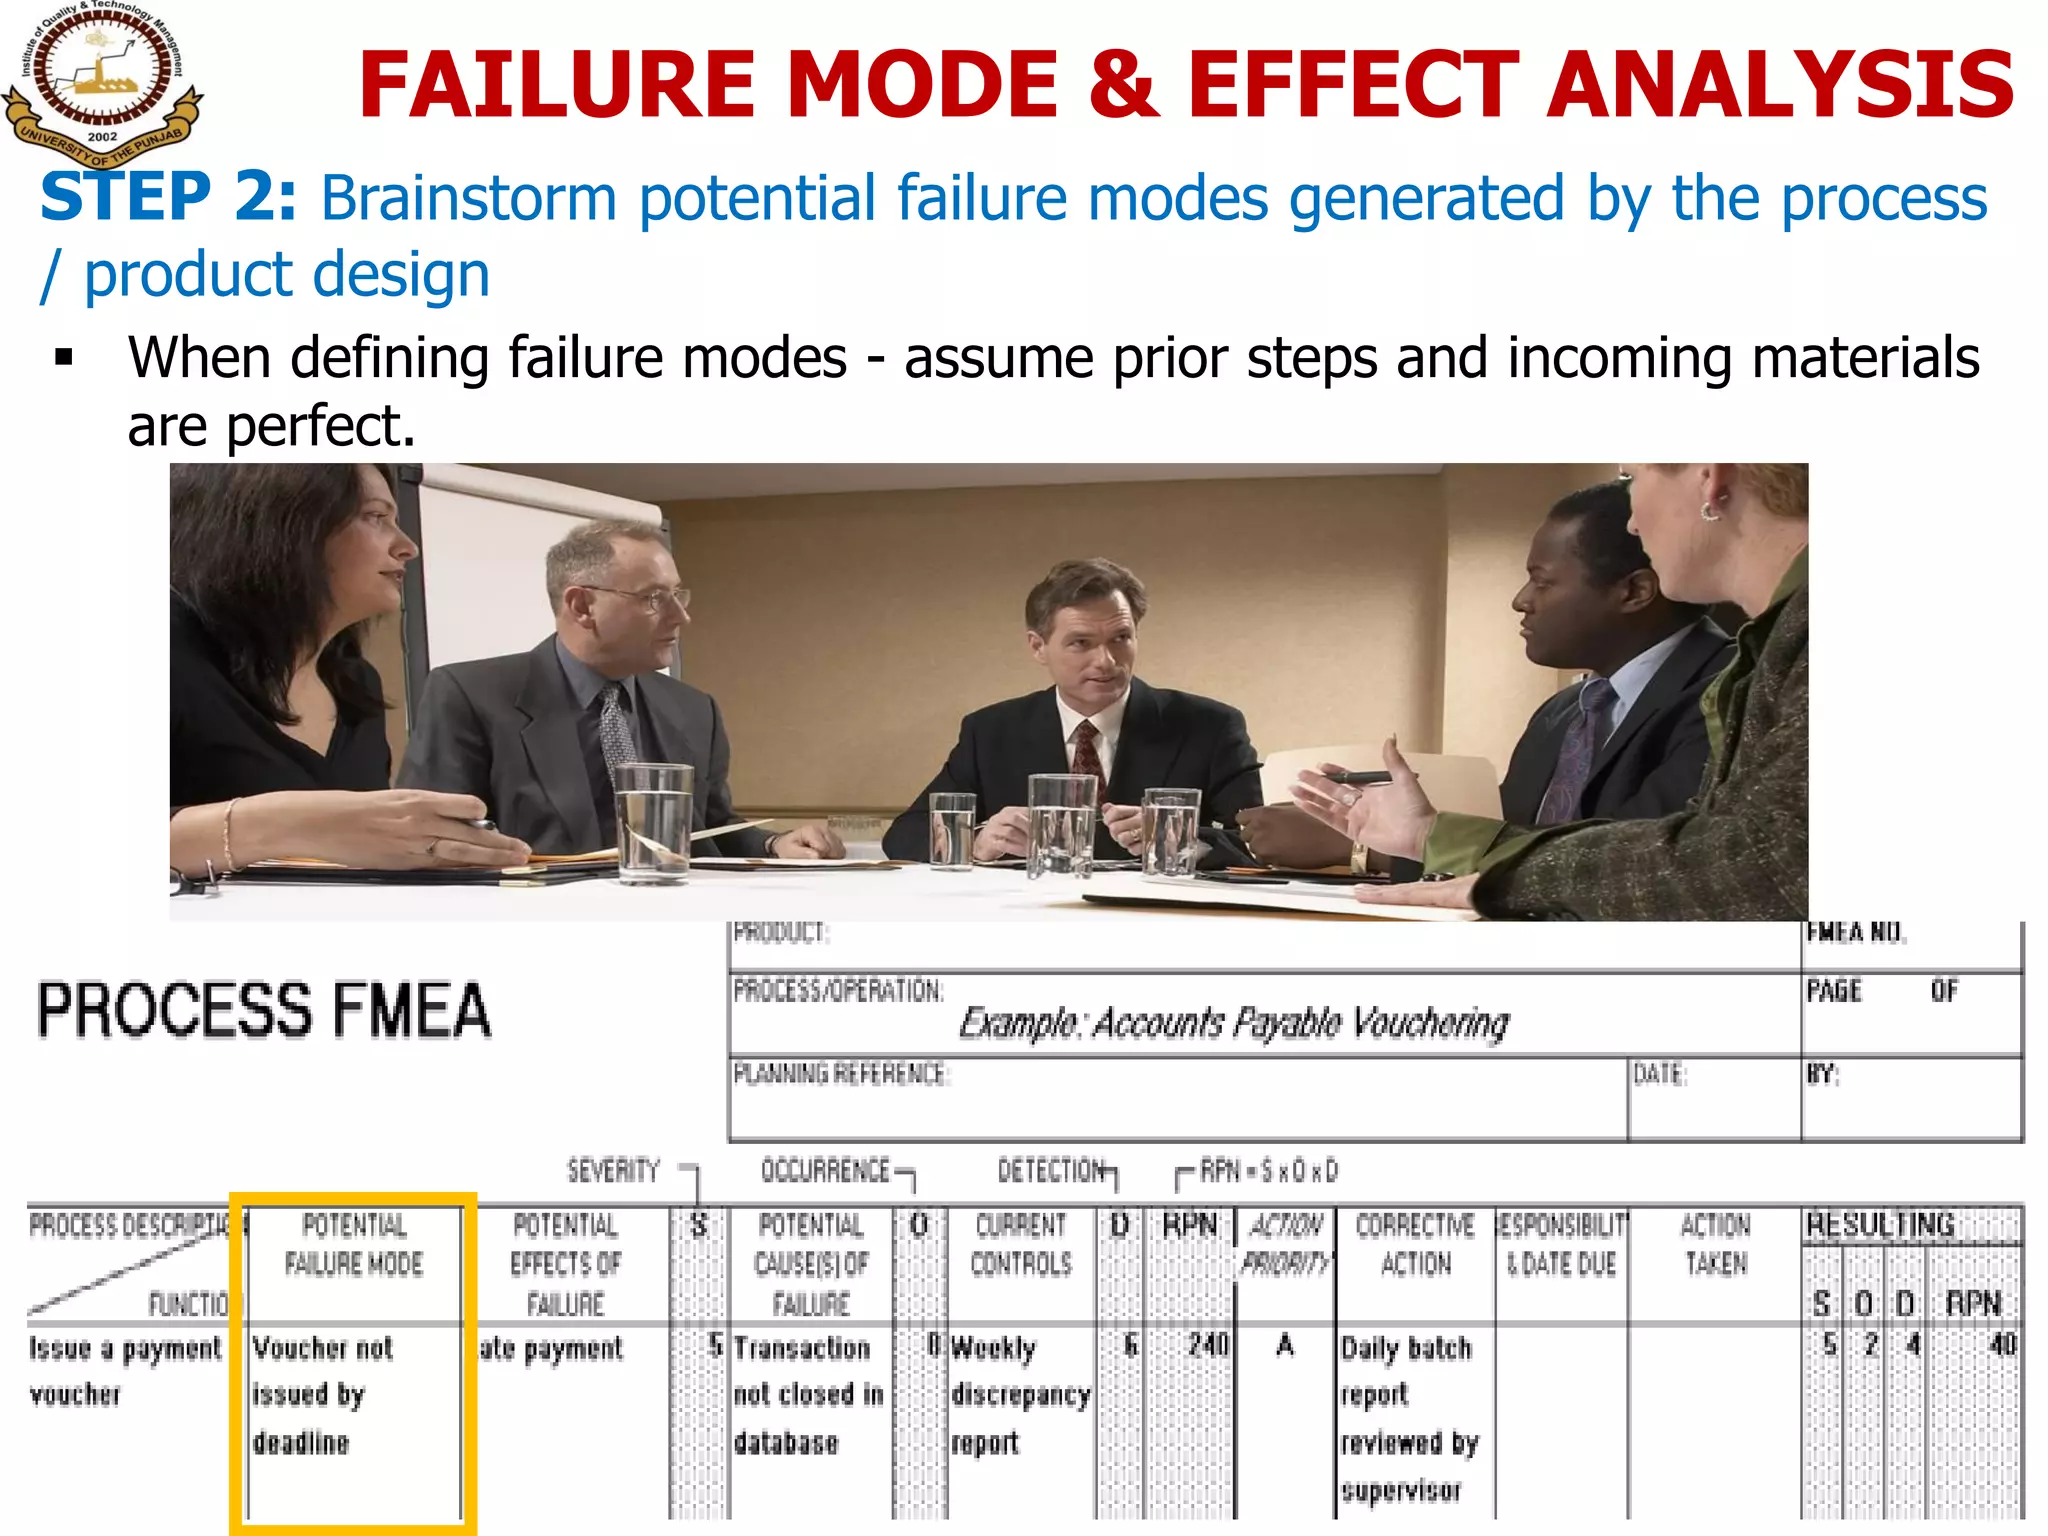
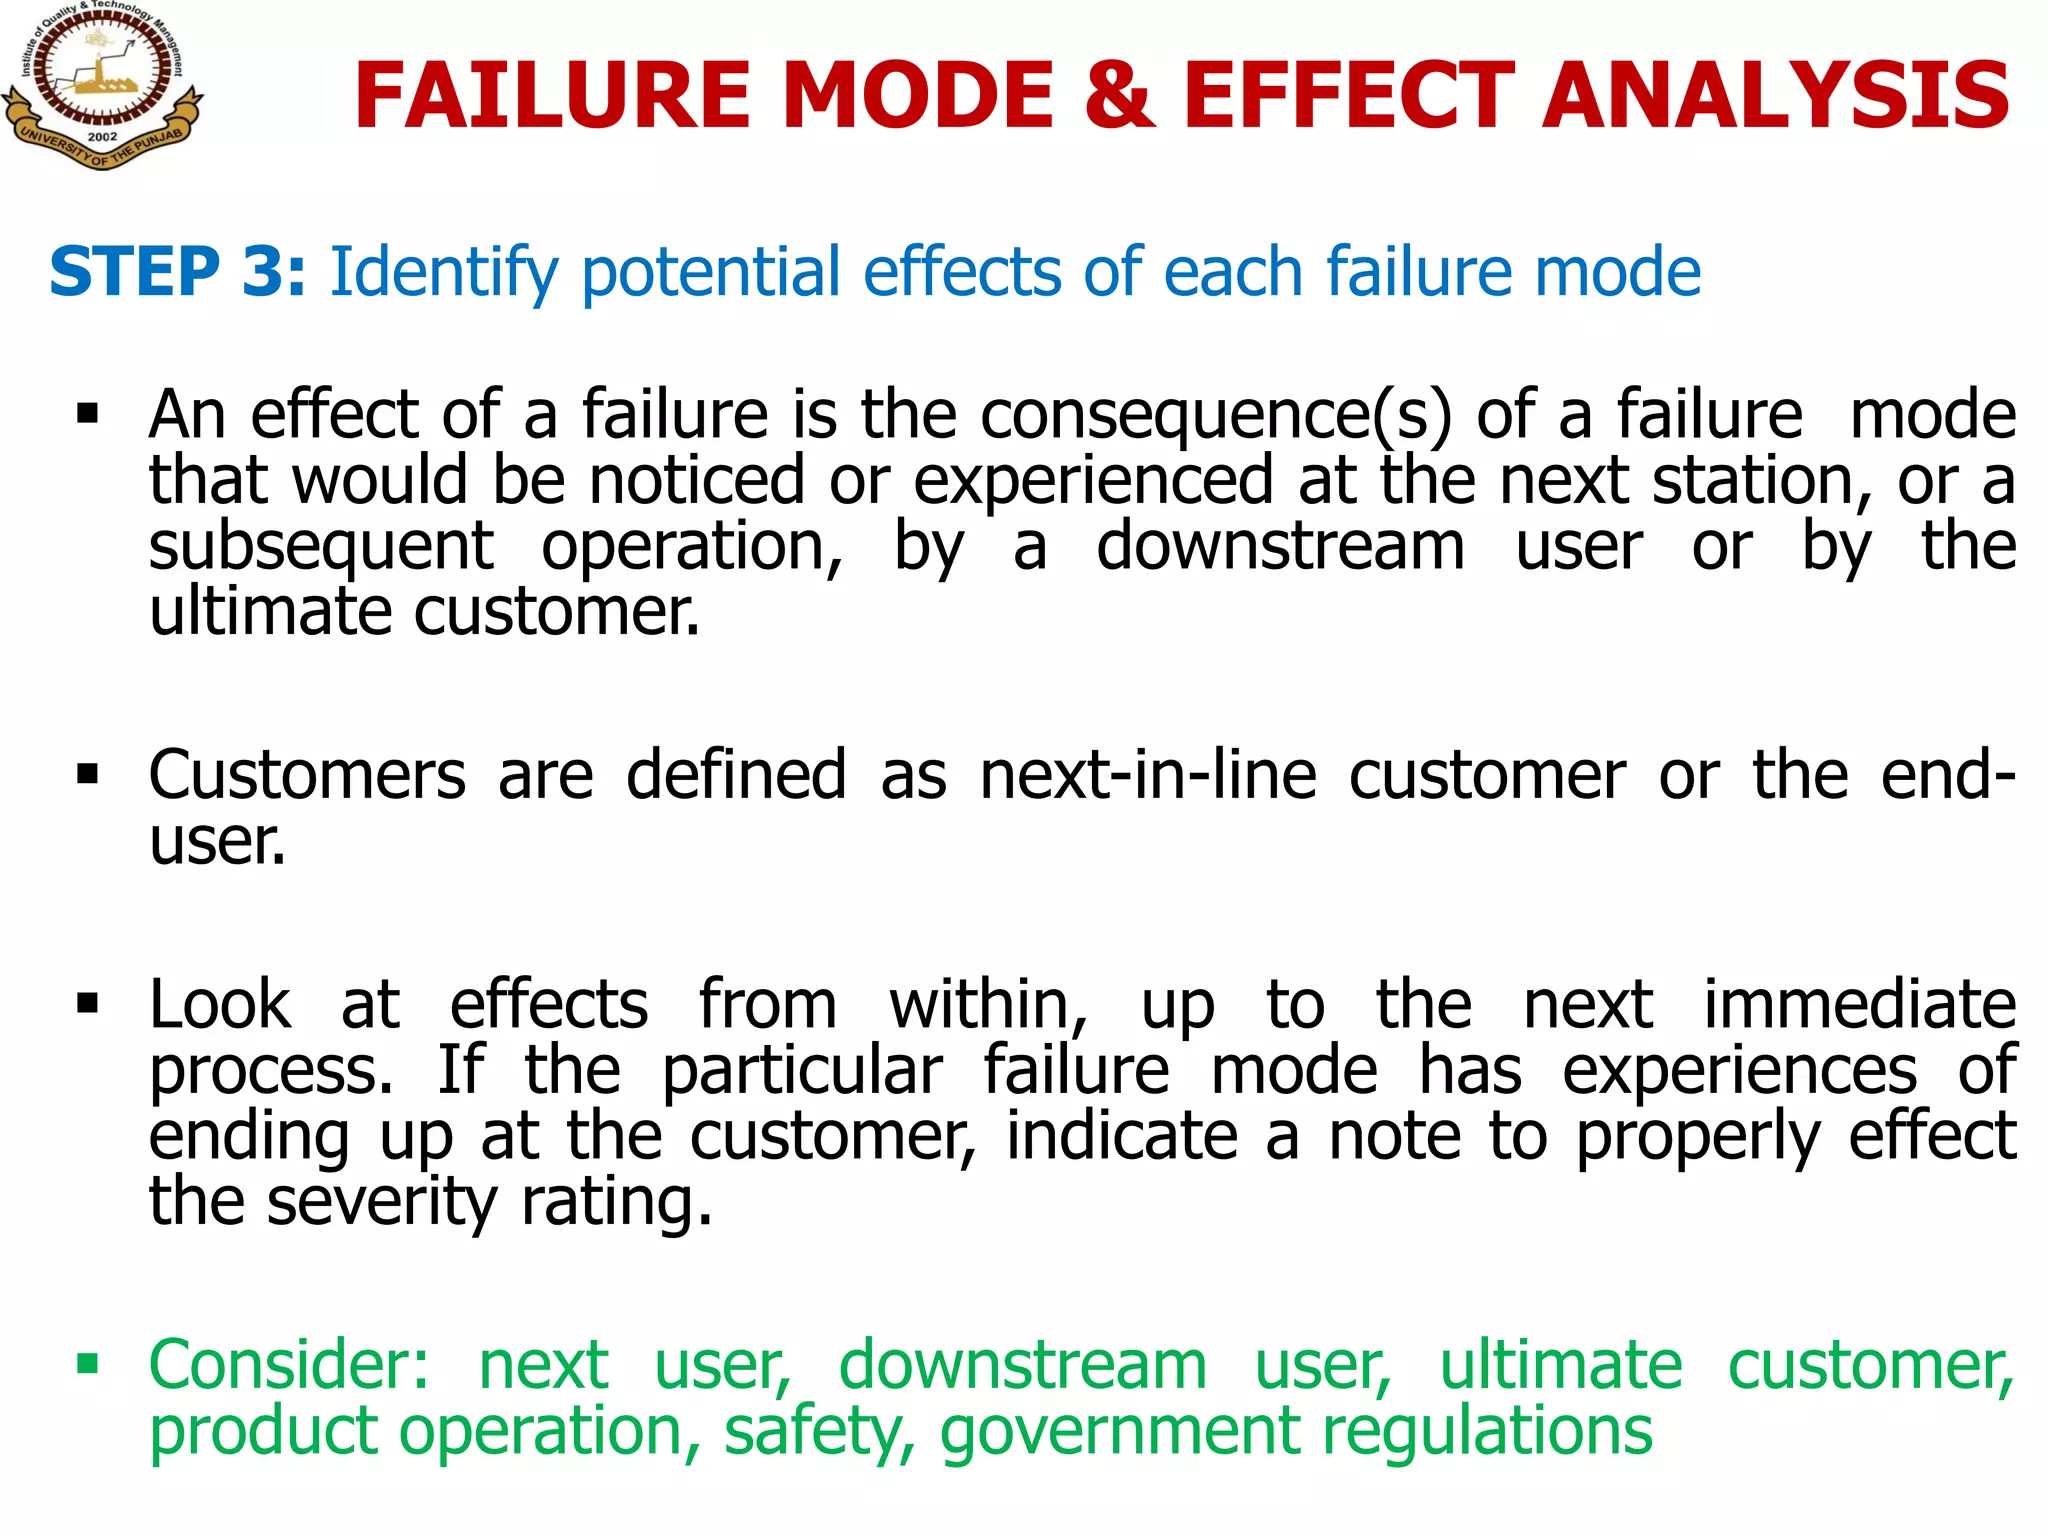
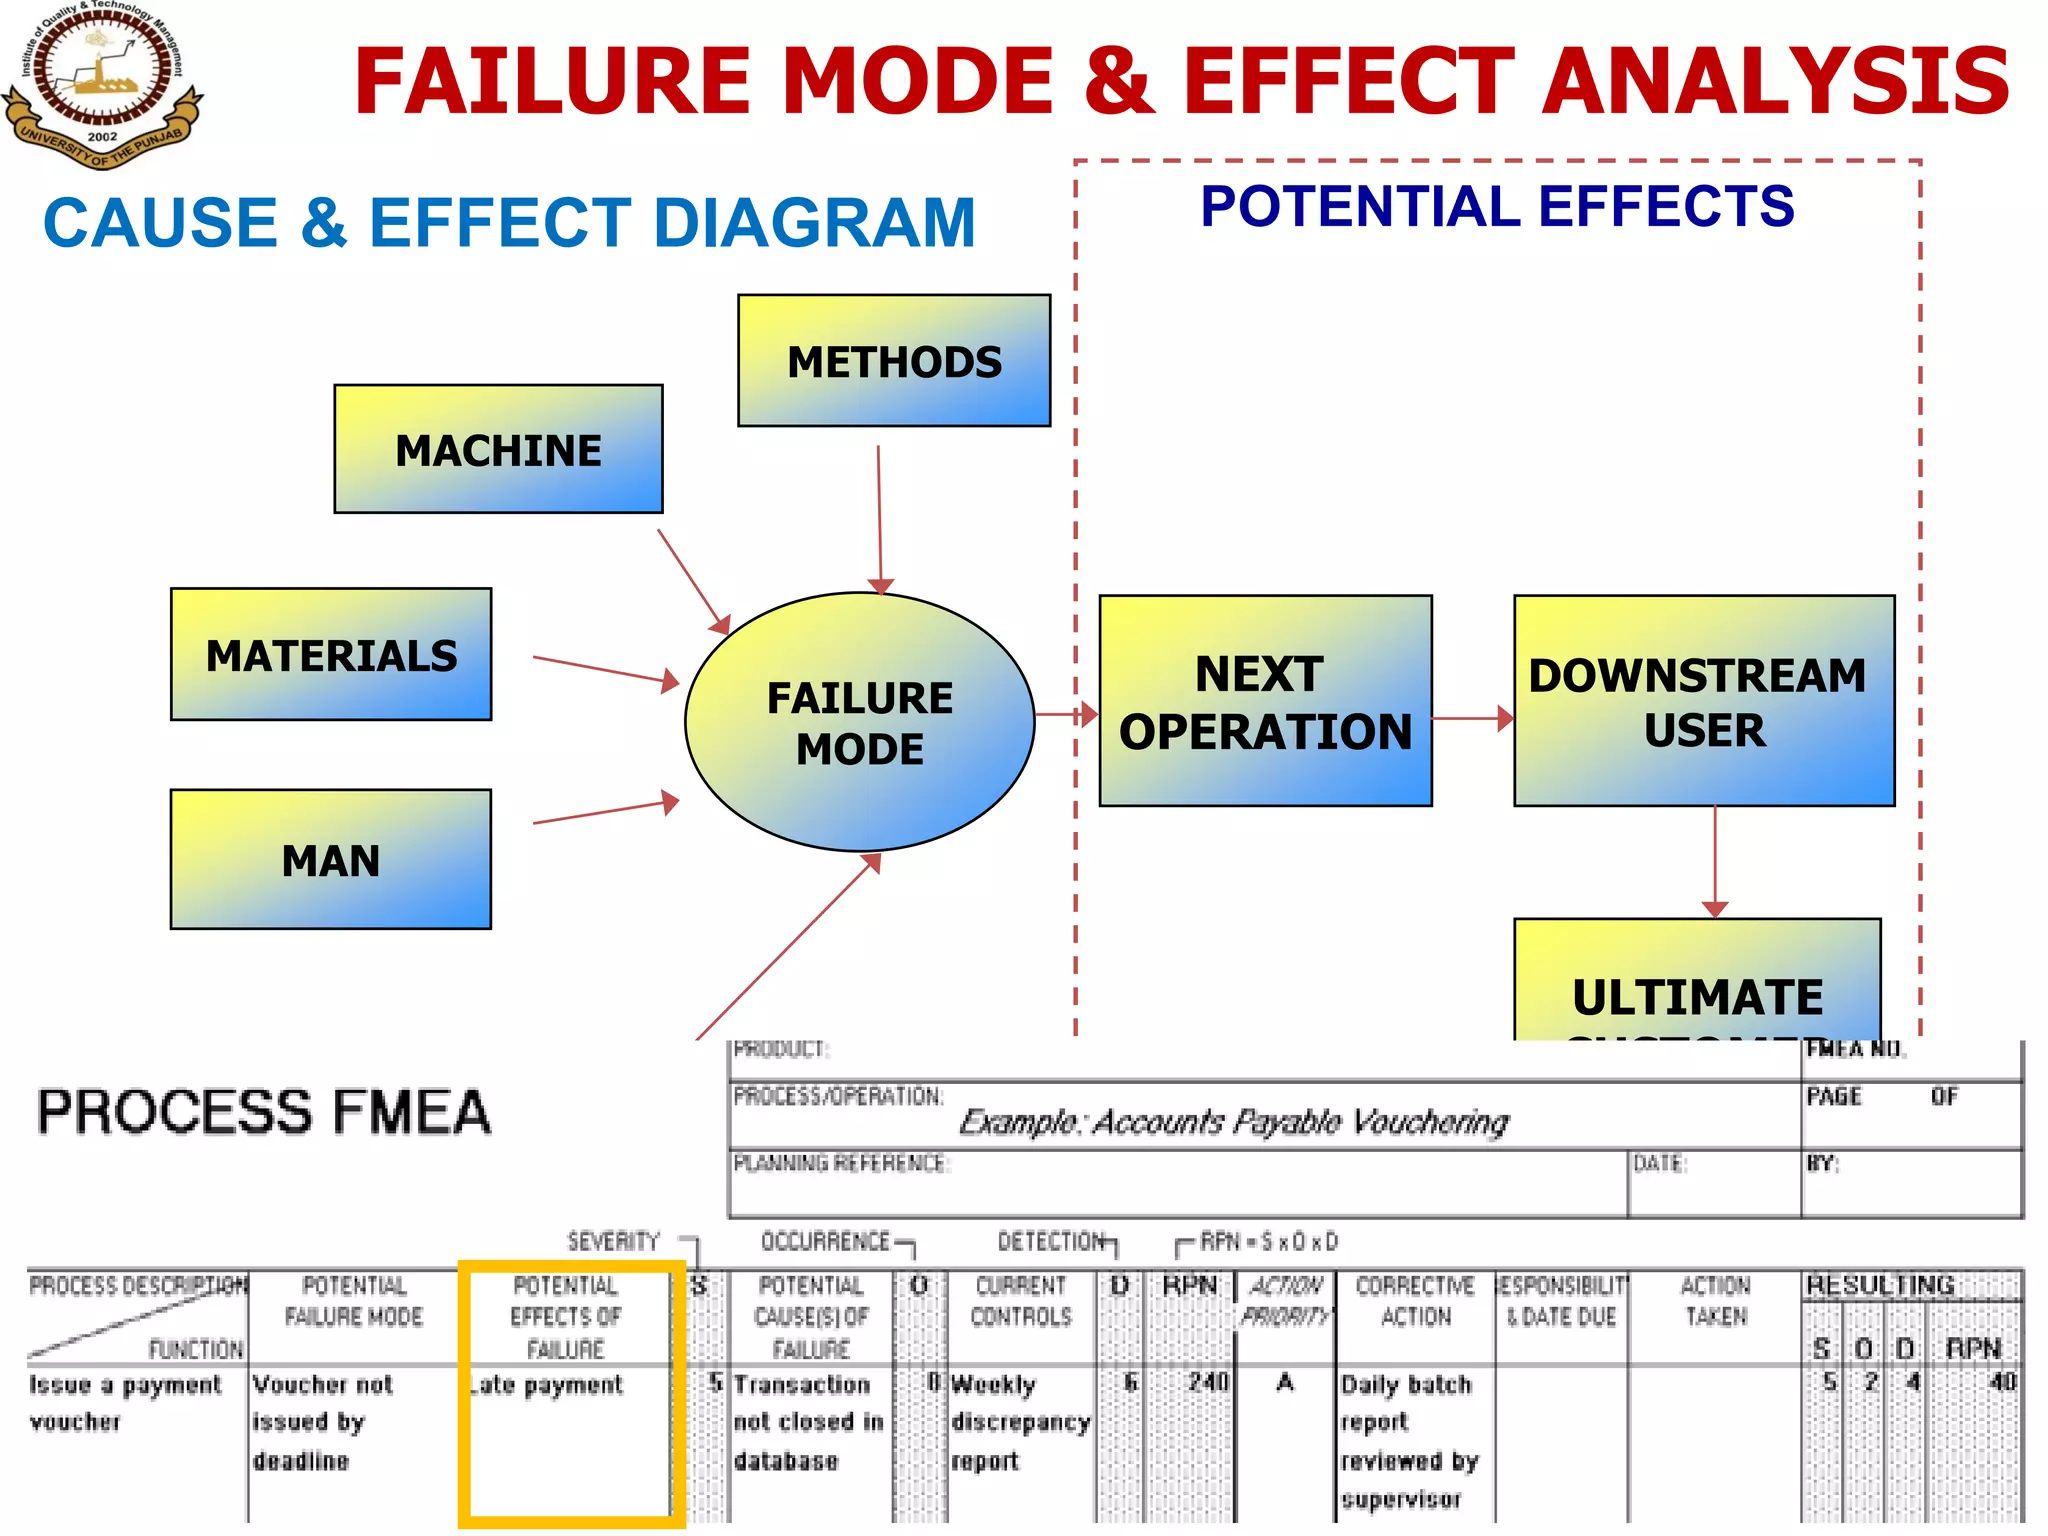
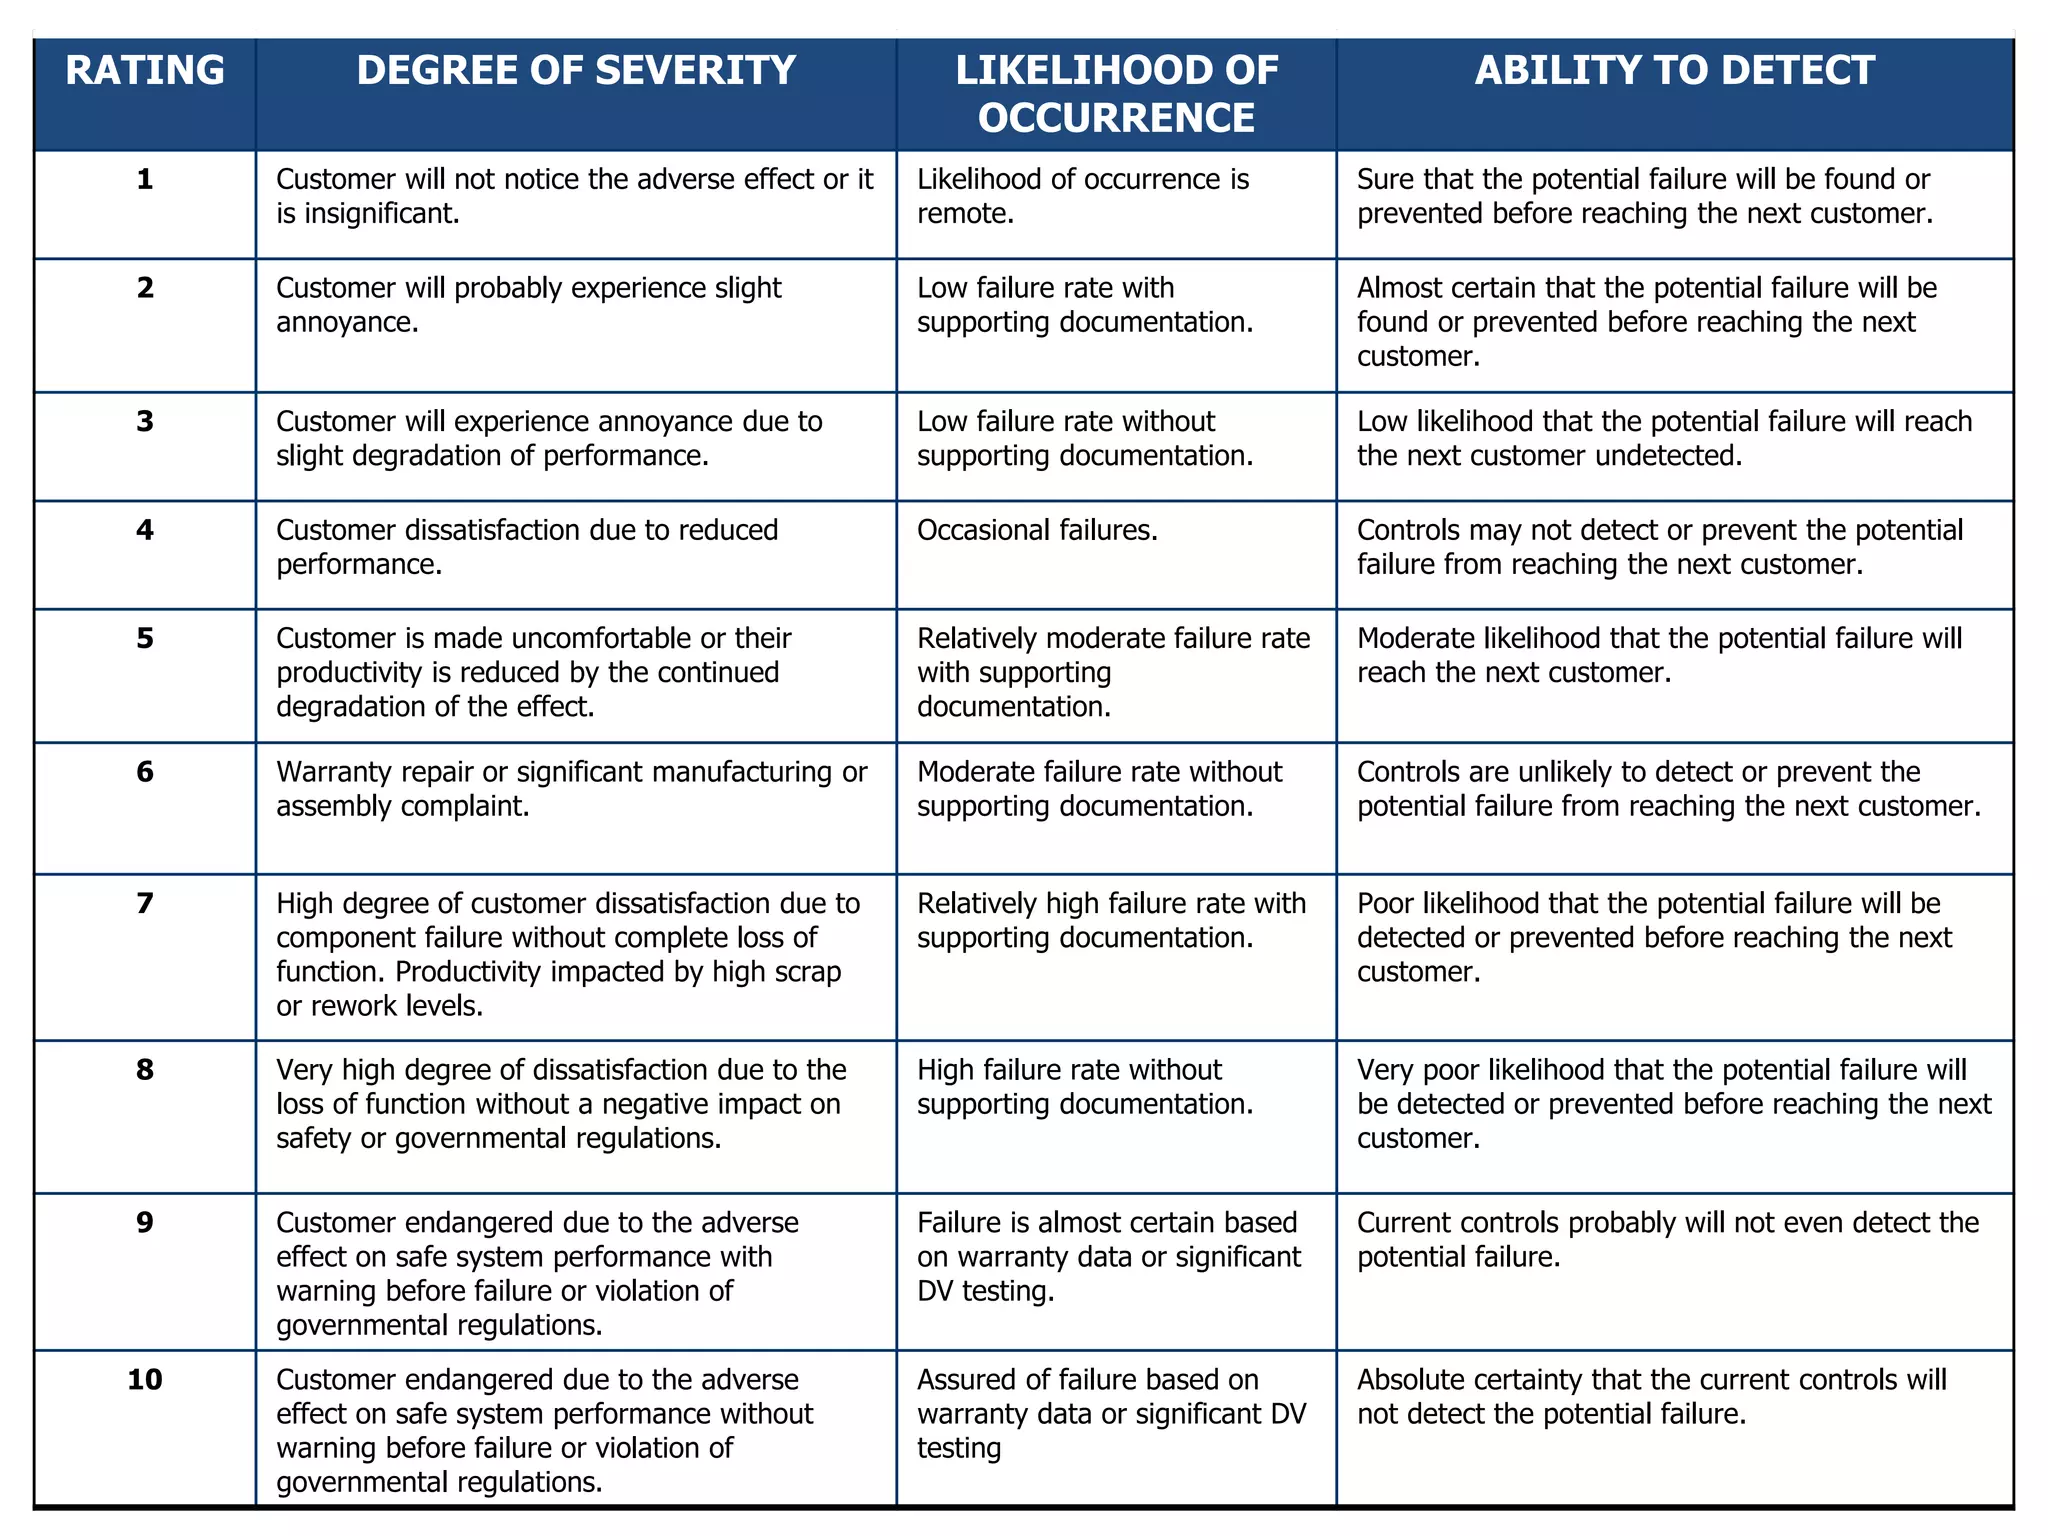
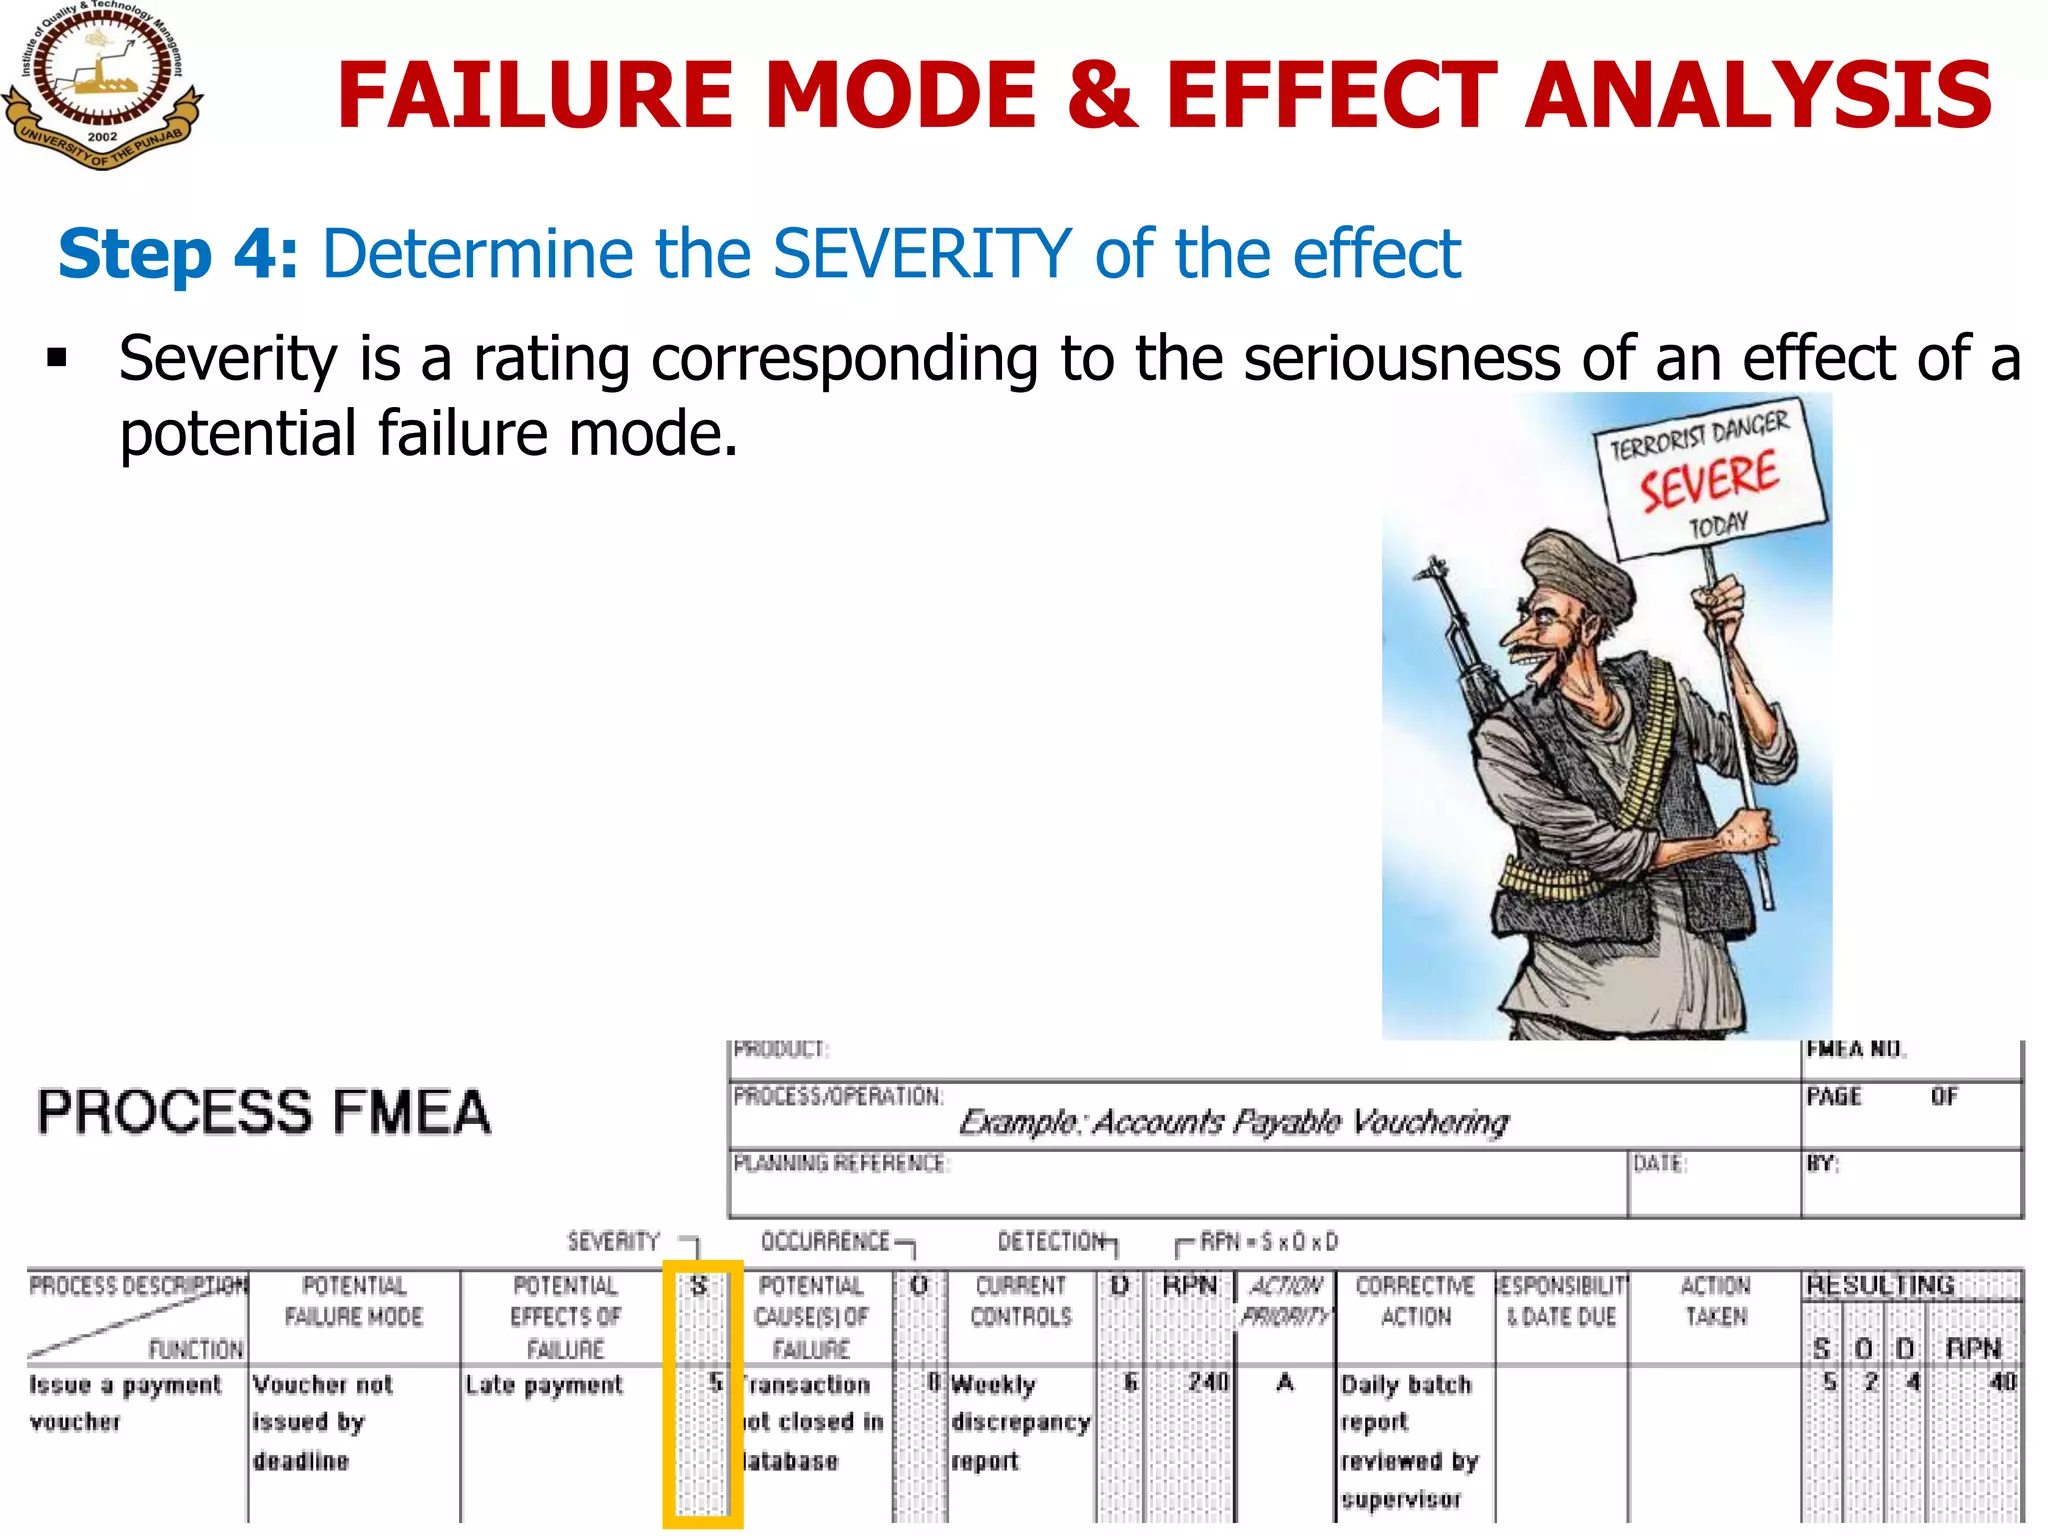
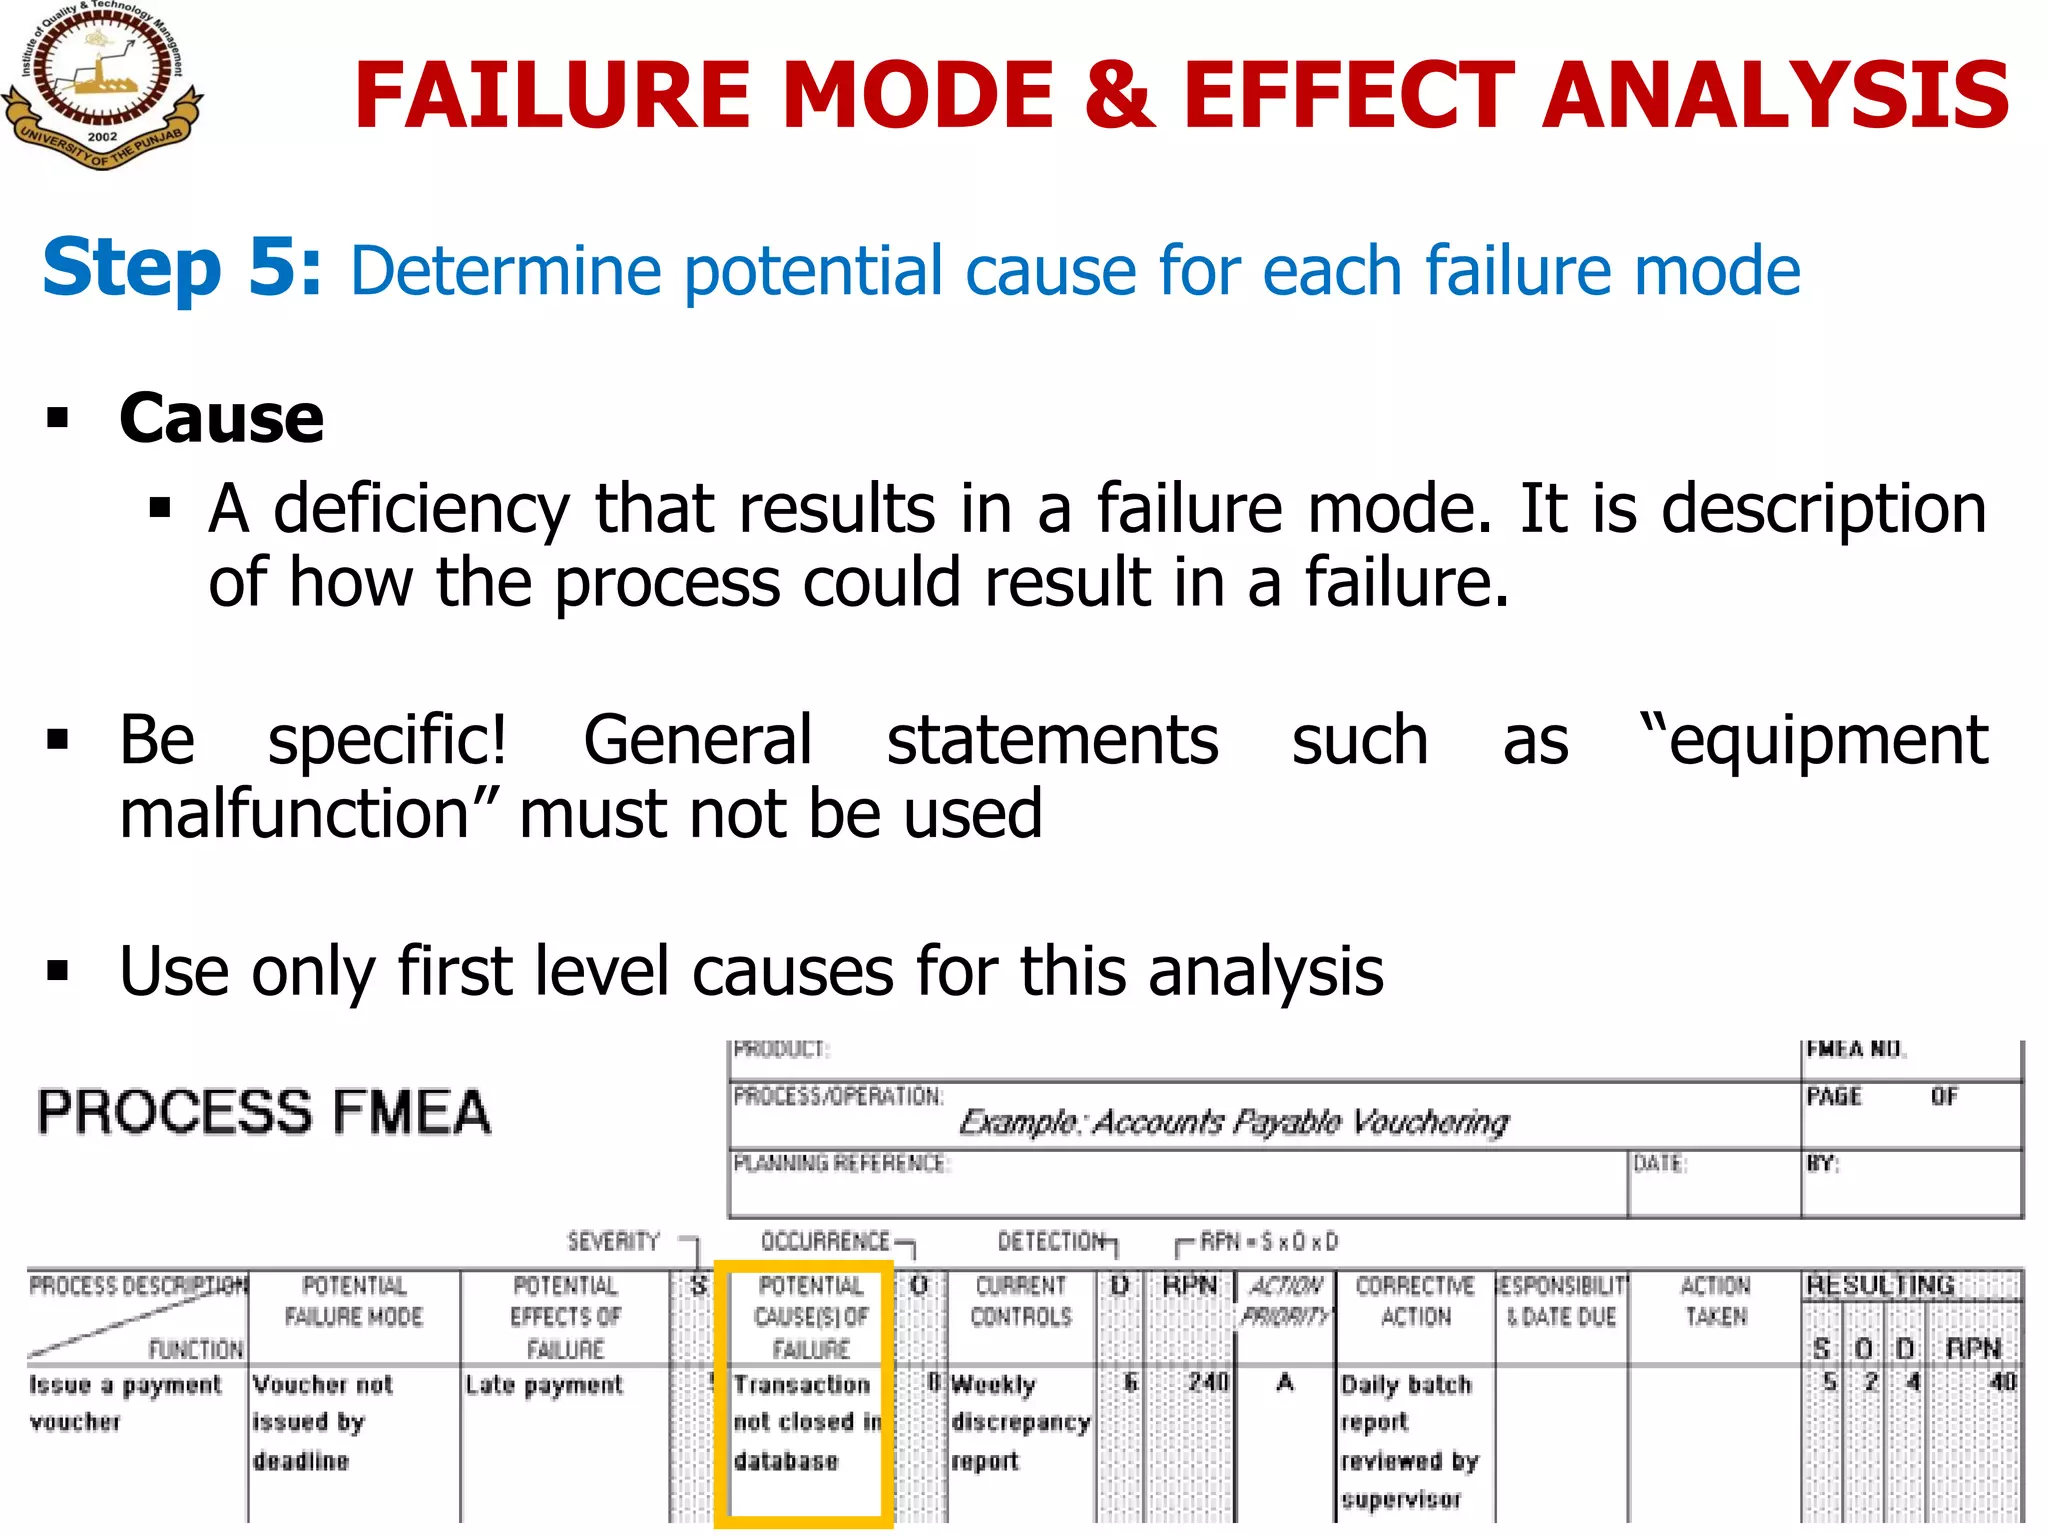
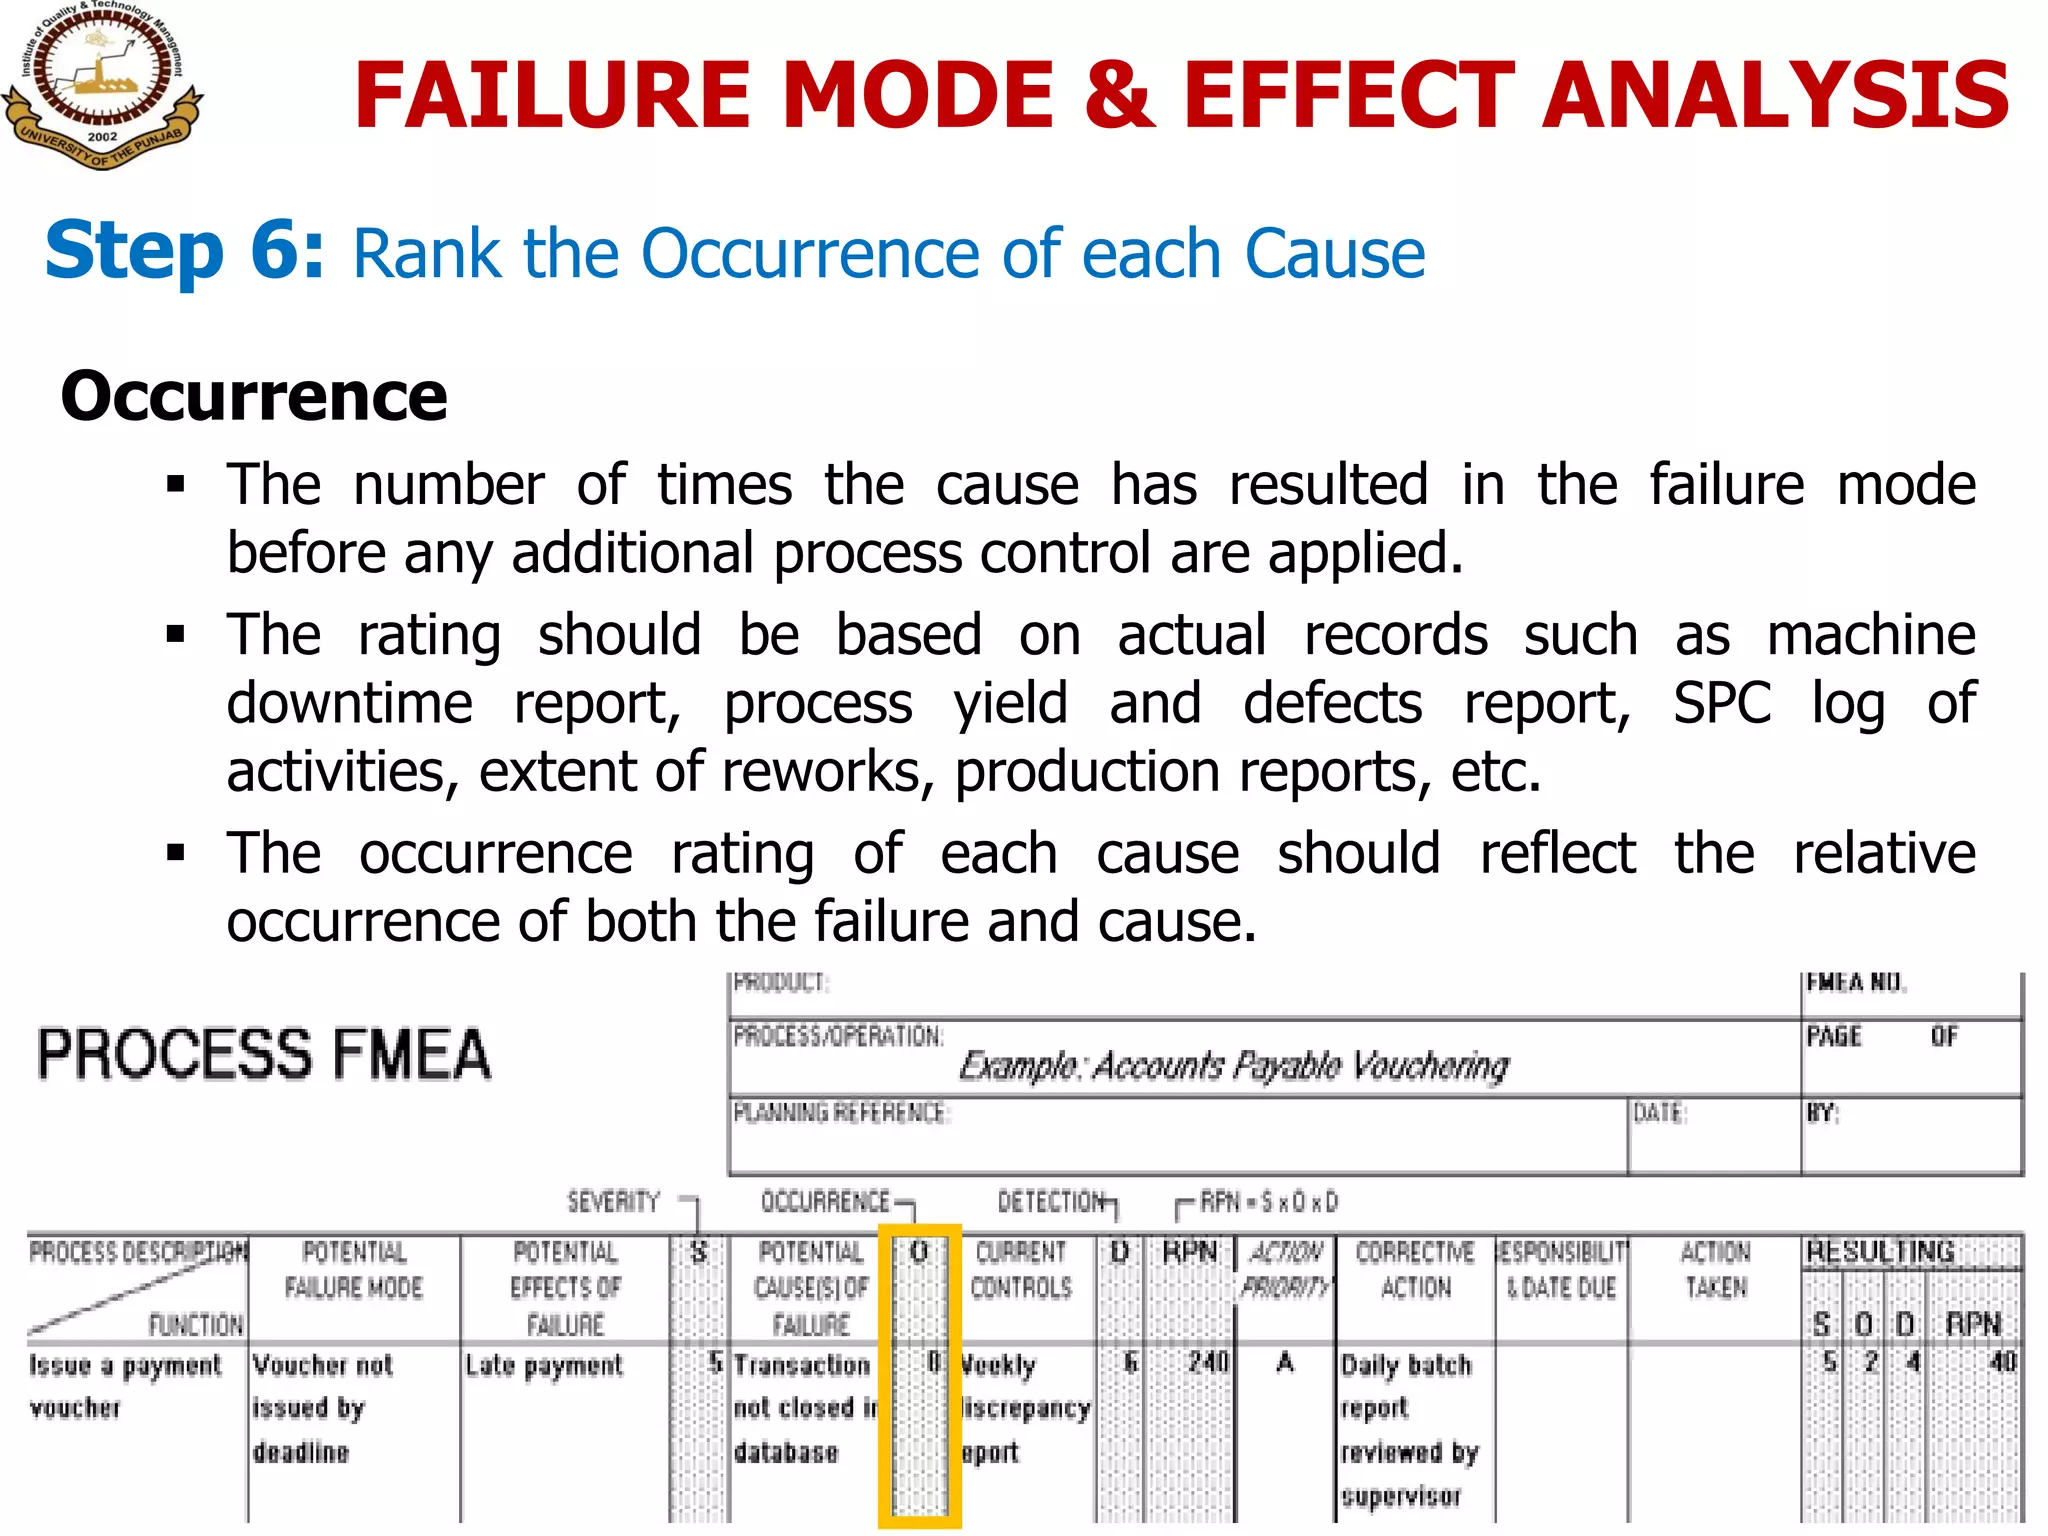
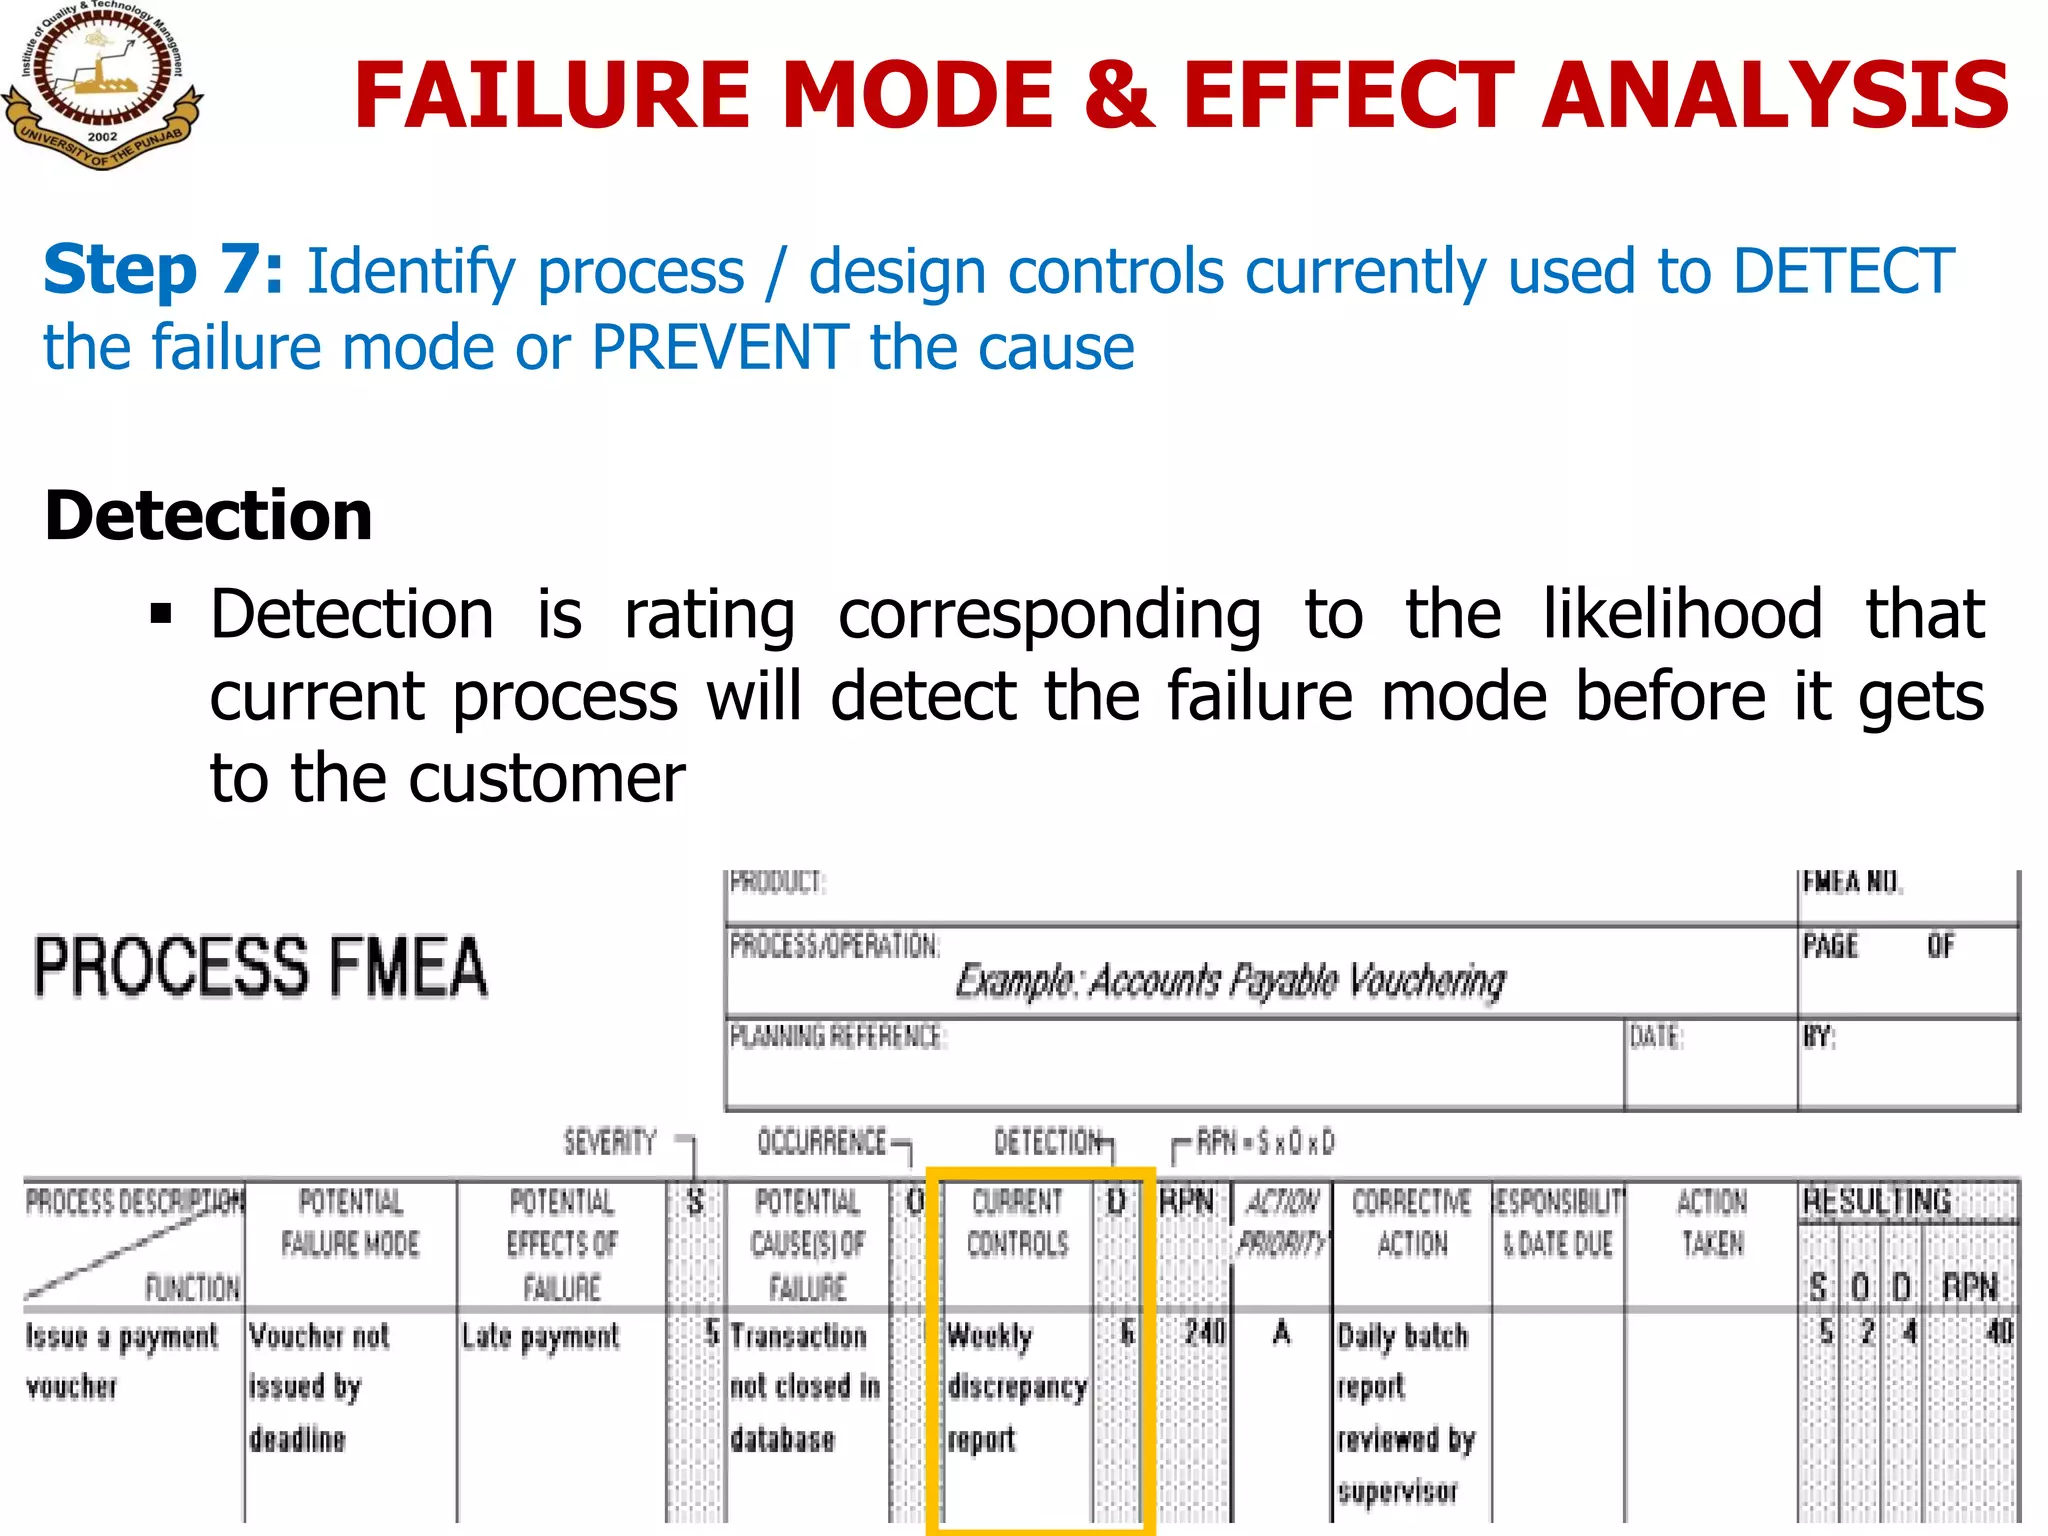
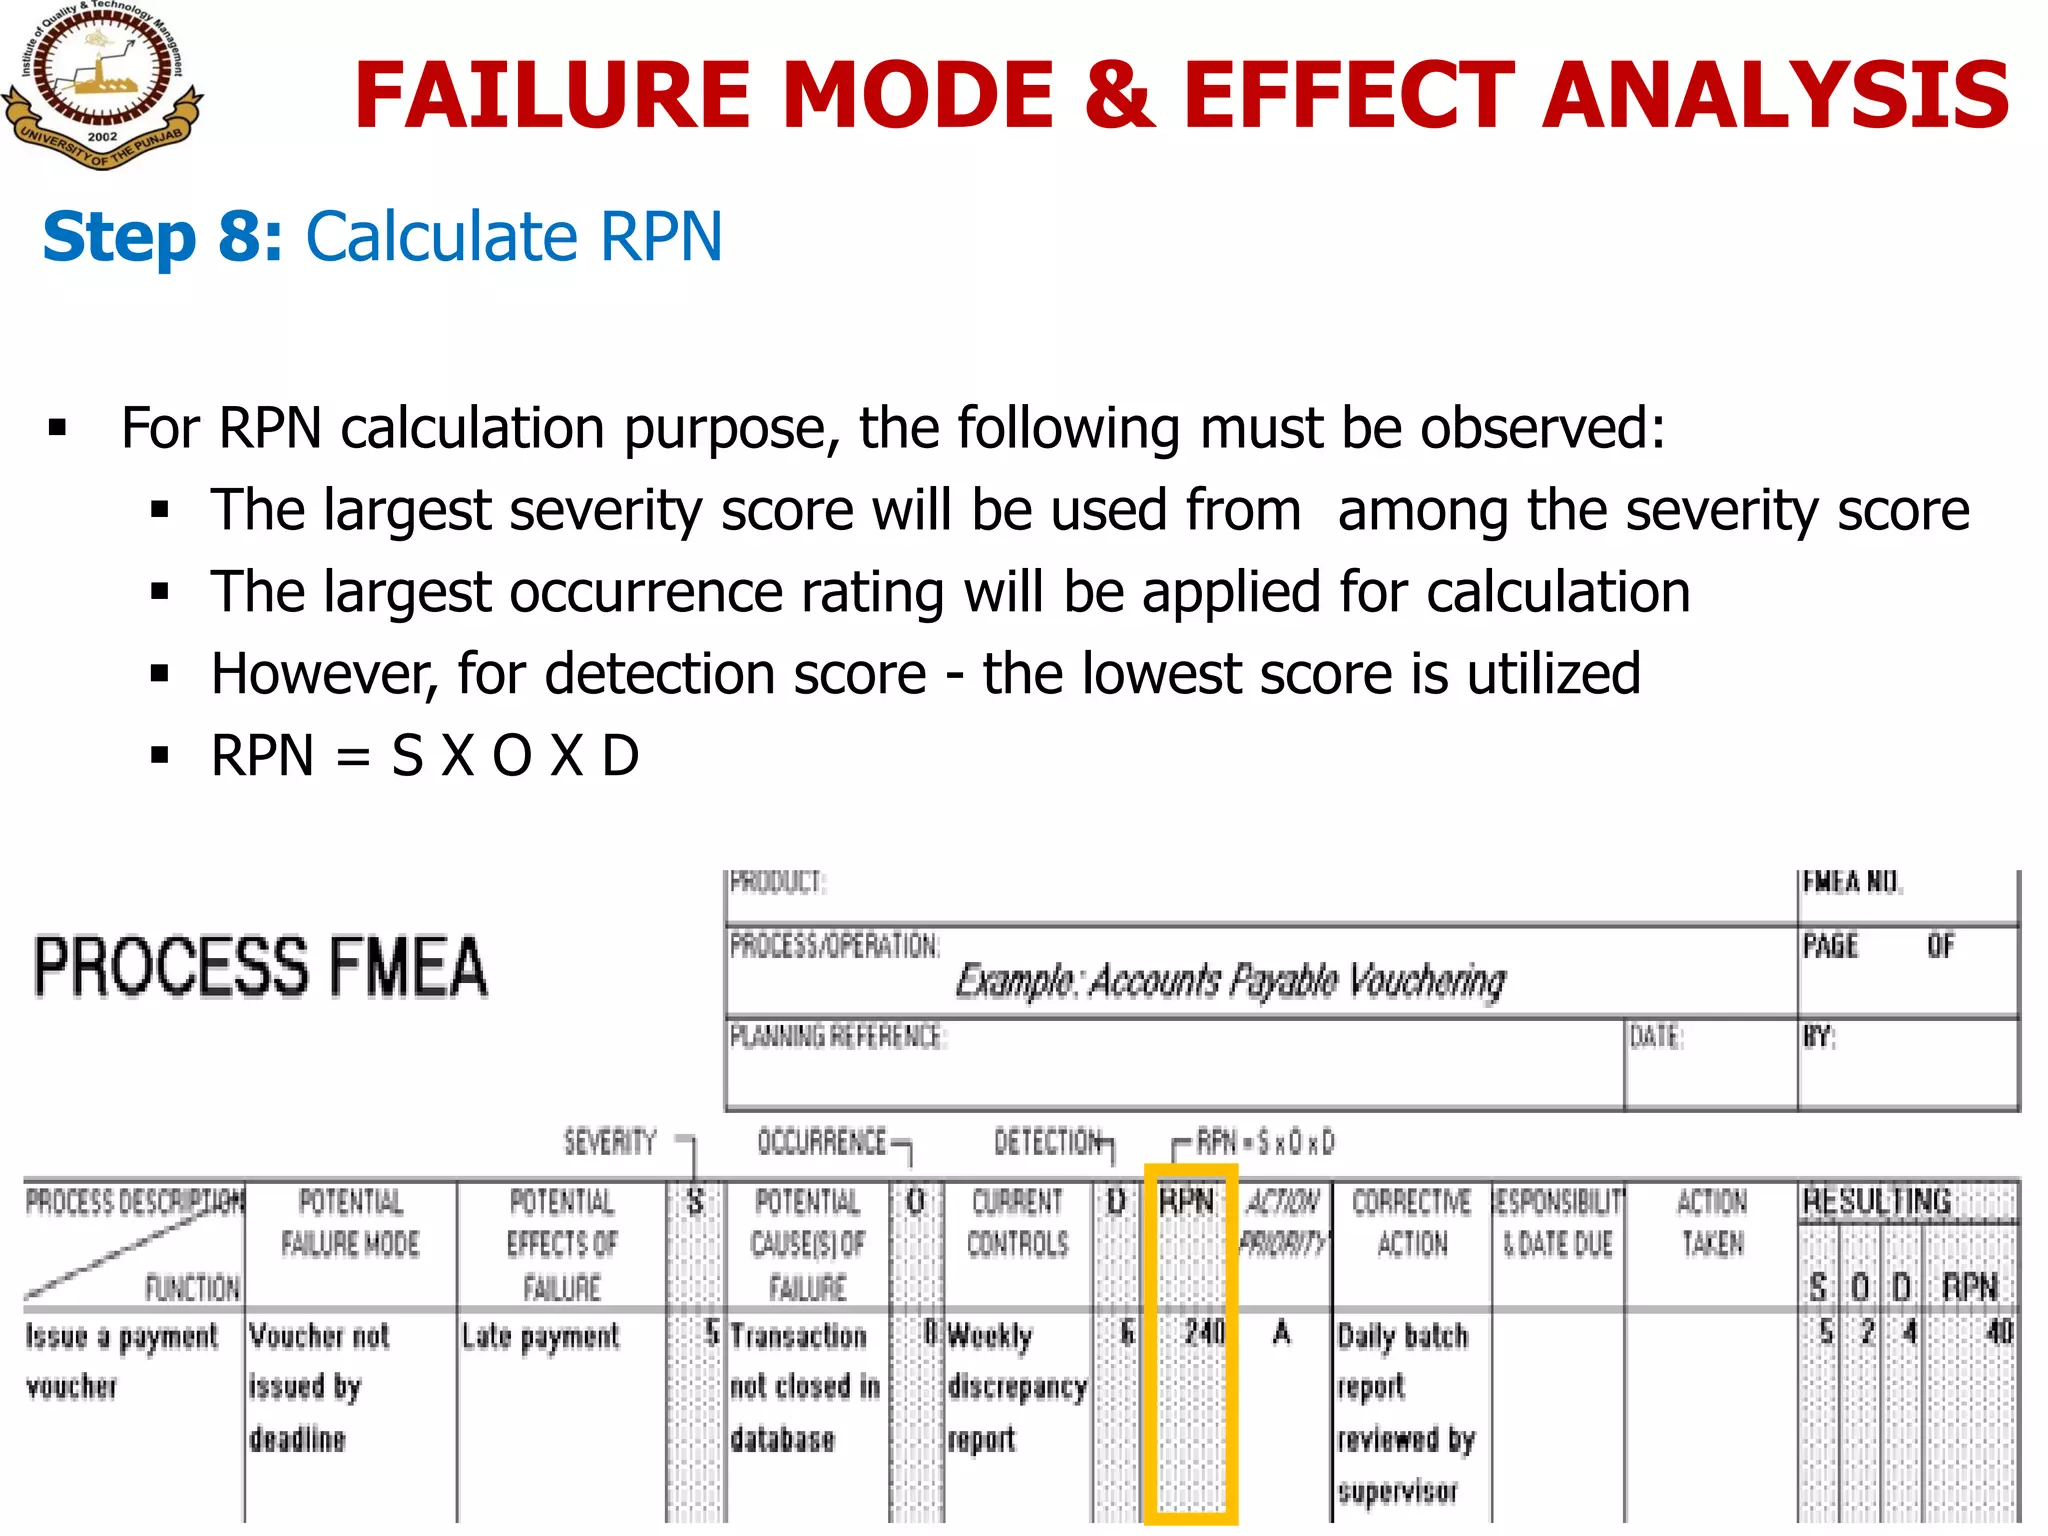
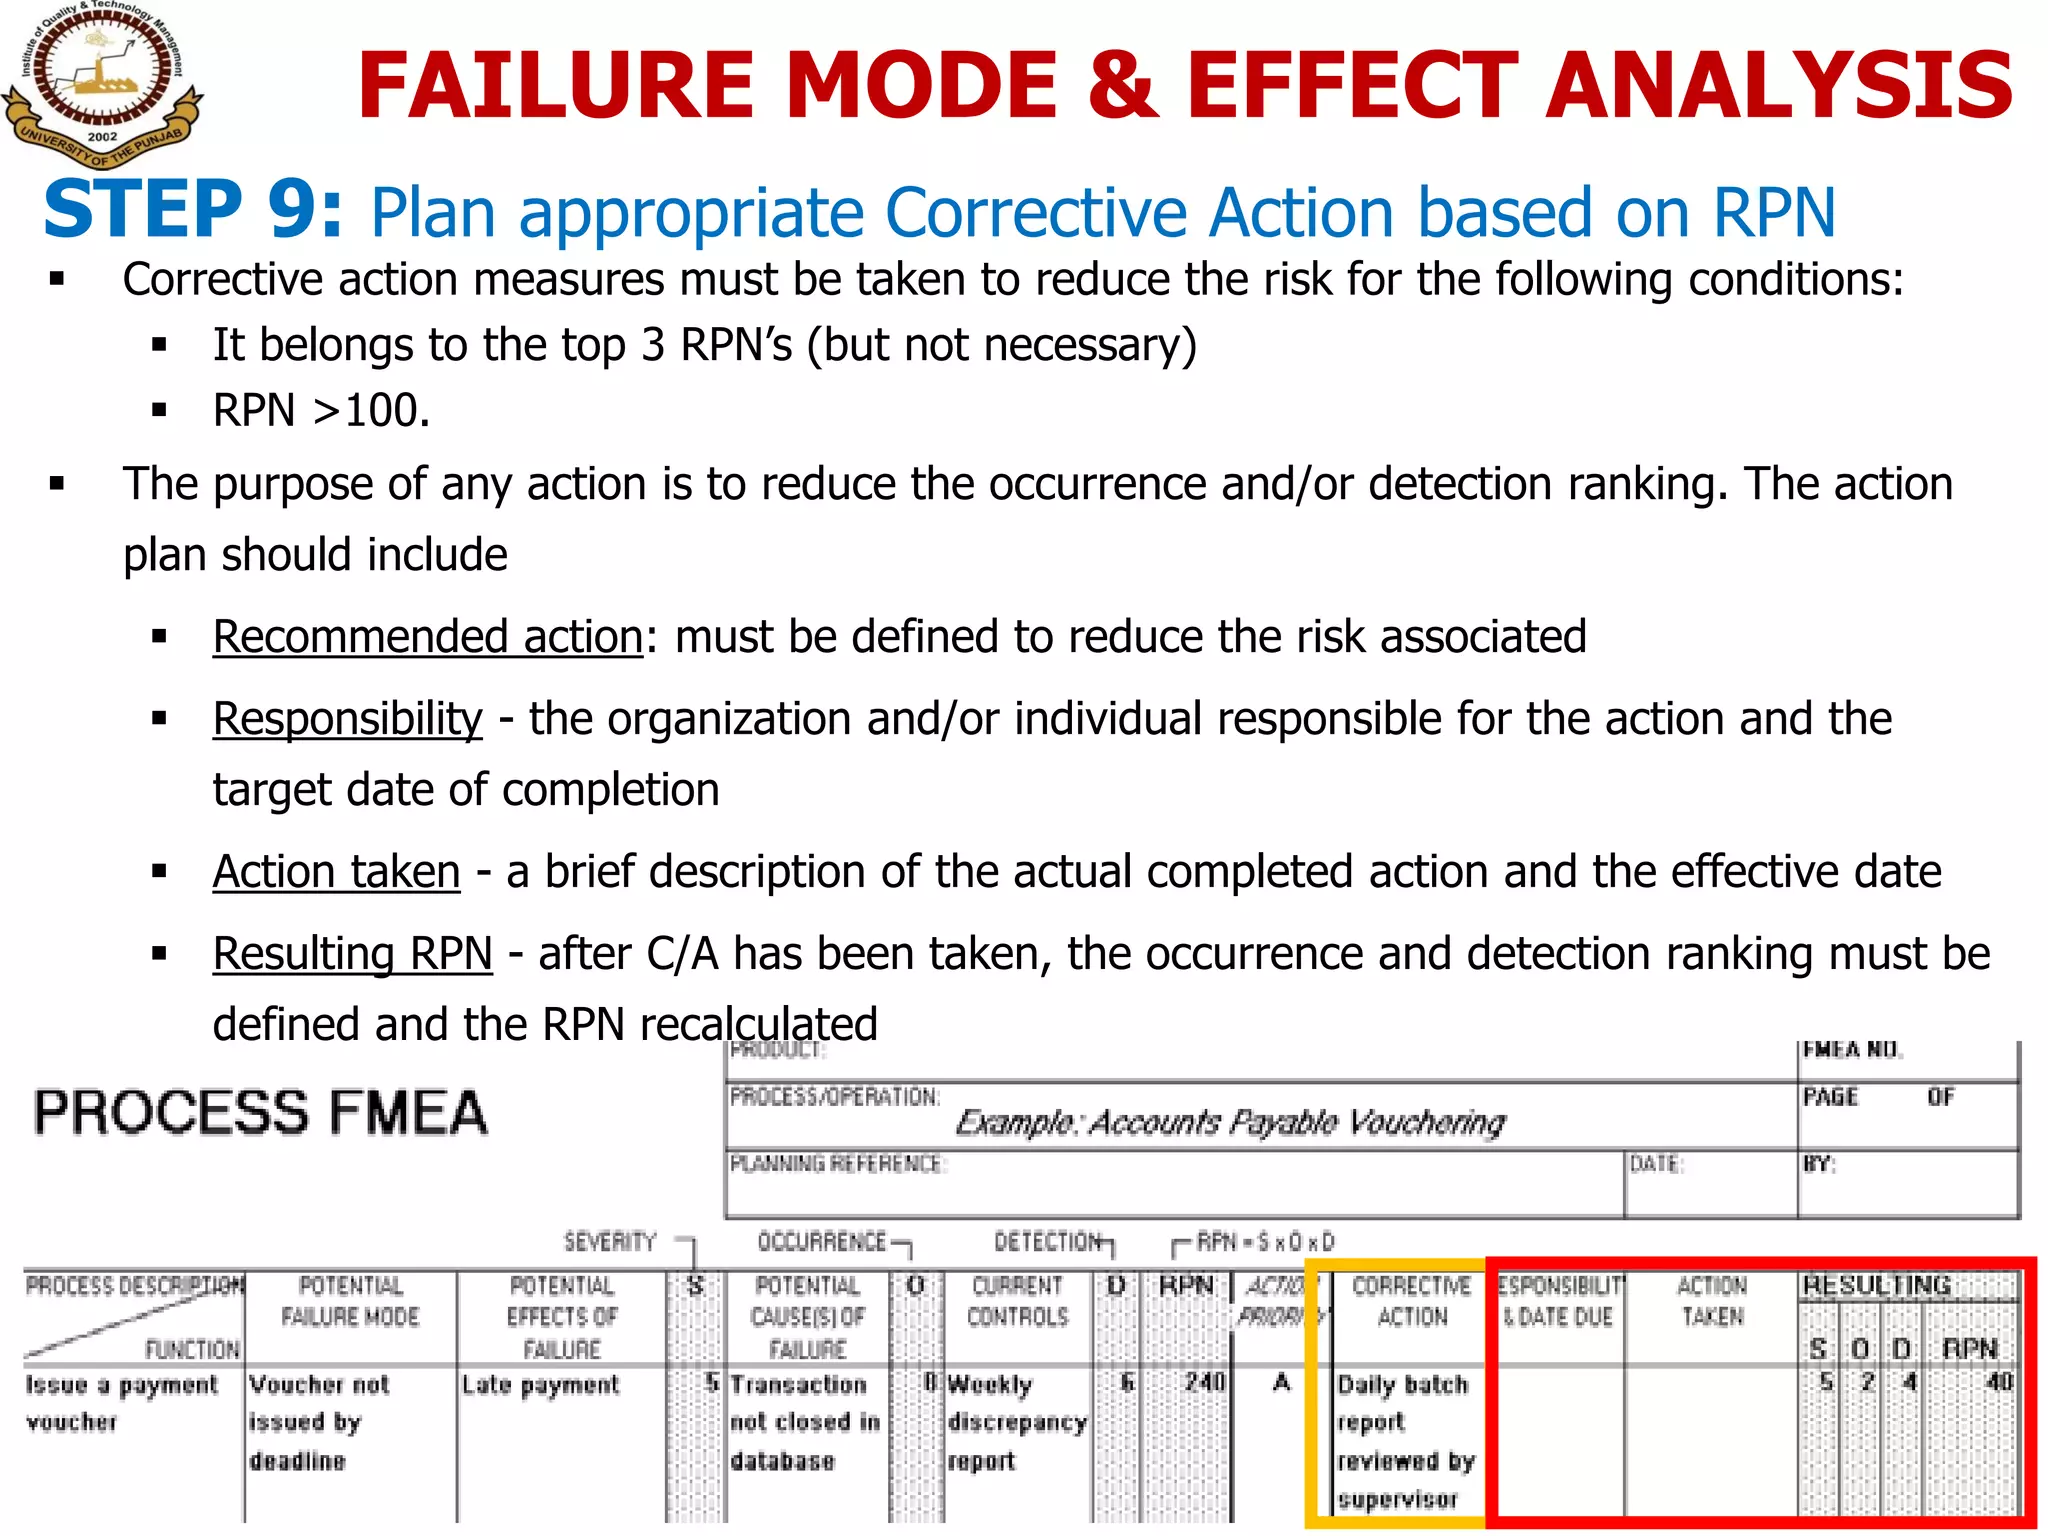


The document provides an overview of failure mode and effects analysis (FMEA). It defines FMEA as a systematic technique used to evaluate potential failures and their causes. The objective is to classify possible failures by their severity, occurrence, and detection to find solutions that eliminate or minimize risks. The document outlines the FMEA process, which involves determining the process/component, identifying potential failure modes and effects, rating severity, occurrence, and detection, calculating the risk priority number, and planning corrective actions. FMEA is a proactive method used in design, manufacturing, and other stages to prevent defects and improve quality.


![7 Quality Control Tools (SQC Model) [MARCH 2009]](https://cdn.slidesharecdn.com/ss_thumbnails/cfakepath7qctools-100630225608-phpapp01-thumbnail.jpg?width=640&height=640&fit=bounds)