Downloaded 26 times


![Hakim SabzevariUniversity
Data Envelopment Analysis DEA Variable Returns to Scale
Note that DMUs Tehran and Tabriz are overall efficient and DMUs
Sabzevar and Mahshad are ineficient with an efficiency rating of
xxxxxxx.
Efficient level of InputsSabzevar:
0.285217391
[
18
]
+ 0.104347826
[
17
]
=
[
6.907826087
]
Efficient levels of OutputsSabzevar:
0.285217391
[
125
50
]
+ 0.104347826
[
80
55
]
=
[
44
20
]
M. Sahebi ·DEA ·February 27, 2018 38 / 49](https://image.slidesharecdn.com/dea-180227075853/85/Data-envelopment-analysis-40-320.jpg)


![Hakim SabzevariUniversity
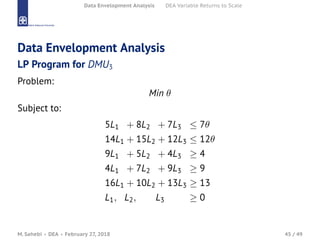
Data Envelopment Analysis DEA Variable Returns to Scale
Note that DMUs 1 and 3 are overall efficient and DMU 2 is ineficient
with an efficiency rating of 0.733333.
Efficient levels of Inputs:
0.261538
[
5
14
]
+ 0.661538
[
7
12
]
=
[
5.935
11.6
]
Efficient levels of Outputs:
0.261538
9
4
16
+ 0.661538
4
9
13
=
5
7
12.785
M. Sahebi ·DEA ·February 27, 2018 47 / 49](https://image.slidesharecdn.com/dea-180227075853/85/Data-envelopment-analysis-51-320.jpg)


The document discusses data envelopment analysis (DEA) and its use in evaluating the relative efficiency of decision making units (DMUs) like bank branches, schools, hospitals, and more. It provides an example comparing four bank branches based on personal transactions and staff numbers. DEA is introduced as a non-parametric method that determines efficiency scores for each DMU based on input and output variables without needing to specify a functional form. The document also explains DEA models like CCR and variable returns to scale and provides an example solving a VRS DEA problem to evaluate the efficiency of the bank branches.


