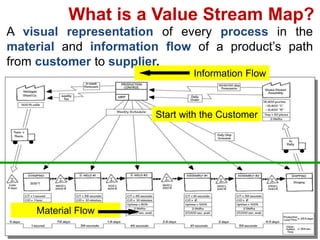
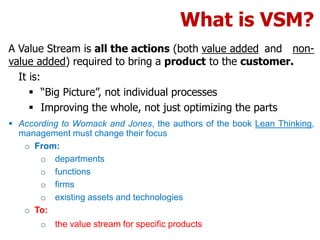
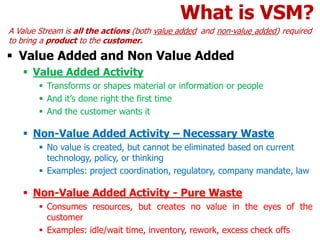
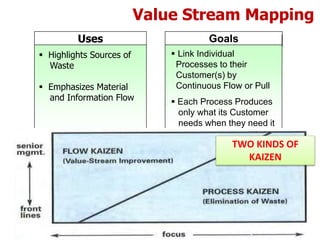
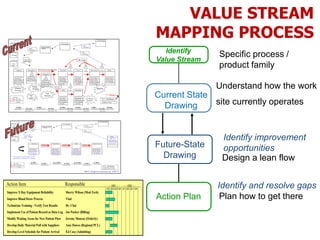
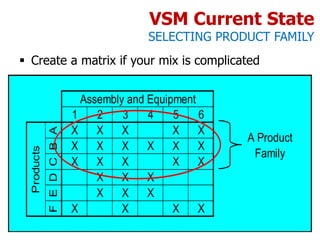
This document provides information on value stream mapping (VSM), including:
1. VSM is a visual tool that maps the flow of materials and information needed to bring a product to a customer. It identifies value-added and non-value added activities to improve process flow and eliminate waste.
2. There are three main types of value streams: raw material to finished product, concept to launch, and order to cash.
3. A current state map visually depicts the actual state of the current process flow, including metrics like cycle times and changeover times.
4. A future state map is then created to design an improved process flow based on eliminating waste and improving flow, with goals and an
This says about the basic concepts pertaining to Process Mapping and Value Stream Mapping , as an initiative towards Lean implemntation in Industrial environment.
Recorded webinar: http://bit.ly/1uVqMJC
Subscribe: http://www.ksmartin.com/subscribe
Purchase the book: http://www.bit.ly/VSM
These are slides from a webinar done with APICS Heartland on the topic of Value Stream Mapping.
This webinar covers:
• How to use value stream mapping as an organizational transformation & leadership alignment tool
• How to plan for a value stream mapping activity
• The mechanics of mapping, including key metrics
for office/service/knowledge work
• How to create an actionable Value Stream Transformation Plan
What is Value Stream Mapping?
History:
What is Value?
What is a Value Stream?
Different things flow through the Stream:
Reason for Mapping & Analysis :
Objectives:
Team Members and Roles in VSM Study Project:
How to create a Value Stream Mapping?:
Value Stream Mapping Process with example
Step 1 - Gather Data and Information:
Step 2 - Create a Current State Map
VSM Study Symbols:
Collecting Data and Time Studies in VSM Study:
Examples of data required in this study:
Process Steps in VSM Study:
Analysis of the Current State Map:
Step 3 – Future State Map & Action Plans:
Creating an Ideal and Future State
Analysis of Future State Map:
Step 4 – Execute the Plan:
Step 5 – Align & Analysis of Current and Future State:
Keys Points for Successful VSM Study:
Mouhcine NAHAL
Value stream mapping is a practical and highly effective way to learn to see and resolve disconnects, redundancies, and gaps in how work gets done.
This VSM project template helps you and your project team to put together a "storyboard" for effective presentation to your key stakeholders. It includes four key phases:
1) Define and pick product/service family
2) Create a current state map
3) Develop a future state map
4) Develop an implementation plan
This document consists of a VSM project template in Powerpoint format and a set of Excel templates comprising VSM charter, Results table, Implementation Plan and common VSM icons.
Recorded webinar: http://slidesha.re/1iJ2ZWu
Subscribe: http://ksmartin.com/subscribe
Purchase the book: http://bit.ly/VSMbk
This webinar presents case studies for several client engagements that involved value stream mapping. For each case, you'll learn:
• What the driver was for value stream improvement.
• What the planning process consisted of.
• The discoveries and challenges that surfaced—and the shifts that occurred—during the 3-day activity.
• Transformation results.
During the webinar, Karen also answers participant questions about facilitation, transformation plan ownership, team composition, going to the Gemba, and collecting data that's not easily measured.
Value stream mapping- lean manufacturing toolbhanutomar
In this competitive world, manufacturing companies has to look at redefining and redesigning of their production systems to attack the competitiveness demanded by the markets. Therefore it is essential to have tools which help in redesign manufacturing process. In this scenario, developed and presented value stream mapping tool as a practical method for redesigning the production systems .The main aim of lean manufacturing is to reduce waste, time to delivery, produce the quality products with economical and efficient manner with response to customer demand. The organizations which are practicing lean manufacturing have quality & cost advantages compared to the organizations that are still using traditional production.
The VSM process is straight forward and simple. It always starts at customer demand and work back through documenting all the process and collecting data which is required for manufacturing of a product. It shows the map “Value stream” containing all the data such as work in process, cycle time, lead time, number of equipment’s, operators. Documenting relationship between the controls used to manage the manufacturing process is very important in VSM. Unlike other mapping techniques that only map product flow, VSM documents material & information flow.
More Information:
https://flevy.com/browse/business-document/lean-manufacturing-160
BENEFITS OF DOCUMENT
Learn how to eliminate waste to save time and make more money.
Learn how to apply simple Lean methods and tools in the workplace to improve productivity and quality.
DOCUMENT DESCRIPTION
Lean is a management philosophy based on the Toyota Production System (TPS). With Lean Manufacturing, you will be able to enhance value for your customers by improving and smoothing the process flow and eliminating waste. Simply put, with Lean, you will be able to increase productivity and create greater customer value with less resources.
By teaching this presentation, managers and employees will have a better understanding of the Lean principles and approach to eliminating waste, and will be more forthcoming to lead and participate in the Lean implementation process.
LEARNING OBJECTIVES
1. Understand the key concepts and principles of Lean
2. Acquire knowledge on the common Lean methods and tools and their applications to eliminate waste and create more value for customers
3. Identify ways to develop "Kaizen eyes" to look for improvement opportunities
4. Describe the various Lean roles
5. Define the critical success factors for sustaining a Lean culture
CONTENTS
1. Introduction to Lean Thinking
- The case for Lean Manufacturing
- Where did Lean originate?
- Toyota's philosophy
- Lean adoption in various environments
- Impact of Lean principles in industry
- Lean applications in manufacturing, process and service industries
- What is Lean?
- What Lean is not
- Traditional thinking versus Lean thinking
- Traditional culture vs. Lean culture
- Lean management framework
- Lean and six sigma
- Benefits of Lean manufacturing
Got a question about this presentation? Email us at support@flevy.com.
Value stream mapping is use full in all production and manufacturing lines. It really minimize the waste in the system and helps to deliver finish product in time.
“Lean” is a management philosophy based on the Toyota Production System (TPS). With Lean Manufacturing, you will be able to enhance value for your customers by improving and smoothing the process flow and eliminating waste. Simply put, with Lean, you will be able to increase productivity and create greater customer value with less resources.
By teaching this presentation, managers and employees will have a better understanding of the Lean principles and approach to eliminating waste, and will be more forthcoming to lead and participate in the Lean implementation process.
LEARNING OBJECTIVES
1. Acquire knowledge on the key concepts and principles of Lean
2. Describe the common Lean methods and tools for waste elimination and value creation
3. Describe the key roles in Lean deployment
4. Define the success factors for sustaining a Lean culture
CONTENTS
1. Introduction to Lean Manufacturing
2. Key Concepts of Lean
3. Lean Methods & Tools
4. Lean Roles
5. Sustaining a Lean Culture
To download this presentation, visit:
https://www.oeconsulting.com.sg/training-presentations
The Lean Kanban Systems Training Module v2.0 includes:
1. MS PowerPoint Presentation including 83 slides covering an Introduction to Lean Management, Benefits of Lean Kanban Systems, Kanban Size Calculations, Three Types of Kanban Systems - Single Card Kanban - Dual or Machine Card Kanban - In-Process Kanban, and a Step-by-Step Kanban Implementation Process.
Lean Quick Changeover (SMED) Training ModuleFrank-G. Adler
The Lean Quick Changeover (SMED) Training Module v2.0 includes:
1. MS PowerPoint Presentation including 65 slides covering an Introduction to Lean Management, The Seven Lean Wastes, Lean Kaizen Events, and a Step-by-Step Changeover Time Reduction (SMED) Process.
2. MS Excel Changeover Time Analysis Worksheet Template
2011 Sterilization Forum presentation covering topics of strategic growth planning, resource requirements planning and Central Sterile management tools and techniques
Graphically viewing the flow of value as its fit, form and/or function is improved from suppliers to customers. It shows value-added and non-value-added activities.
Value Stream Mapping is a key component of Value Stream Management – the process by which Lean concepts and tools are utilized to minimize waste and promote one piece flow pulled by customer demand through the entire operation.
Dear All, This is very comprehensive training on application of 7QC tools in industry. There is now a common demand in every industry to improve and control the process by achieving product quality with integrity. These 7-QC tools are very useful to fulfil industry demand by controlling the process. I am expecting your kind suggestions and comments to improve my presentation further. Thanks a lot everyone for your time to read this presentation. I hope it will definitely give some value addition in your routine life. Thanking you!
As a business owner in Delaware, staying on top of your tax obligations is paramount, especially with the annual deadline for Delaware Franchise Tax looming on March 1. One such obligation is the annual Delaware Franchise Tax, which serves as a crucial requirement for maintaining your company’s legal standing within the state. While the prospect of handling tax matters may seem daunting, rest assured that the process can be straightforward with the right guidance. In this comprehensive guide, we’ll walk you through the steps of filing your Delaware Franchise Tax and provide insights to help you navigate the process effectively.
The world of search engine optimization (SEO) is buzzing with discussions after Google confirmed that around 2,500 leaked internal documents related to its Search feature are indeed authentic. The revelation has sparked significant concerns within the SEO community. The leaked documents were initially reported by SEO experts Rand Fishkin and Mike King, igniting widespread analysis and discourse. For More Info:- https://news.arihantwebtech.com/search-disrupted-googles-leaked-documents-rock-the-seo-world/
Personal Brand Statement:
As an Army veteran dedicated to lifelong learning, I bring a disciplined, strategic mindset to my pursuits. I am constantly expanding my knowledge to innovate and lead effectively. My journey is driven by a commitment to excellence, and to make a meaningful impact in the world.
"𝑩𝑬𝑮𝑼𝑵 𝑾𝑰𝑻𝑯 𝑻𝑱 𝑰𝑺 𝑯𝑨𝑳𝑭 𝑫𝑶𝑵𝑬"
𝐓𝐉 𝐂𝐨𝐦𝐬 (𝐓𝐉 𝐂𝐨𝐦𝐦𝐮𝐧𝐢𝐜𝐚𝐭𝐢𝐨𝐧𝐬) is a professional event agency that includes experts in the event-organizing market in Vietnam, Korea, and ASEAN countries. We provide unlimited types of events from Music concerts, Fan meetings, and Culture festivals to Corporate events, Internal company events, Golf tournaments, MICE events, and Exhibitions.
𝐓𝐉 𝐂𝐨𝐦𝐬 provides unlimited package services including such as Event organizing, Event planning, Event production, Manpower, PR marketing, Design 2D/3D, VIP protocols, Interpreter agency, etc.
Sports events - Golf competitions/billiards competitions/company sports events: dynamic and challenging
⭐ 𝐅𝐞𝐚𝐭𝐮𝐫𝐞𝐝 𝐩𝐫𝐨𝐣𝐞𝐜𝐭𝐬:
➢ 2024 BAEKHYUN [Lonsdaleite] IN HO CHI MINH
➢ SUPER JUNIOR-L.S.S. THE SHOW : Th3ee Guys in HO CHI MINH
➢FreenBecky 1st Fan Meeting in Vietnam
➢CHILDREN ART EXHIBITION 2024: BEYOND BARRIERS
➢ WOW K-Music Festival 2023
➢ Winner [CROSS] Tour in HCM
➢ Super Show 9 in HCM with Super Junior
➢ HCMC - Gyeongsangbuk-do Culture and Tourism Festival
➢ Korean Vietnam Partnership - Fair with LG
➢ Korean President visits Samsung Electronics R&D Center
➢ Vietnam Food Expo with Lotte Wellfood
"𝐄𝐯𝐞𝐫𝐲 𝐞𝐯𝐞𝐧𝐭 𝐢𝐬 𝐚 𝐬𝐭𝐨𝐫𝐲, 𝐚 𝐬𝐩𝐞𝐜𝐢𝐚𝐥 𝐣𝐨𝐮𝐫𝐧𝐞𝐲. 𝐖𝐞 𝐚𝐥𝐰𝐚𝐲𝐬 𝐛𝐞𝐥𝐢𝐞𝐯𝐞 𝐭𝐡𝐚𝐭 𝐬𝐡𝐨𝐫𝐭𝐥𝐲 𝐲𝐨𝐮 𝐰𝐢𝐥𝐥 𝐛𝐞 𝐚 𝐩𝐚𝐫𝐭 𝐨𝐟 𝐨𝐮𝐫 𝐬𝐭𝐨𝐫𝐢𝐞𝐬."
Business Valuation Principles for EntrepreneursBen Wann
This insightful presentation is designed to equip entrepreneurs with the essential knowledge and tools needed to accurately value their businesses. Understanding business valuation is crucial for making informed decisions, whether you're seeking investment, planning to sell, or simply want to gauge your company's worth.
Cracking the Workplace Discipline Code Main.pptxWorkforce Group
Cultivating and maintaining discipline within teams is a critical differentiator for successful organisations.
Forward-thinking leaders and business managers understand the impact that discipline has on organisational success. A disciplined workforce operates with clarity, focus, and a shared understanding of expectations, ultimately driving better results, optimising productivity, and facilitating seamless collaboration.
Although discipline is not a one-size-fits-all approach, it can help create a work environment that encourages personal growth and accountability rather than solely relying on punitive measures.
In this deck, you will learn the significance of workplace discipline for organisational success. You’ll also learn
• Four (4) workplace discipline methods you should consider
• The best and most practical approach to implementing workplace discipline.
• Three (3) key tips to maintain a disciplined workplace.
Attending a job Interview for B1 and B2 Englsih learnersErika906060
It is a sample of an interview for a business english class for pre-intermediate and intermediate english students with emphasis on the speking ability.
[Note: This is a partial preview. To download this presentation, visit:
https://www.oeconsulting.com.sg/training-presentations]
Sustainability has become an increasingly critical topic as the world recognizes the need to protect our planet and its resources for future generations. Sustainability means meeting our current needs without compromising the ability of future generations to meet theirs. It involves long-term planning and consideration of the consequences of our actions. The goal is to create strategies that ensure the long-term viability of People, Planet, and Profit.
Leading companies such as Nike, Toyota, and Siemens are prioritizing sustainable innovation in their business models, setting an example for others to follow. In this Sustainability training presentation, you will learn key concepts, principles, and practices of sustainability applicable across industries. This training aims to create awareness and educate employees, senior executives, consultants, and other key stakeholders, including investors, policymakers, and supply chain partners, on the importance and implementation of sustainability.
LEARNING OBJECTIVES
1. Develop a comprehensive understanding of the fundamental principles and concepts that form the foundation of sustainability within corporate environments.
2. Explore the sustainability implementation model, focusing on effective measures and reporting strategies to track and communicate sustainability efforts.
3. Identify and define best practices and critical success factors essential for achieving sustainability goals within organizations.
CONTENTS
1. Introduction and Key Concepts of Sustainability
2. Principles and Practices of Sustainability
3. Measures and Reporting in Sustainability
4. Sustainability Implementation & Best Practices
To download the complete presentation, visit: https://www.oeconsulting.com.sg/training-presentations
RMD24 | Retail media: hoe zet je dit in als je geen AH of Unilever bent? Heid...BBPMedia1
Grote partijen zijn al een tijdje onderweg met retail media. Ondertussen worden in dit domein ook de kansen zichtbaar voor andere spelers in de markt. Maar met die kansen ontstaan ook vragen: Zelf retail media worden of erop adverteren? In welke fase van de funnel past het en hoe integreer je het in een mediaplan? Wat is nu precies het verschil met marketplaces en Programmatic ads? In dit half uur beslechten we de dilemma's en krijg je antwoorden op wanneer het voor jou tijd is om de volgende stap te zetten.
Falcon stands out as a top-tier P2P Invoice Discounting platform in India, bridging esteemed blue-chip companies and eager investors. Our goal is to transform the investment landscape in India by establishing a comprehensive destination for borrowers and investors with diverse profiles and needs, all while minimizing risk. What sets Falcon apart is the elimination of intermediaries such as commercial banks and depository institutions, allowing investors to enjoy higher yields.
Affordable Stationery Printing Services in Jaipur | Navpack n PrintNavpack & Print
Looking for professional printing services in Jaipur? Navpack n Print offers high-quality and affordable stationery printing for all your business needs. Stand out with custom stationery designs and fast turnaround times. Contact us today for a quote!
Taurus Zodiac Sign_ Personality Traits and Sign Dates.pptxmy Pandit
Explore the world of the Taurus zodiac sign. Learn about their stability, determination, and appreciation for beauty. Discover how Taureans' grounded nature and hardworking mindset define their unique personality.
Taurus Zodiac Sign_ Personality Traits and Sign Dates.pptx
13. value stream mapping
1. LEAN
SIX SIGMA
1
SL S
VALUE STREAM MAPPING
(CURRENT & FUTURE STATE)
By: -
Hakeem–Ur–Rehman
MS-TQM, M.I.O.M(Operations Research)
Certified Six Sigma Black Belt (Singapore)
Lead Auditor ISO 9001 (UK)
IQTM–PU
2. A visual representation of every process in the
material and information flow of a product’s path
from customer to supplier.
What is a Value Stream Map?
Information Flow
Start with the Customer
Material Flow
3. What is VSM?
According to Womack and Jones, the authors of the book Lean Thinking,
management must change their focus
o From:
o departments
o functions
o firms
o existing assets and technologies
o To:
o the value stream for specific products
A Value Stream is all the actions (both value added and non-
value added) required to bring a product to the customer.
It is:
“Big Picture”, not individual processes
Improving the whole, not just optimizing the parts
4. What is VSM?
Value Added and Non Value Added
Value Added Activity
Transforms or shapes material or information or people
And it’s done right the first time
And the customer wants it
Non-Value Added Activity – Necessary Waste
No value is created, but cannot be eliminated based on current
technology, policy, or thinking
Examples: project coordination, regulatory, company mandate, law
Non-Value Added Activity - Pure Waste
Consumes resources, but creates no value in the eyes of the
customer
Examples: idle/wait time, inventory, rework, excess check offs
A Value Stream is all the actions (both value added and non-value added) required
to bring a product to the customer.
5. Highlights Sources of
Waste
Emphasizes Material
and Information Flow
Uses
Link Individual
Processes to their
Customer(s) by
Continuous Flow or Pull
Each Process Produces
only what its Customer
needs when they need it
Goals
Value Stream Mapping
TWO KINDS OF
KAIZEN
6. Three Types of Value Streams
Raw
Material
PROCESS
VALUE STREAM
Finished
Product
PROCESSPROCESS
Stamping Welding
Raw Material to Finished Product
Research Engineering Production
VALUE STREAM
Concept New Product
Concept to Launch
Product
Costing
Ordering Accounting Payables
VALUE STREAM
Product Sale
Order to Cash
Assembly
Cell
7. VALUE STREAM
Finished
Product
Raw
Material
VSM methods are also used to
map business processes
ASSEMBLY
Layout
Stamping Process Machining Process Assembly Process
Value Stream
Plant Value Stream
Typically we examine the value stream in a
plant - from raw materials to finished goods.
Custo
-mer
8. Implementation without a plan will lead to disaster
A Value Stream
Map is a simple
visual tool that
helps you see the
flow, find the
waste and develop
an improved
process.
Eyes for Waste . . .
. . . Eyes for Flow
Why do it?
Clinic
Supplies
Syringes
X Ray
Film
Regional Supply
Manager
Clinic Manager
Clinic
Performance
Supply
Forecast
Frequent
Delivery
VP Performance
Clinic
Performance
Admitting Blood Draw X Ray Doctor Review
Billing
Stage for Blood
Log Time In
Record Value
Draw Blood
Record Value
Take X Ray
Review X Ray
Review Blood
Compile data from
patient records
Log Time OutPull patients to
Level Schedule
FIFO
Retake if Error Retake if Error
Verify Results Verify Results
Off-line
Operation
FIFO FIFO
Provide arrival windows for
patients to minimize waiting
(process time) (process time) (process time) (review time)
(minimal wait) (minimal wait) (minimal wait)
TPCT: 18 Minutes
Considerably reduced
through improved flow
LEGEND:
Electronic
Physical Flow
Feedback
2 Min
2.5 Min 2.5 Min 2 Min
3 Min 3 Min
3 Min
C/T 2 Minutes
C/T 2.5 MinutesC/T 2.5 MinutesC/T 3 Minutes
96% Improvement in TPCT
9. Understand how the work
site currently operates
Design a lean flow
Plan how to get there
Identify
Value Stream
Current State
Drawing
Action Plan
Future-State
Drawing
VALUE STREAM
MAPPING PROCESS
Identify improvement
opportunities
Identify and resolve gaps
Specific process /
product familyAdmitting
I
I
In
Hallway
LEGEND:
Electronic
Physical Flow
Feedback
Blood Draw X Ray Doctor Review Billing
Send to Waiting A
Log Time In
Record Value
Draw Blood
Record Value
Take X Ray
Review X Ray
Review Blood
Log Time Out
Record Values
Retest if Needed
Clinic
Supplies
Syringes
X Ray
Film
Regional Supply
Manager
Clinic Manager
Clinic
Performance
Supply
Requirements
I
In
Hallway
I
In
Hallway
Low Machine
Reliability
RetestsRandom
Arrivals
Delivery
Weekly
VP Performance
Clinic
Performance
Re Tests
Waiting Rm B
Capacity 4 Patients
Fill Room Next
Waiting RmA
Capacity 4 Patients
Fill Room First
Stop if “A” is Full
I
People
Waiting
Direct from A only if B empty
X Ray Blood Draw
Record Value
Take X Ray
Record Value
Draw Blood
Dual Path
Overflow to B
I
In
Hallway
(avg. wait in “A”)
(Transfer A to B)
(avg. wait in “B”)
(process time) (process time)
(avg. wait)
(process time)
(avg. wait)
(review time)
(avg. wait)
(process time)
TPCT: 423 Minutes
Unknown due to extreme
variability of data
C/T 10 Minutes
C/T 12 Minutes
C/T 12 Minutes C/T 13 Minutes
C/T 13 Minutes
NO
FIFO !
Lost
Patients
C/T 5 Minutes
C/T 18 Minutes
10 Min 5 Min 12 Min 13 Min
120 Min 40 Min 60 Min 50 Min 90 Min
5 Min 18 Min
7+ Hours
FTQ 50% FTQ 50%
FTQ 50% FTQ 50%
Clinic
Supplies
Syringes
X Ray
Film
Regional Supply
Manager
Clinic Manager
Clinic
Performance
Supply
Forecast
Frequent
Delivery
VP Performance
Clinic
Performance
Admitting Blood Draw X Ray Doctor Review
Billing
Stage for Blood
Log Time In
Record Value
Draw Blood
Record Value
Take X Ray
Review X Ray
Review Blood
Compile data from
patient records
Log Time OutPull patients to
Level Schedule
FIFO
Retake if Error Retake if Error
Verify Results Verify Results
Off-line
Operation
FIFO FIFO
Provide arrival windows for
patients to minimize waiting
(process time) (process time) (process time) (review time)
(minimal wait) (minimal wait) (minimal wait)
TPCT: 18 Minutes
Considerably reduced
through improved flow
LEGEND:
Electronic
Physical Flow
Feedback
2 Min
2.5 Min 2.5 Min 2 Min
3 Min 3 Min
3 Min
C/T 2 Minutes
C/T 2.5 MinutesC/T 2.5 MinutesC/T 3 Minutes
96% Improvement in TPCT
Action Item Responsible
Improve X Ray Equipment Reliability Sherry Wilson (Med-Tech)
Improve Blood Draw Process Vlad
Technician Training - Verify Test Results Dr. Choi
Implement Use of Patient Record as Data Log Joe Packer (Billing)
Modify Waiting Areas for New Patient Flow Jeremy Monroe (Orderly)
Develop Daily Material Pull with Suppliers Amy Dawes (Regional PCL)
Develop Level Schedule for Patient Arrival Ed Case (Admitting)
- - - 2001 - - - - - - 2002 - - -
Q1 Q2 Q3 Q4 Q1 Q2 Q3 Q4
10. VSM Current State
SELECTING PRODUCT FAMILY
1 2 3 4 5 6
A
X X X X X
B
X X X X X X
C
X X X X X
D
X X X
E
X X X
F
X X X X
Products
Assembly and Equipment
A Product
Family
Create a matrix if your mix is complicated
11. FORM A TEAM
Cross Functional
Team
Manufacturing
Financial
Purchasing
Leadership
Production
Control
EngineeringSensei
This step is critical to insure
successful implementation
VSM CURRENT STATE
Select a cross-functional
team
Select team members
familiar with the process
Make sure the team is
trained to use VSM
Designate a Champion
(typically a line manager)
12. Understand The Customer Demand & Map the Current Processes
VSM CURRENT STATE
1. Understand the customer Demand
2. Draw the current Process Map
1.What you THINK it is …
2. What it ACTUALLY is…
3. What it SHOULD be…
13. MATERIAL FLOW ICONS
Assembly
XYZ
Corporation
Data Box
C/O=30 min.
C/T=45 sec.
3 Shifts.
2% Scrap
I
300 pieces
1 day
Inventory Supermarket
Shipment
Push Finished Goods
to Customer
Physical
FIFO
First-In-First-Out
Process
Box
Supplier/
Customer
Mon
+ Wed
Pull
General Icons
Uptime
Changeover
Kaizen
Lightning Burst
Operator
Buffer or
Safety Stock
“Go See”
Production
Schedule
14. INFORMATION FLOW ICONS
Manual
Information Flow
Electronic
Information Flow
Weekly
Schedule
Schedule
OXOX
Load
Leveling Box
Sequenced-Pull
Ball
Withdrawal
Kanban
Production
Kanban
Signal
Kanban
Kanban
Post
15. TOTAL PRODUCT CYCLE TIME METRICS
VSM CURRENT STATE
1 Shift
Overtime = 4hr/d
C/T = 2s
Takt = 5s
2 Shifts
C/O = 4 hours
5% Downtime
2 Presses
WIP = 5,000 pcs
WIP = 1,500 pcs
Takt = 8s
4 Operators
C/T = 7s
2% Scrap/Rework
20% Downtime
7 Operators
Takt = 12s
C/T = 11s
WIP = 600 pcs
10% Downtime/
Scrap/Rework
C/O = 25 min
FINISHED GOODS
WELDING ASSEMBLYSTAMPING
Steel Supplier
PC&L
MRP
MSS
I
Steel
4 days
I
10,000 pcs
10 days
I
2,000 pcs
2 days
I
1,200 pcs
1.2 days
Mon &
Wed
1 time
daily
6 Week
Rolling
Forecast
Weekly
Order
Weekly
Order
6 Week
Rolling
Forecast
Weekly Build
Schedule
Daily Ship
Schedule
UPTIME
CHANGEOVER
SCRAP
Layout
4 days
5 days
10 days
1.5 days
2 days
.6 days
1.2 days
TPc/t = 24.3 daysProcessing Time
Inventory Time
CUSTOMER
Volume Info:
20,000 pcs/month
Std. pack = 300
pcs2 shifts
Takt = 54s
Upper line is Production Lead Time measured in days or hours
– Production Lead Time = Inventory Quantity Daily Customer Requirement
Lower line is Process Time measured in minutes or seconds
17. VSM Current State: ACME EXERCISE
CUSTOMER:
“State Street Assembly”
SELECTED PRODUCT FAMILY:
“Stamped–Steel Steering Brackets”
State Street
Assembly
State Street
Assembly
18. 1x Daily
Coils
5 days
I I
4600 L
2400 R
Stamping
1
S. Weld #1
1 1
S. Weld #2
Ass’y #1
1 1
Ass’y #2
Shipping
Staging
I
1100 L
600R
I
1600 L
850R
I
1200 L
640R
I
2700 L
1440R
C/O=1 hour
C/T=1 sec
Uptime
=85%
27,600
sec. avail.
C/T=39 sec
Uptime =
100%
27,600
sec. avail.
C/O=10 m
C/T=46 sec
Uptime =
80%
27,600
sec. avail.
C/O=10 m
C/T=62 sec
Uptime =
100%
27,600
sec. avail.
C/O = 0
C/T=40 sec
Uptime =
100%
27,600
sec. avail.
C/O = 0
Production Control
MRP
18400 pieces/month
-12000- L
- 6400- R
Tray = 20 pieces
2 shifts
Daily Ship
Schedule
Daily
Order
90/60/30 day
forecasts
Weekly Schedule
6 week
forecast
Weekly
Fax
Michigan Steel
Company
State Street
Assembly
State Street
Assembly
500 ft coils
Tues. &
Thurs.
VSM Current State: ACME EXERCISE
19. VSM - Acme Exercise
Draw production lead time/value-added timeline
Calculate production lead time for inventory triangles by dividing
quantity of inventory by the customer daily requirement
This is a really neat trick! It turns a count of inventory into the
number of production days that inventory represents
Stamping / Weld
18,400 pieces/mo / 20 days = 920 pieces/day
920 / 16 hours (2 shifts) = 57.5 pieces/hour
7000 pieces (total Inv.) / 57.5 pieces/hour = 121.7 hours of
Inv.
121.7 hours of Inv. / 16 hours = 7.6 days of Inventory
Finish the rest of the calculations.
What is the inventory production lead time?
20. 1x Daily
Coils
5 days
I I
4600 L
2400 R
Stamping
1
S. Weld #1
1 1
S. Weld #2
Ass’y #1
1 1
Ass’y #2
Shipping
Staging
I
1100 L
600R
I
1600 L
850R
I
1200 L
640R
I
2700 L
1440R
C/O=1 hour
C/T=1 sec
Uptime
=85%
27,600
sec. avail.
C/T=39 sec
Uptime =
100%
27,600
sec. avail.
C/O=10 m
C/T=46 sec
Uptime =
80%
27,600
sec. avail.
C/O=10 m
C/T=62 sec
Uptime =
100%
27,600
sec. avail.
C/O = 0
C/T=40 sec
Uptime =
100%
27,600
sec. avail.
C/O = 0
Production Control
MRP
18400 pieces/month
-12000- L
- 6400- R
Tray = 20 pieces
2 shifts
Daily Ship
Schedule
Daily
Order
90/60/30 day
forecasts
Weekly Schedule
6 week
forecast
Weekly
Fax
Michigan Steel
Company
State Street
Assembly
State Street
Assembly
500 ft coils
Tues. &
Thurs.
VSM Current State: ACME EXERCISE
5 days
1 sec
7.6
days
1.8
days
2.7
days
2
days
4.5
days
40 sec62 sec46 sec39 sec
PLT = 23.6 days
PT = 188 sec.
21. VSM: FUTURE STATE
How to Create the Future State
Issue: You have mapped a current state, so what should your ideal or future state map look
like?
Overproduction – eliminate overproduction, or attempt to level production.
CHARACTERISTICS OF A LEAN VALUE STREAM
Guideline #1: Produce to your Takt time “Synchronizes pace of production to match
pace of sales”.
“Future State Map; Takt Time is noted in the data box”
22. VSM: FUTURE STATE
CHARACTERISTICS OF A LEAN VALUE STREAM
Guideline #2: Develop Continuous flow wherever possible
Produce one piece at a time
Reduce batch sizes and implement material replenishment.
Should you build to a finished goods Supermarket or
directly to shipping?
Building directly to shipping is ideal.
If the competitive lead time is less than your process
lead time, you will need a finished goods
supermarket.
If customer demand rises and falls unpredictably
it might be better to use a finished goods
Supermarket.
The cost of holding some finished goods may
well be less than the cost of extra capacity
23. VSM: FUTURE STATE
CHARACTERISTICS OF A LEAN VALUE STREAM
Guideline #3:
Use supermarkets to control production where continuous flow does not extend
upstream. “Where will you need to use supermarket pull systems?”
Batching might be necessary
Where changeover is necessary due to very fast or slow cycle times and multiple product
families.
Long supply chain…One piece at a time is not realistic
Some processes have too much lead time or too unreliable to couple directly to other processes
in a continuous flow.
In these cases install a Supermarket based pull system
Supermarkets are used when continuous flow is interrupted
Remember, flow is better. There is a cost associated with a supermarket
24. VSM: FUTURE STATE
CHARACTERISTICS OF A LEAN VALUE STREAM
Guideline #4: Try to send the customer schedule to only one production process.
“At what single point will you schedule production? (PACEMAKER PROCESS)”
How you control the production at this process; sets the pace for all of the
upstream processes.
Any process after the pacemaker process must be continuous- flow ( no
Supermarkets or pulls downstream of the pacemaker process.
Therefore, the pacemaker process is frequently the most downstream
continuous-flow process in the value stream.
25. VSM: FUTURE STATE
CHARACTERISTICS OF A LEAN VALUE STREAM
Guideline #5: Distribute the production of different
products evenly overtime at pacemaker process. (Level
the production mix). “How will you level the production
mix at the pacemaker process?”
Distribute the production of different products evenly over
time at the pacemaker process.
Grouping products makes it difficult to serve customers who
need something different than the batch being produced at that
time.
On-time deliveries suffer. A part that is due tomorrow might
not make it because it has to wait for the long batches to
complete.
The icon for leveling is OXOX
26. VSM: FUTURE STATE
CHARACTERISTICS OF A LEAN VALUE STREAM
Guideline #6: What increment of work will you
consistently release and take away at the pacemaker
process? (Level the Production Volume)
Start by releasing small consistent amounts at the
pacemaker process, while simultaneously taking away
equal amounts of finished goods or “paced withdrawal”
This consistent increment of work is called the PITCH
Can be based on pack–out container quantity
Establishes interval for monitoring status of production
The key is to create a predictable flow which enables you
to act quickly to problems.
Example: If Takt time = 30 Seconds & Pack Size = 20 Pieces then Pitch = (30
Seconds X 20 Pieces = 600 seconds = 10 minutes)
27. VSM: FUTURE STATE
CHARACTERISTICS OF A LEAN VALUE STREAM
Guideline #6: (Level the Production Volume …)
A tool used to by some is the (heijunka box)
A load leveling box with a column for Kanban slots for each PITCH
interval and a row of Kanban slots for each product type.
The box indicates both the quantity produced and the time allocated
to make it (based on TAKT time)
Type
A
Type
B
Type
C
8 8.10 8.20 8.30 8.40 8.50
Kanban
card A
Kanban
card C
9.00 9.10
Kanban
card A
Kanban
card A
Kanban
card B
Kanban
card B
Kanban
card B
Kanban
card C
One column per pitch
Here pitch=10 min.
One row per
product type
Kanbans
responded
to from left
to right at
pitch
increments
28. VSM: FUTURE STATE
CHARACTERISTICS OF A LEAN VALUE STREAM
Guideline #6: (Level the Production Volume …)
Type
A
Type
B
Type
C
8 8.10 8.20 8.30 8.40 8.50
Kanban
card A
Kanban
card C
9.00 9.10
Kanban
card A
Kanban
card A
Kanban
card B
Kanban
card B
Kanban
card B
Kanban
card C
Customer
requirement
Shipping
4
1
3
2
Pacemaker
process
Drop Kanban
at process
Pick up one
finished
quantity
Move finished
parts to
supermarket
Pick up
next
kanban
29. VALUE STREAM MAPPING
FUTURE STATE
ACME EXERCISE
FIRST VIEW of the Future-State map:
Showing Takt Time, Weld/Assembly Cell, and the
Finished-Goods Supermarket
30. VALUE STREAM
Acme Co. Future State – 1st View
Stamping
Takt=60 sec.
C/T=56 sec.
C/O= 0
Uptime=100%l
2 shifts
Weld& Assy
L
R Shipping
Staging
1X
Daily
State St.
Assembly
18,400 pcs/mo
-12,000 “L”
-6,400 “R”
Tray=20 pcs.
2 Shifts
Notice that on this Future-State Map the four welding and
assembly process boxes have been combined into one
process box to indicate the continuous flow.
A small sketch of a cell inside the process box also indicates
the cellular manufacturing concept.
31. VALUE STREAM MAPPING
FUTURE STATE
ACME EXERCISE
SECOND VIEW of the Future-State map:
Showing Stamping and Raw Material Supermarkets
32. VALUE STREAM
Acme Co. Future State – 2nd View
The stamping process needs to produce batches larger than 60 pieces.
A trigger point is set up in the stamping supermarket which includes changeover,
replenishment delay and other stamping problems. In this case stamping will keep
1.5 days of parts in its supermarket
A signal Kanban is sent to the stamping process whenever the number of bins
remaining drops to a trigger ( minimum ) level
Signal or Batch
kanban
WHAT ABOUT RAW MATERIAL?
To build a plant level value stream the Future State must also show a third
supermarket at the receiving dock which holds coils of steel
Acme can attach an internal withdrawal Kanban to each coil and send these
Kanbans to their own production control department whenever another coil is
used.
Production control can order coils based on their actual usage instead of a best
guess determined by MRP
The cards are then returned to the receiving dock as a signal for shipments that
are due.
Milk runs for daily deliveries should be considered at this point
33. Stamping
Takt=60 sec.
C/T=56 sec.
C/O= 0
Uptime=100%l
2 shifts
Weld& Assy
L
R Shipping
Staging
1X
Daily
State St.
Assembly
18,400 pcs/mo
-12,000 “L”
-6,400 “R”
Tray=20 pcs.
2 Shifts
20
1.5 days
batch
bin
Coils
PRODUCTION
CONTROL
State St.
Assembly
6-WEEK
Forecast
Daily
Order
1X
Daily
coil
coil
(at the press)
VALUE STREAM
Acme Co. Future State – 2nd View
34. VALUE STREAM MAPPING
FUTURE STATE
ACME EXERCISE
THIRD VIEW of the Future-State map:
Showing Load Leveling, Changeovers, and Timeline
35. The material handler pulls the Kanbans out of
the leveling box one-by-one at the PITCH
increment and moves trays of brackets from
the finished goods supermarket to the
staging area one-by- one according to the
withdrawal Kanban.
Production
Control
Daily Orders
bin
bin
bin
OXOX
WELD&ASSY
L
R
bin
Shipping
Staging
Load Leveling Box
VALUE STREAM
Acme Co. Future State – 3rdView
36. Stamping
Takt=60 sec.
C/T=56 sec.
C/O= 0
Uptime=100%l
2 shifts
Weld& Assy
L
R Shipping
Staging
1X
Daily
State St.
Assembly
18,400 pcs/mo
-12,000 “L”
-6,400 “R”
Tray=20 pcs.
2 Shifts
1.5 days
batch
bin
Coils
PRODUCTION
CONTROL
State St.
Assembly
6-WEEK
Forecast
Daily
Order
1X
Daily
coil
coil
(at the press)
EPE= 1 shift.
EPE <10 min..
change
over
Weld
change
over
Welder
uptime
1 sec.
1.5 days
1 day
168 sec
2 days
Production Lead-time= 4.5 days
Processing Time= 169sec
20
20
20
20
OXOX
Daily order
90/60/30 day
Forecasts
Daily
Order
VALUE STREAM
Acme Co. Future State – Complete View
State that within a plant the value stream map helps to identify waste and layout the flows - this is critical for supporting a viable improvement plan.
Restate that this process can also be used for any flow.
Mention that a Value Stream Map is nothing more than a picture of the operation at a point in time and pictures help us see things more clearly
Emphasize - Eyes for Waste and Eyes for Flow