Download as PDF, PPTX
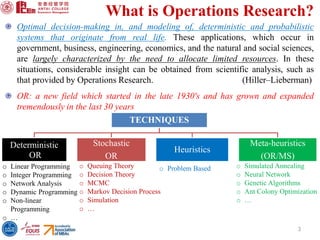


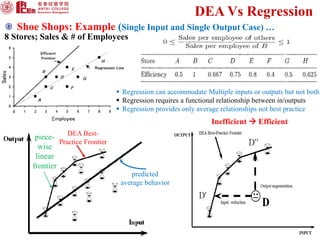


DEA is a linear programming technique used to measure the relative efficiency of decision-making units that have multiple inputs and outputs. It constructs a production frontier boundary defined by the most efficient DMUs to evaluate the efficiency of other DMUs relative to this frontier. Examples of DMUs include banks, schools, countries, etc. DEA allows each DMU to determine its own optimal input and output weights to calculate efficiency scores compared to best practice DMUs on the frontier. This document provides an overview of DEA, its applications, advantages over regression analysis, and the general DEA model.