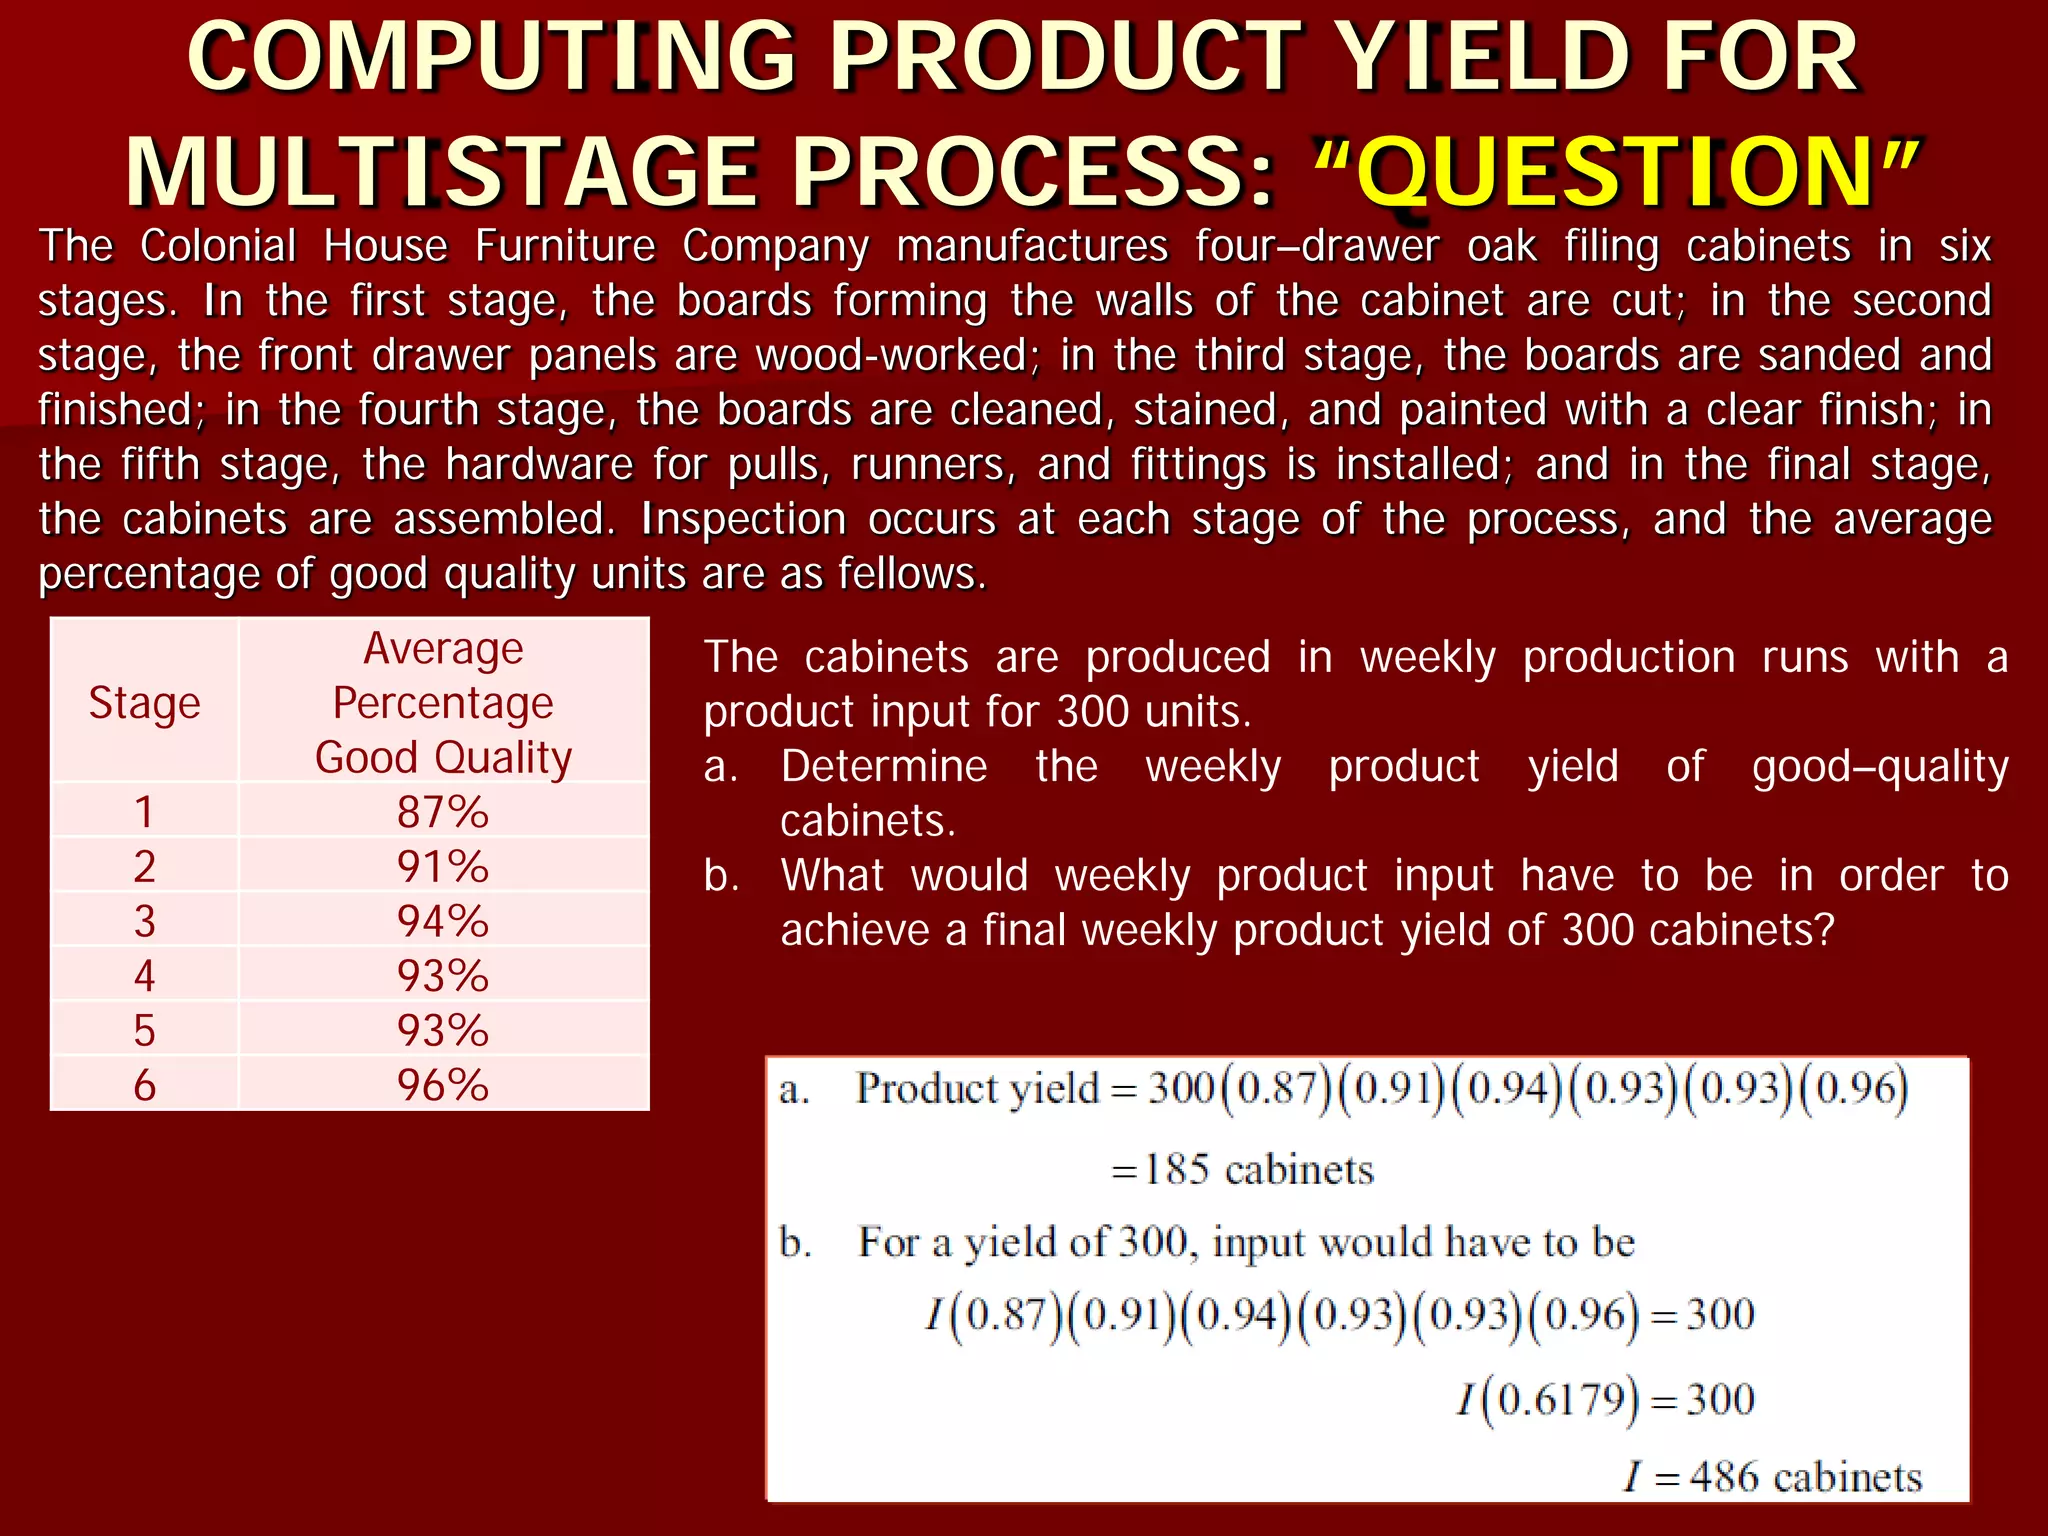
Downloaded 288 times


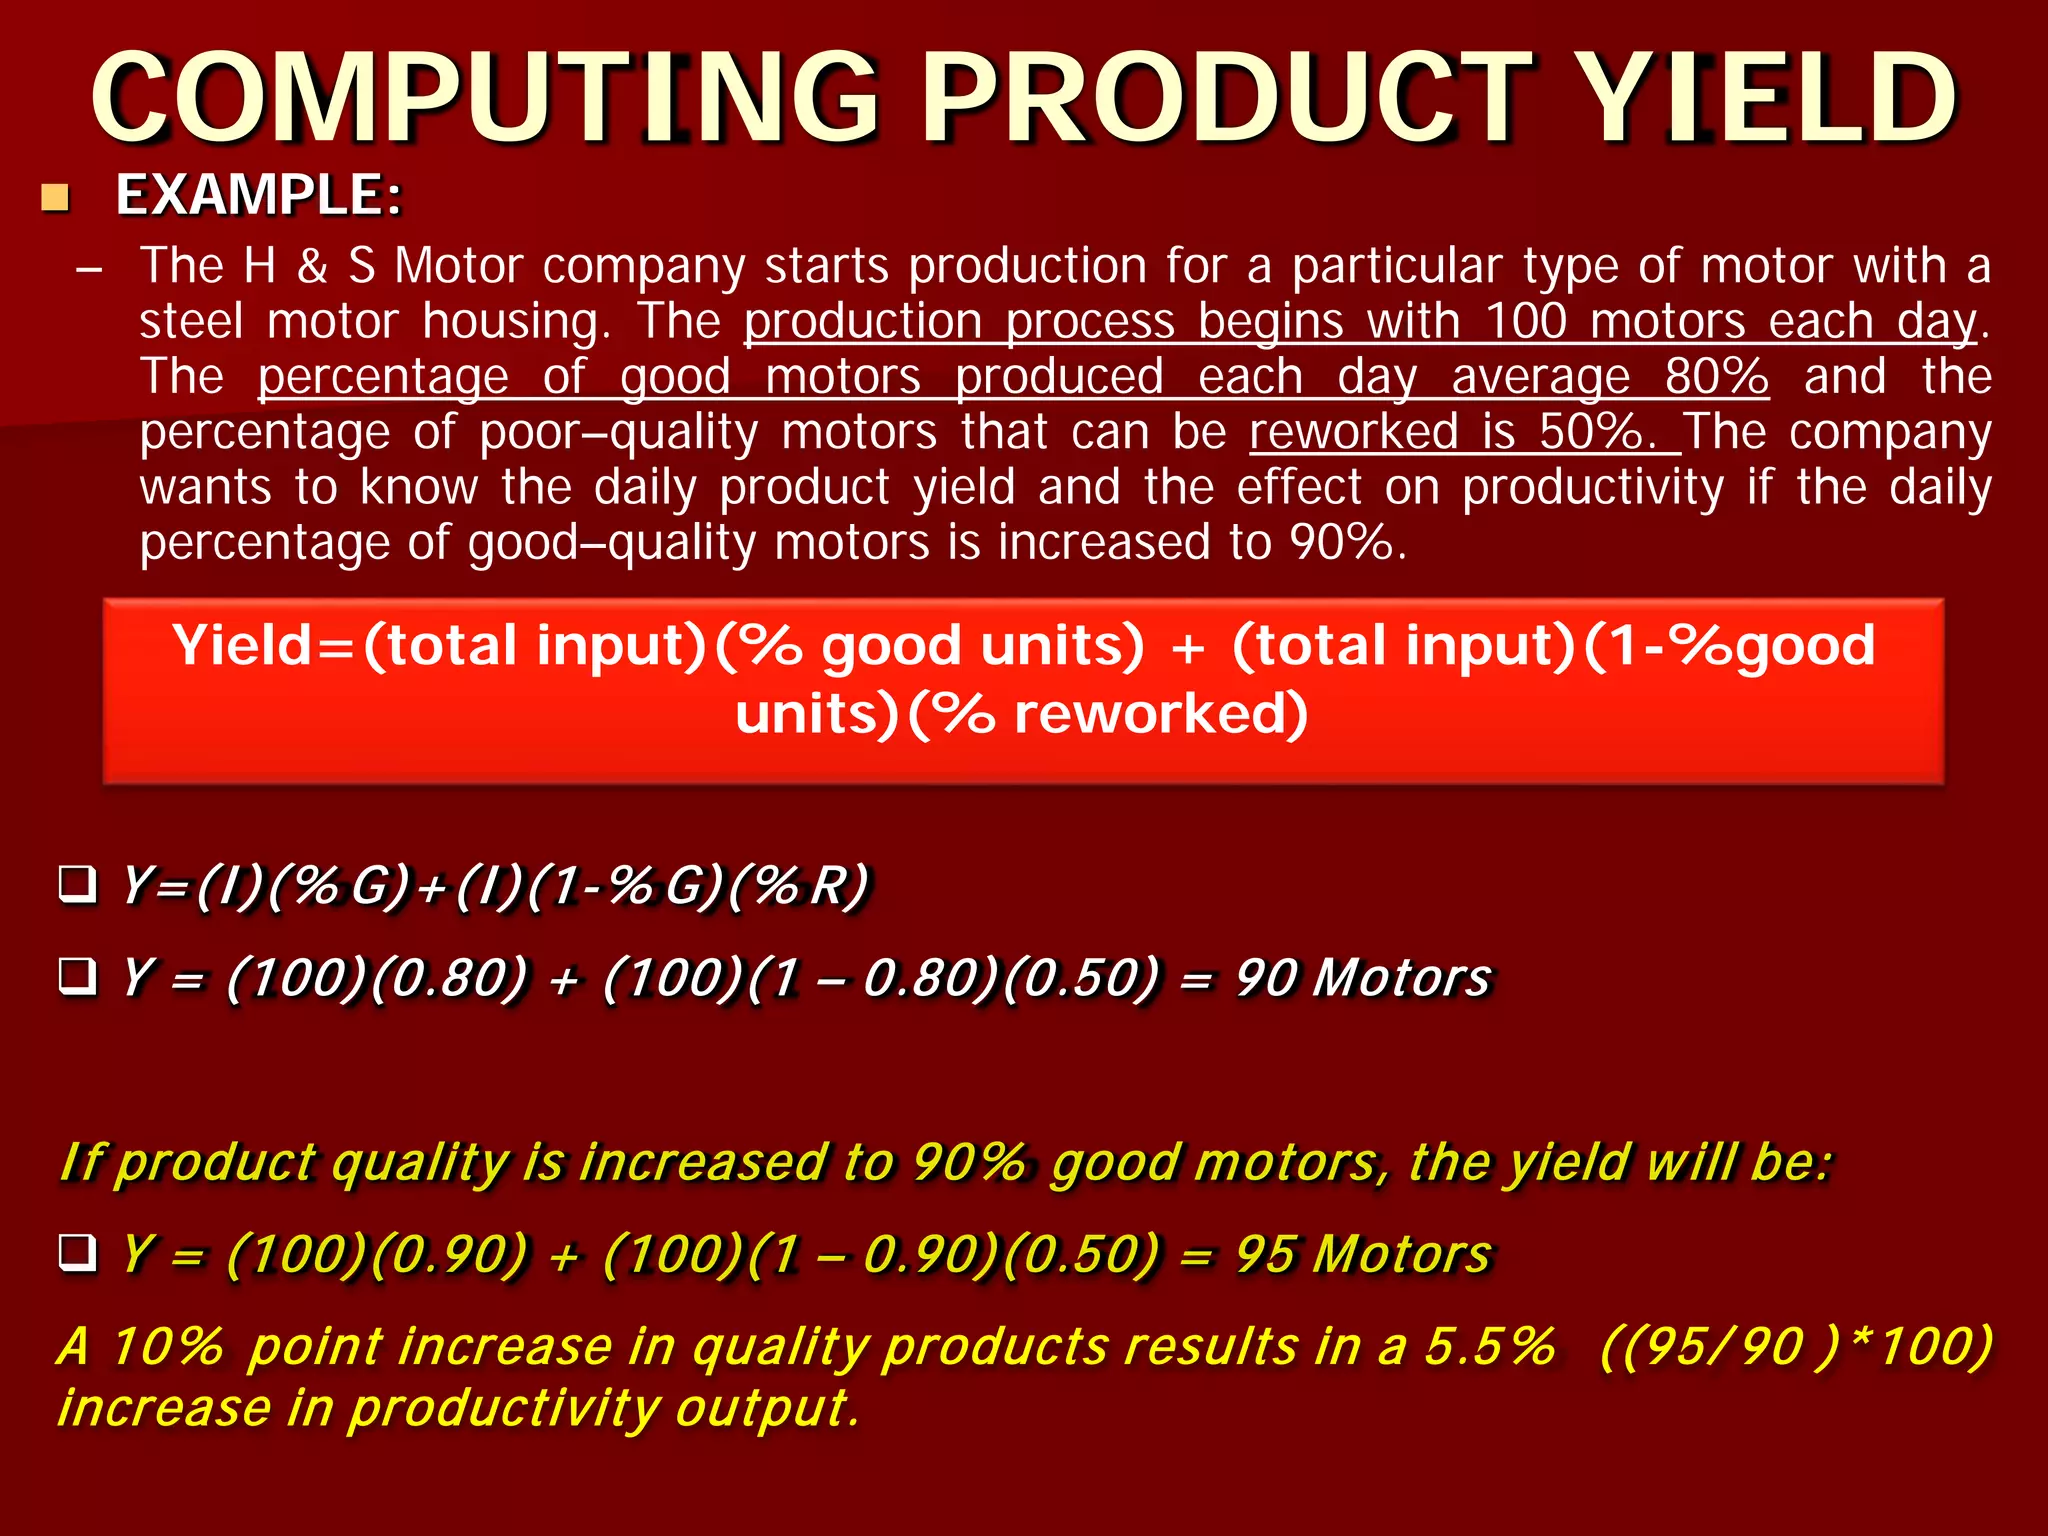
![AN EVALUATION OF QUALITY COSTS & QUALITY
INDEX NUMBERS: “EXAMPLE (Cont…)”
Quality Index = [(Total Quality Costs) / Base] X 100
The Index Number for 2004 sales is:
– Quality Cost per sale = [(810,400/4,360,000)] X 100 = 18.58%
Year Quality Sales
Index
Quality Manufacturing
Index
2004 18.58 46.04
2005 18.63 45.18
2006 12.66 34.00
2007 10.49 28.80
“The H&S Company quality index numbers reflect dramatically improved quality
during he four – year period”
Quality Costs as a Proportion of both sales & manufacturing costs improved
significantly
Quality Index Numbers are useful in showing trends in product quality over time
and reflecting the impact of product quality relative to accounting measures with
which managers are usually familiar](https://image.slidesharecdn.com/2-161104025452/75/2-cost-of-quality-10-2048.jpg)


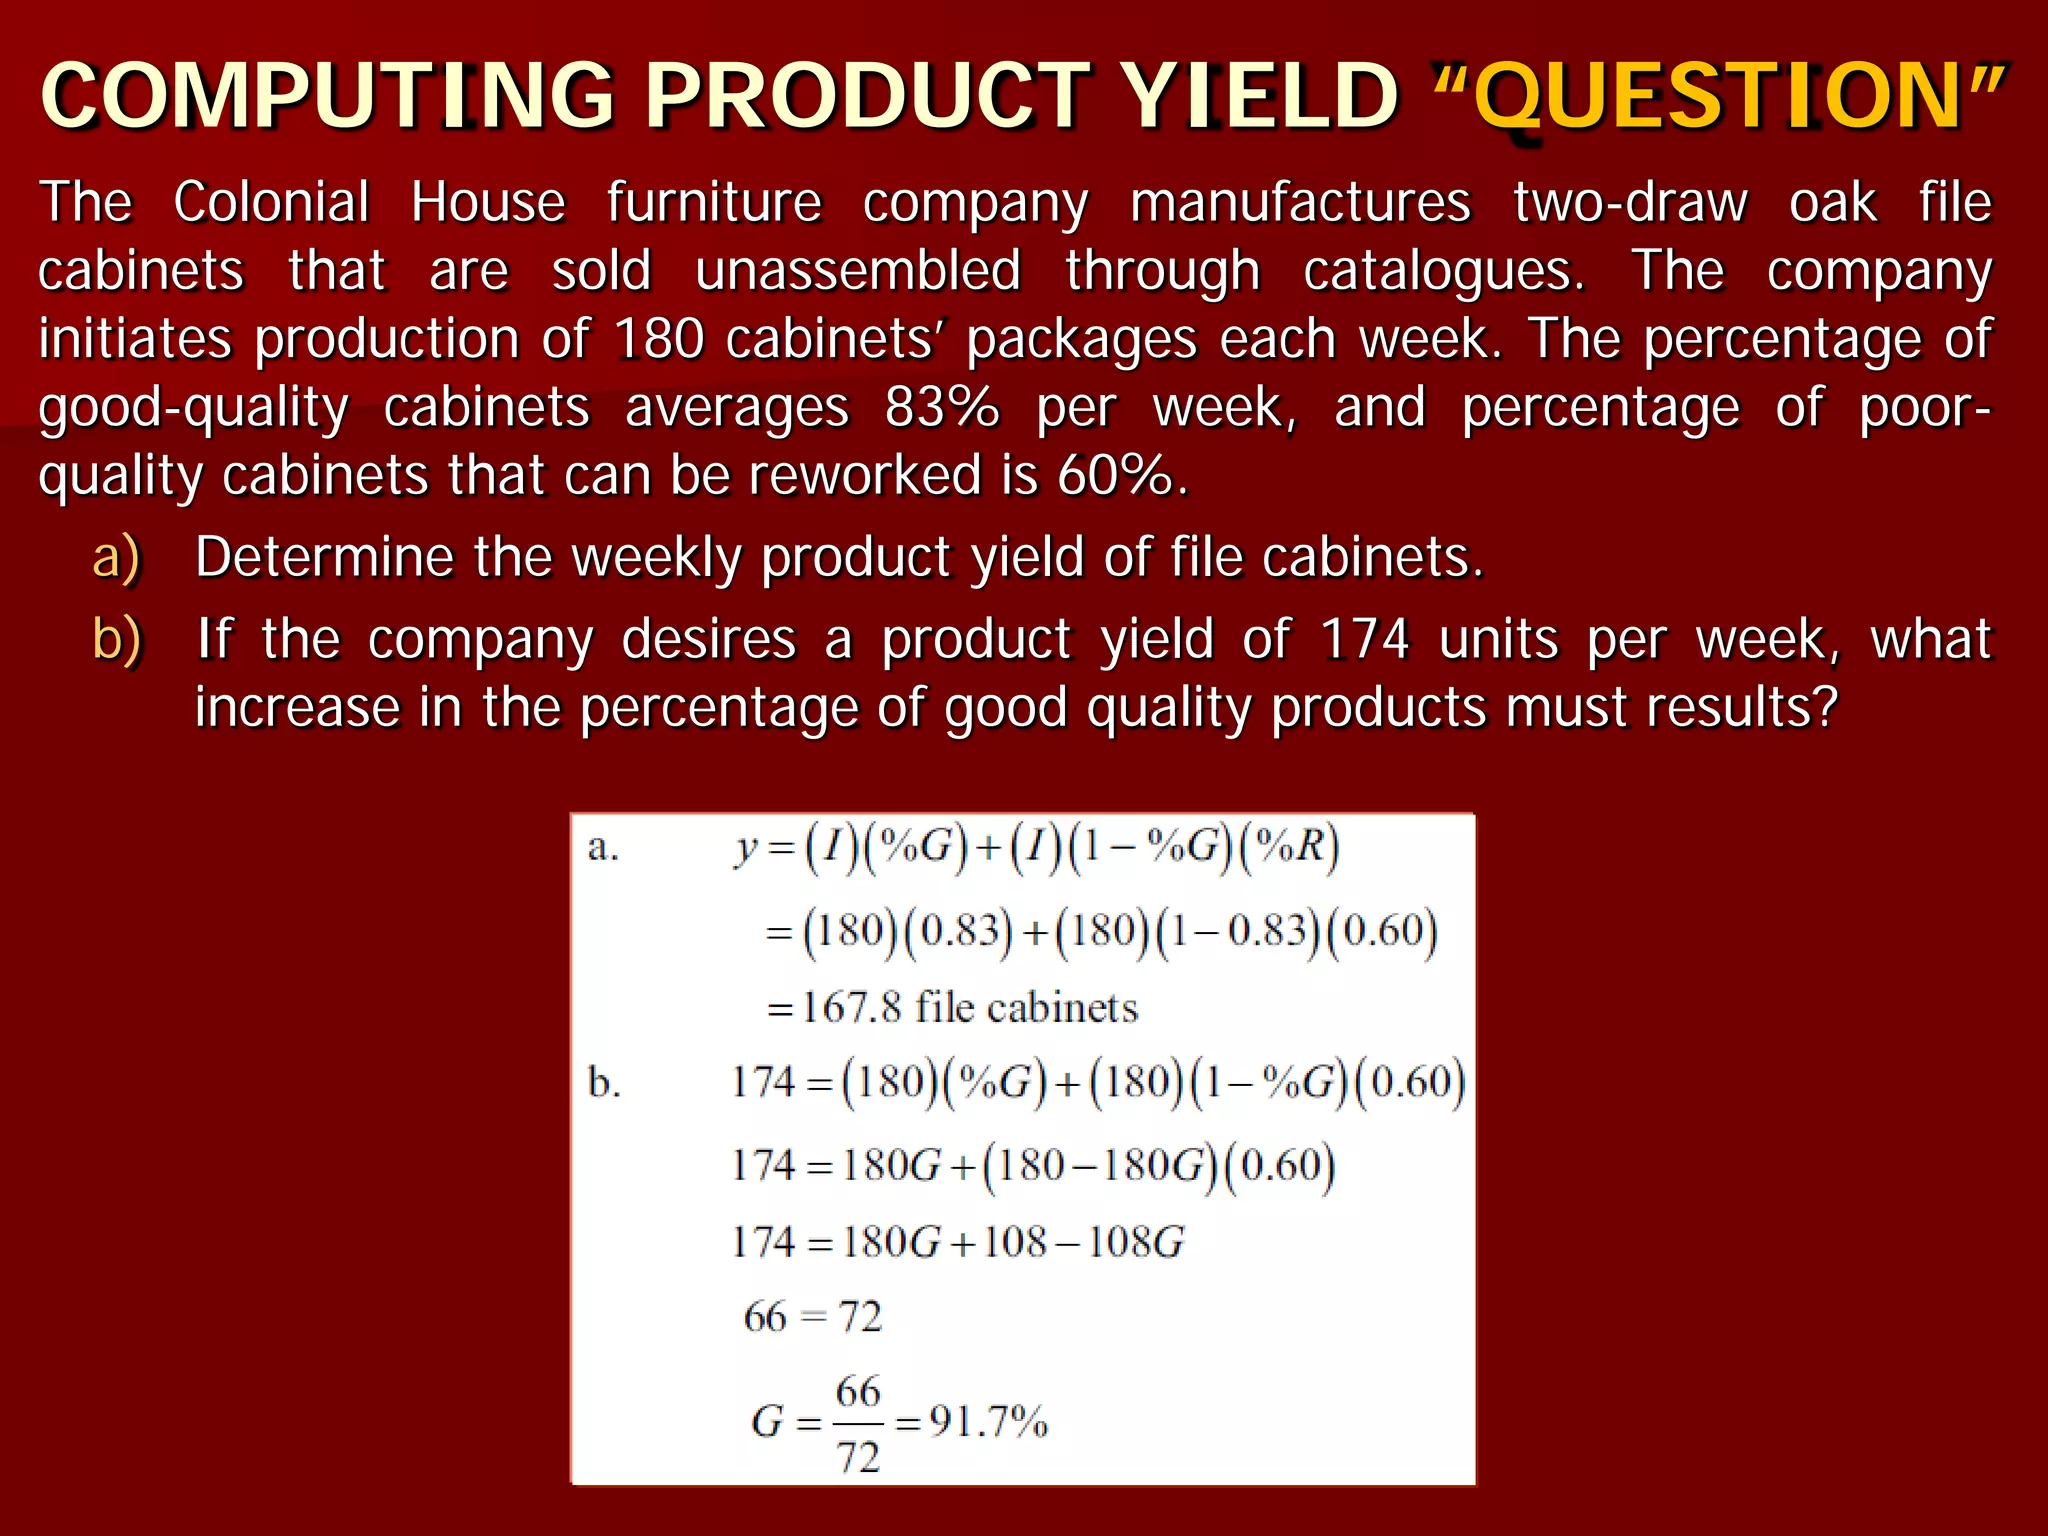
![COMPUTING PRODUCT COST PER UNIT
EXAMPLE:
– The H & S Motor company has a direct manufacturing cost per unit of $30, and
motors that are of inferior quality can be reworked for $12 per unit. From
previous Example, 100 motors are produced daily, 80% (on average) are of good
quality and 20% are defective. Of the defective motors, half can reworked to
yield good–quality products. Through its quality management program, the
company has discovered a problem in its production process that, when corrected
(at a minimum cost), will increase the good – quality products to 90%. The
company wants to assess the impact on the direct cost per unit of improvement
in product quality.
The Original manufacturing cost per motor is:
Product Cost
= [($30)(100) + ($12)(10)] / 90 motors
= $34.67 per motor
The manufacturing cost per motor with the quality improvement is:
Product Cost = [($30)(100) + ($12)(5)] / 95 motors = $32.21 per motor
“The improvement in the production process as a result of the quality management program will
result in a decrease of $2.46 per unit, or [(34.67–32.21)/34.67] X 100 = 7.1%, in direct
manufacturing cost per unit as well as a 5.5% increase in product yield (computed in previous
example), with a minimal investment in Labor, plant, or equipment.
Y
RKIK rd ))(())(( +
=](https://image.slidesharecdn.com/2-161104025452/75/2-cost-of-quality-17-2048.jpg)


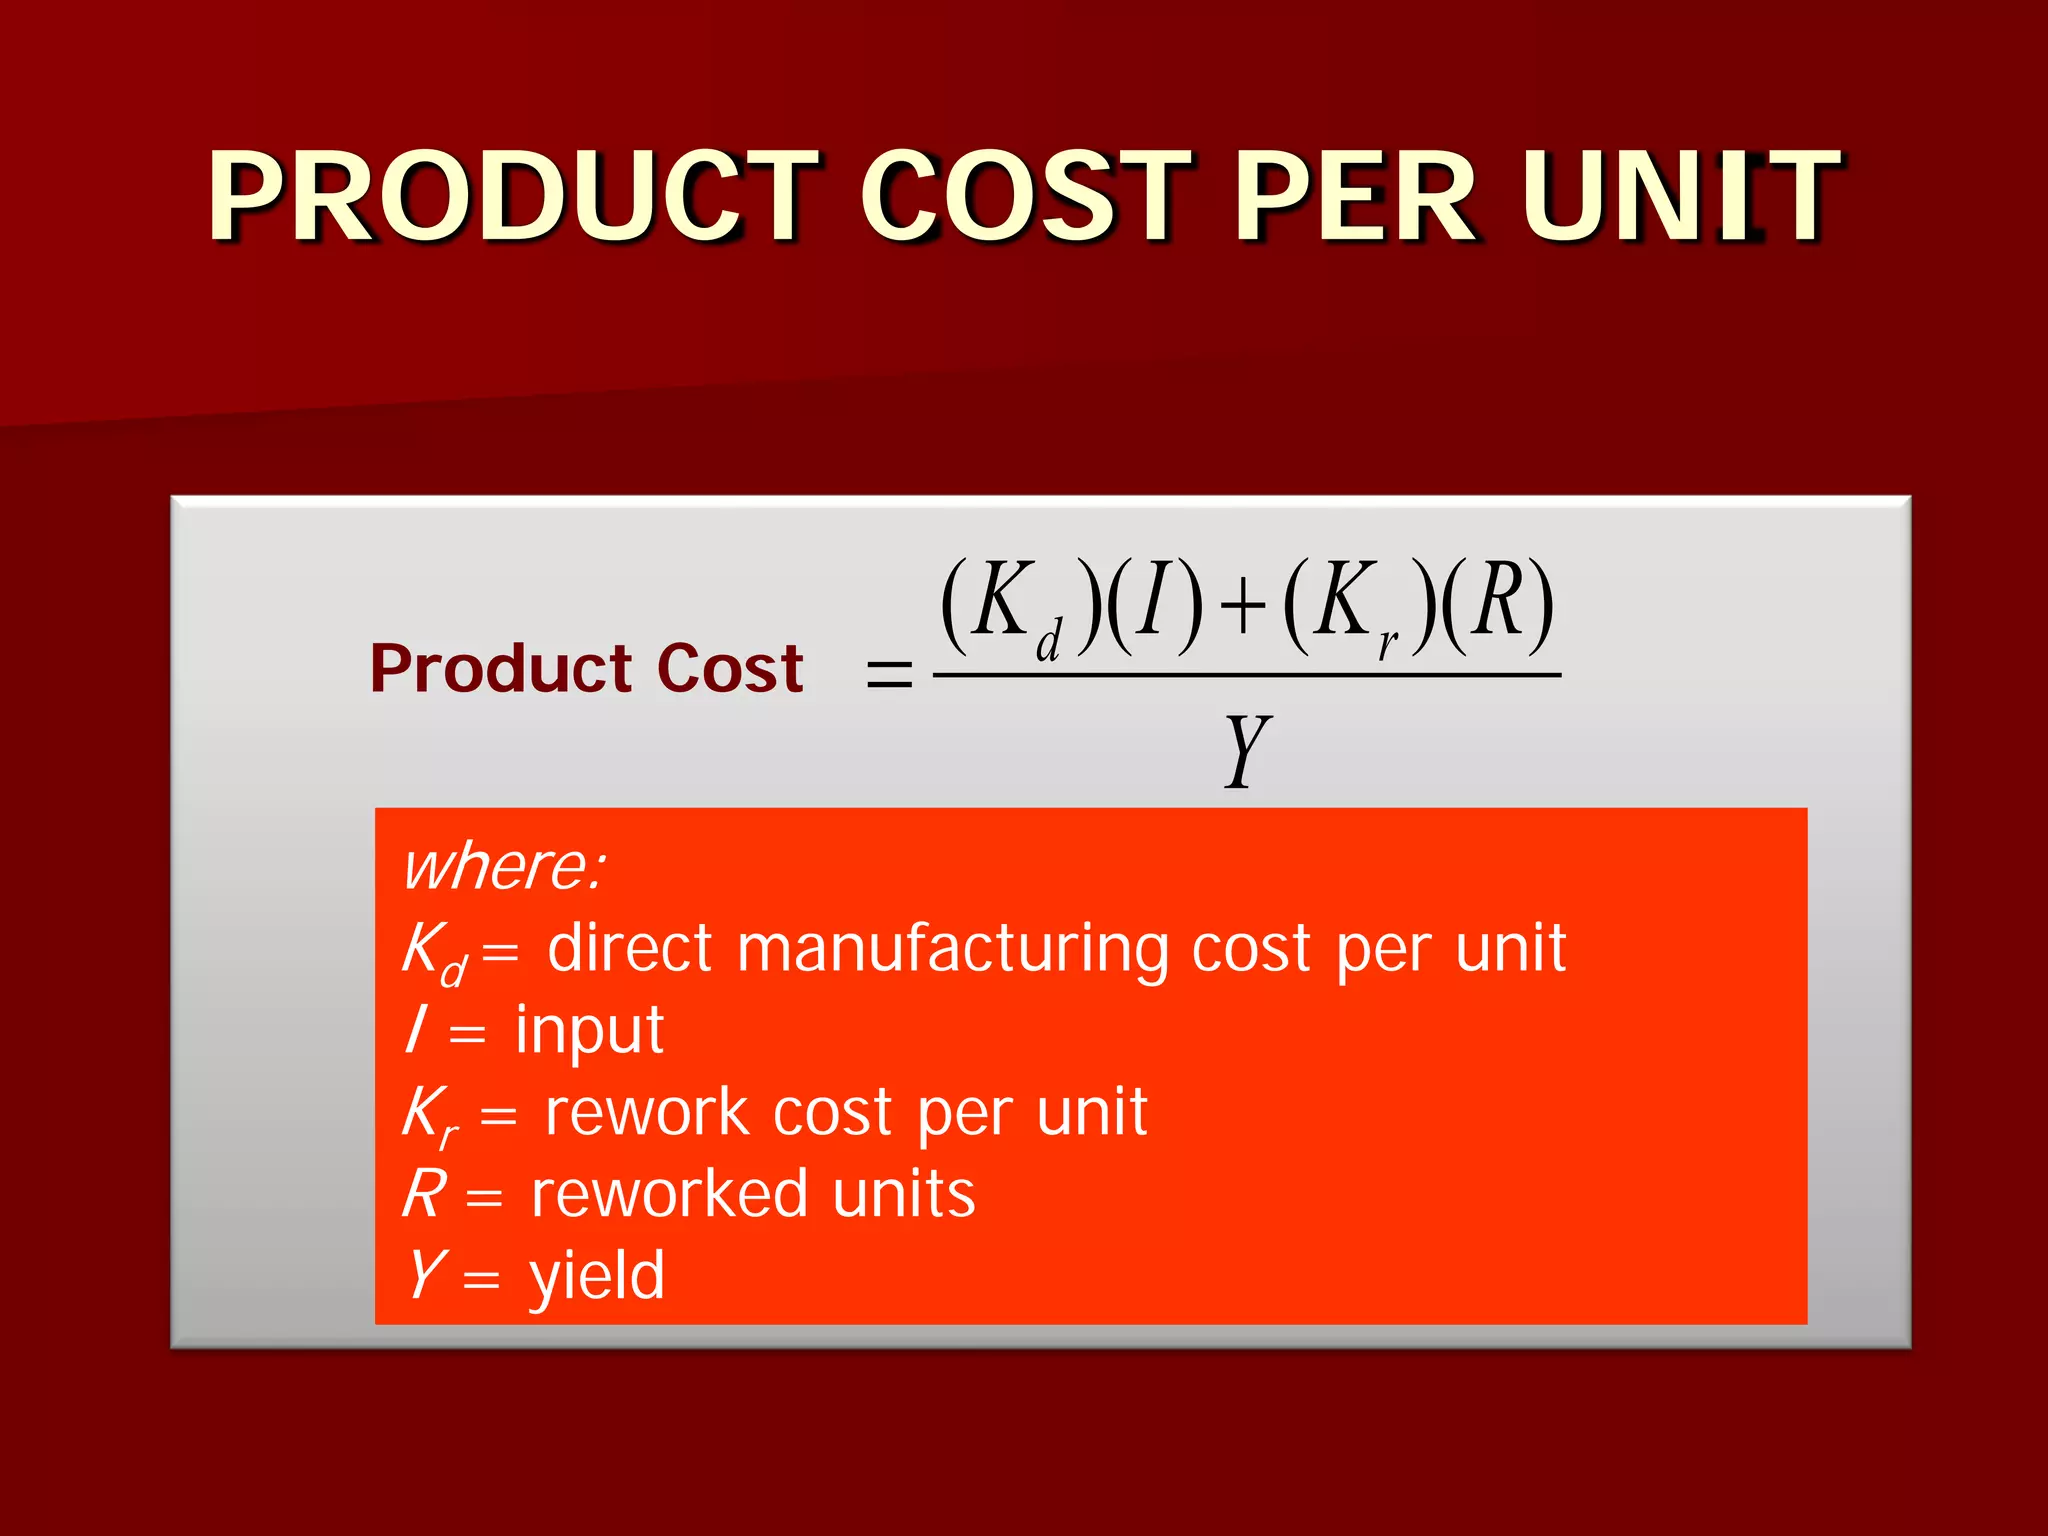
![COMPUTING QUALITY & PRODUCTIVITY RATIO
EXAMPLE:
– The H&S Motors Company produces small motors at a process cost of
$30 per unit. Defective motors can be reworked at a cost of $12 each.
The company produces 100 motors per day on average 80% good-
quality motors., resulting in 20% defects, 50% of which can be reworked
prior to shipping to customers. The company wants to examine the
effects of:
1. Increase the production rate to 200 motors per day
2. Reducing the processing cost to $26 and the rework cost to $10
3. Increasing, through quality improvement, the product yield of good
quality products to 95%
4. The combination 2 & 3
SOLUTION:
– QPR for the base case:
QPR = [(80 + 10) / {(100)($30) + (10)($12)}] X 100
QPR = 2.89
QPR =
(non-defective units)
(input) (processing cost) + (defective units) (reworked cost)](https://image.slidesharecdn.com/2-161104025452/75/2-cost-of-quality-25-2048.jpg)
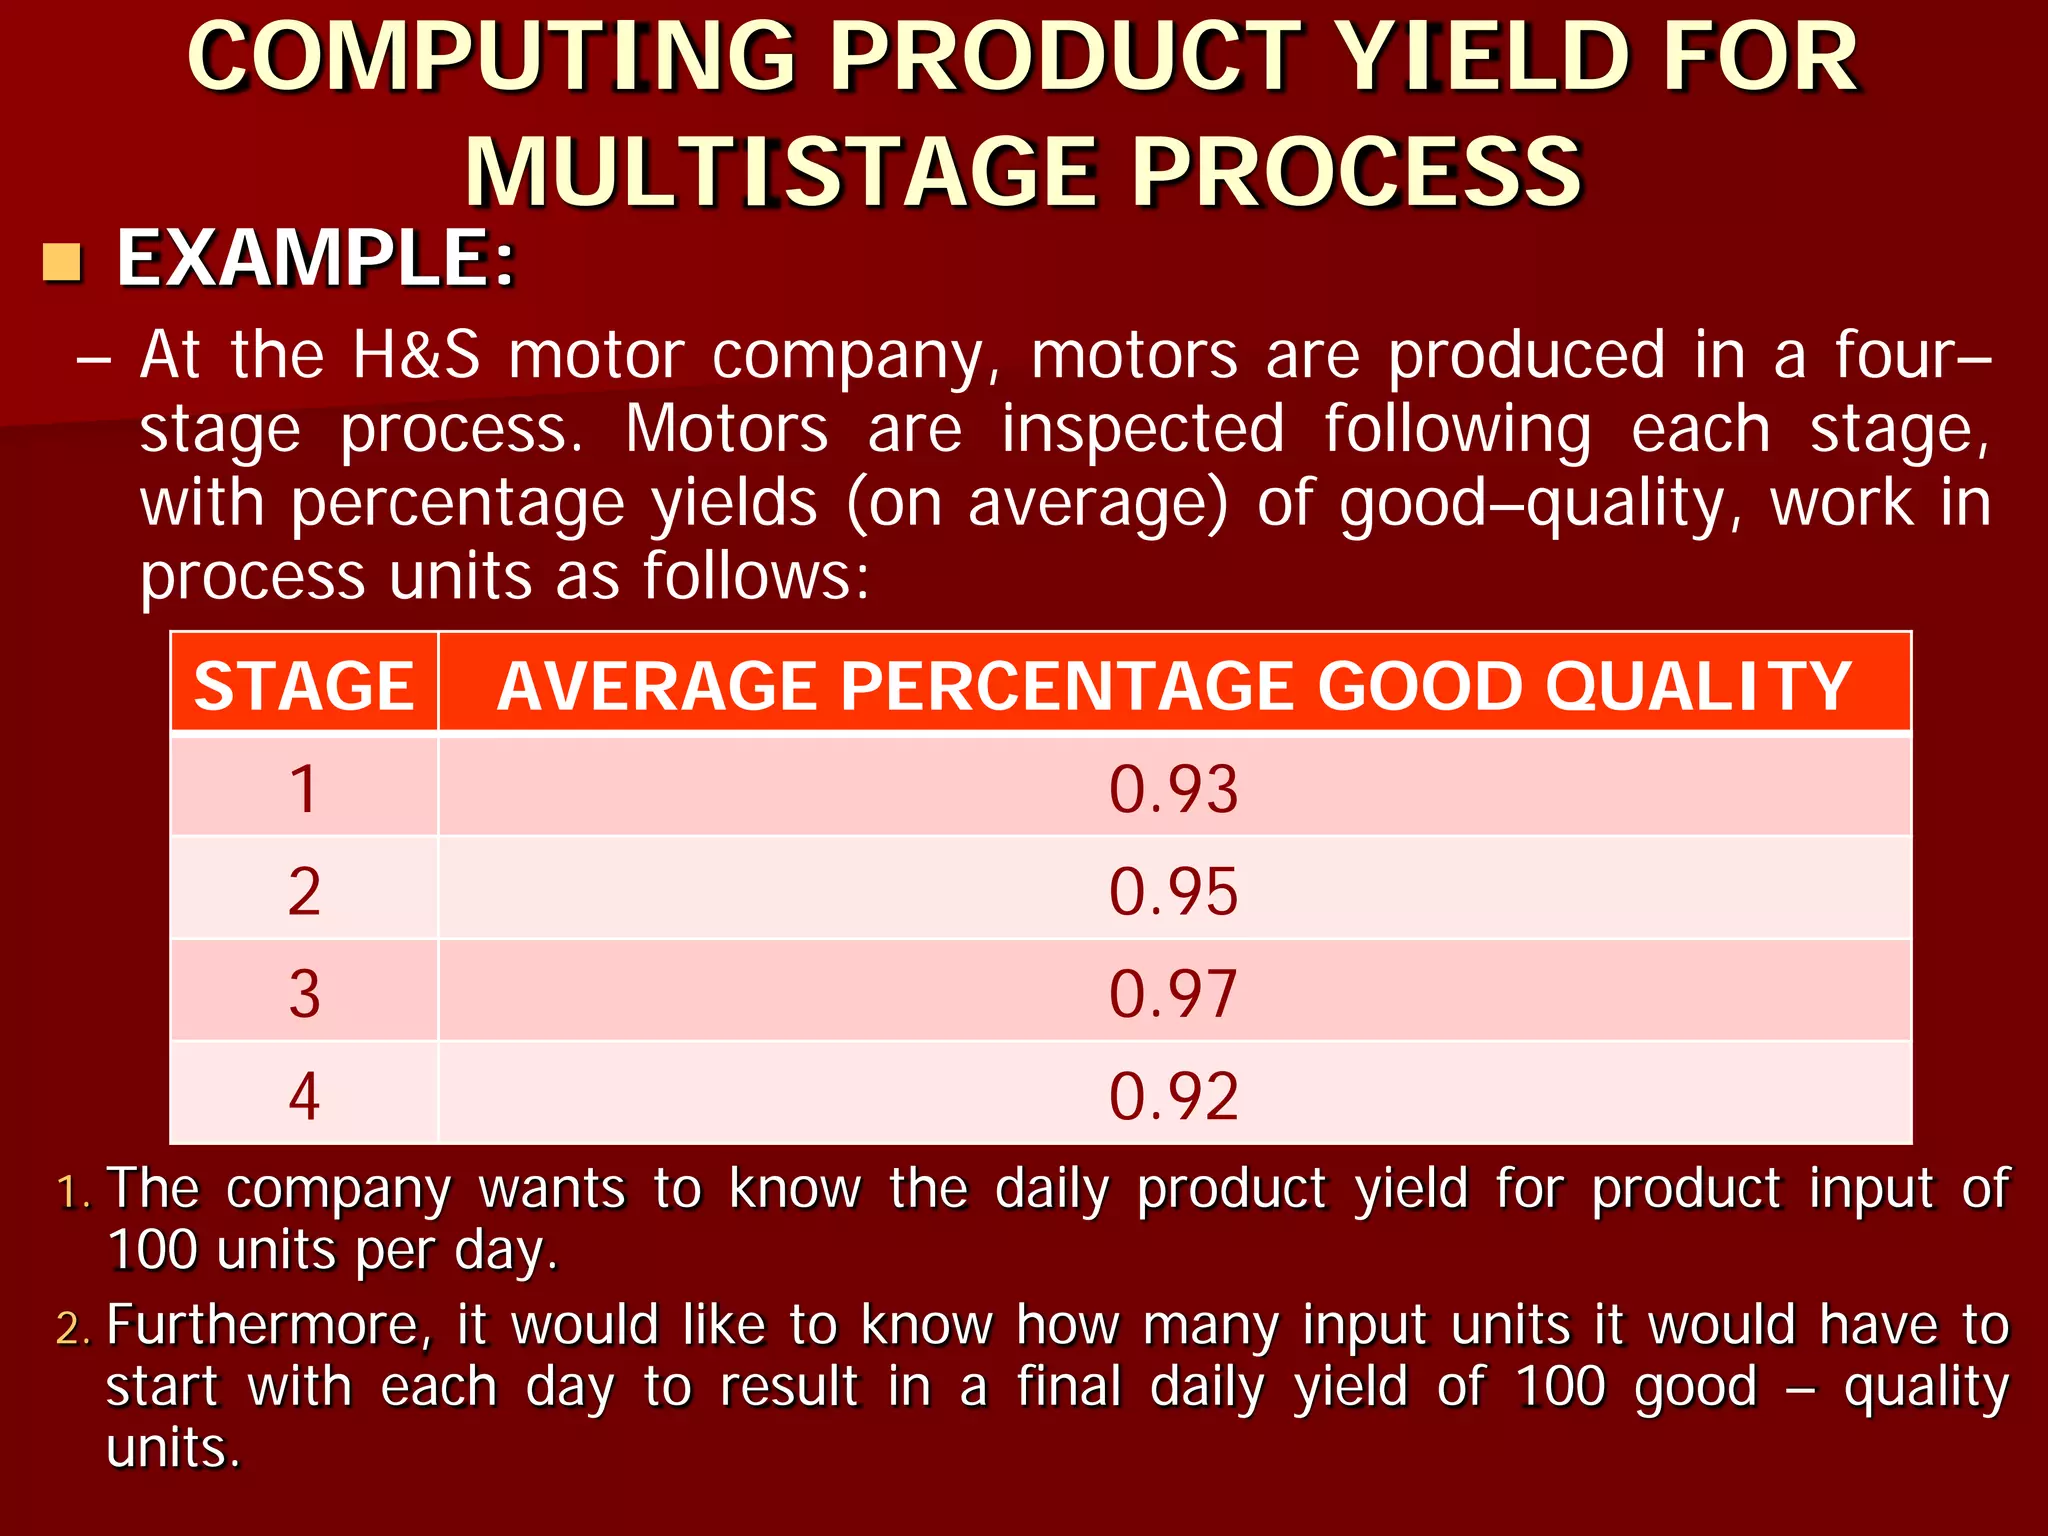
![COMPUTING QUALITY & PRODUCTIVITY RATIO
SOLUTION:
– Case#1: “Increase input to production capacity of 200 units”
QPR = [(160 + 20) / {(200)($30) + (20)($12)}] X 100
QPR = 2.89
“Increasing production capacity alone has no effect on the QPR”
– Case#2: “Reduce processing cost to $26 and rework cost to $10”
QPR = [(80 + 10) / {(100)($26) + (10)($10)}] X 100
QPR = 3.33
“Processing & Rework cost decreases caused the QPR to increase”
– Case#3: “Increasing, through quality improvement, the product yield of
good quality products to 95% ”
QPR = [(95 + 2.5) / {(100)($30) + (2.5)($12)}] X 100
QPR = 3.22
“Again, QPR increases as product quality improves”
– Case#4: “Decrease costs & increase initial good-quality units”
QPR = [(95 + 2.5) / {(100)($26) + (2.5)($10)}] X 100
QPR = 3.71
“The larger increase in the QPR results from decreasing costs &
increasing initial good quality products through improved quality”](https://image.slidesharecdn.com/2-161104025452/75/2-cost-of-quality-26-2048.jpg)


The document discusses concepts related to total quality management including quality costing, measurement, and productivity. It defines categories of quality costs such as prevention costs, appraisal costs, internal failure costs, and external failure costs. Methods for measuring and reporting quality costs using index numbers are presented, with an example showing quality index numbers over four years. The relationship between quality, yield, and productivity is explored through examples calculating product yield for single and multi-stage processes. The quality-productivity ratio is introduced as a metric that increases with improvements in processing costs, rework costs, and product quality.