Downloaded 1,198 times
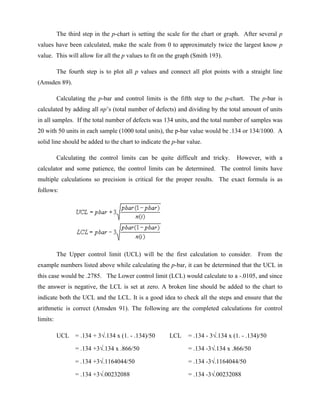
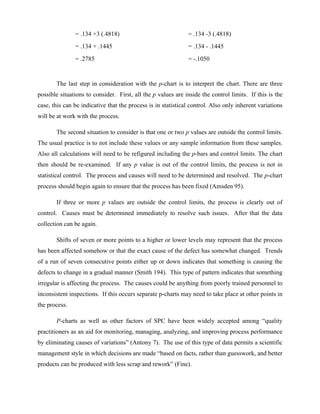
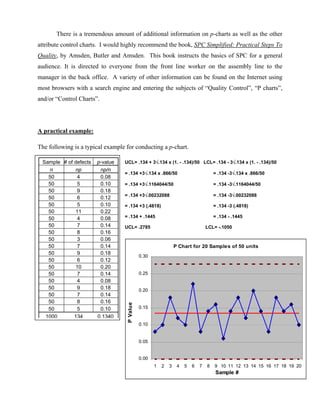

The document discusses p-charts, which are attribute control charts used to monitor the proportion of defective items in a production process. P-charts track the fraction of nonconforming items in samples over time. There are six basic steps to constructing a p-chart: collecting data and determining sample size/frequency, calculating the p-value for each sample, scaling the chart, plotting p-values and connecting points, calculating the p-bar and control limits, and interpreting the chart to determine if the process is in control. P-charts help identify when a process is out of control so that causes of variation can be addressed to improve quality.